

Judging from the breathless press releases and the 8% spike in oil futures, OPEC is moments away from announcing a deal that will send crude up over $60 and stocks to new, all-time highs.
But, we’ve been here before. So, pardon me if I take the latest “news” with a grain of salt. Should the deal get done, what impact will it really have on prices? Here are the two critical charts to watch today.
continued for members…
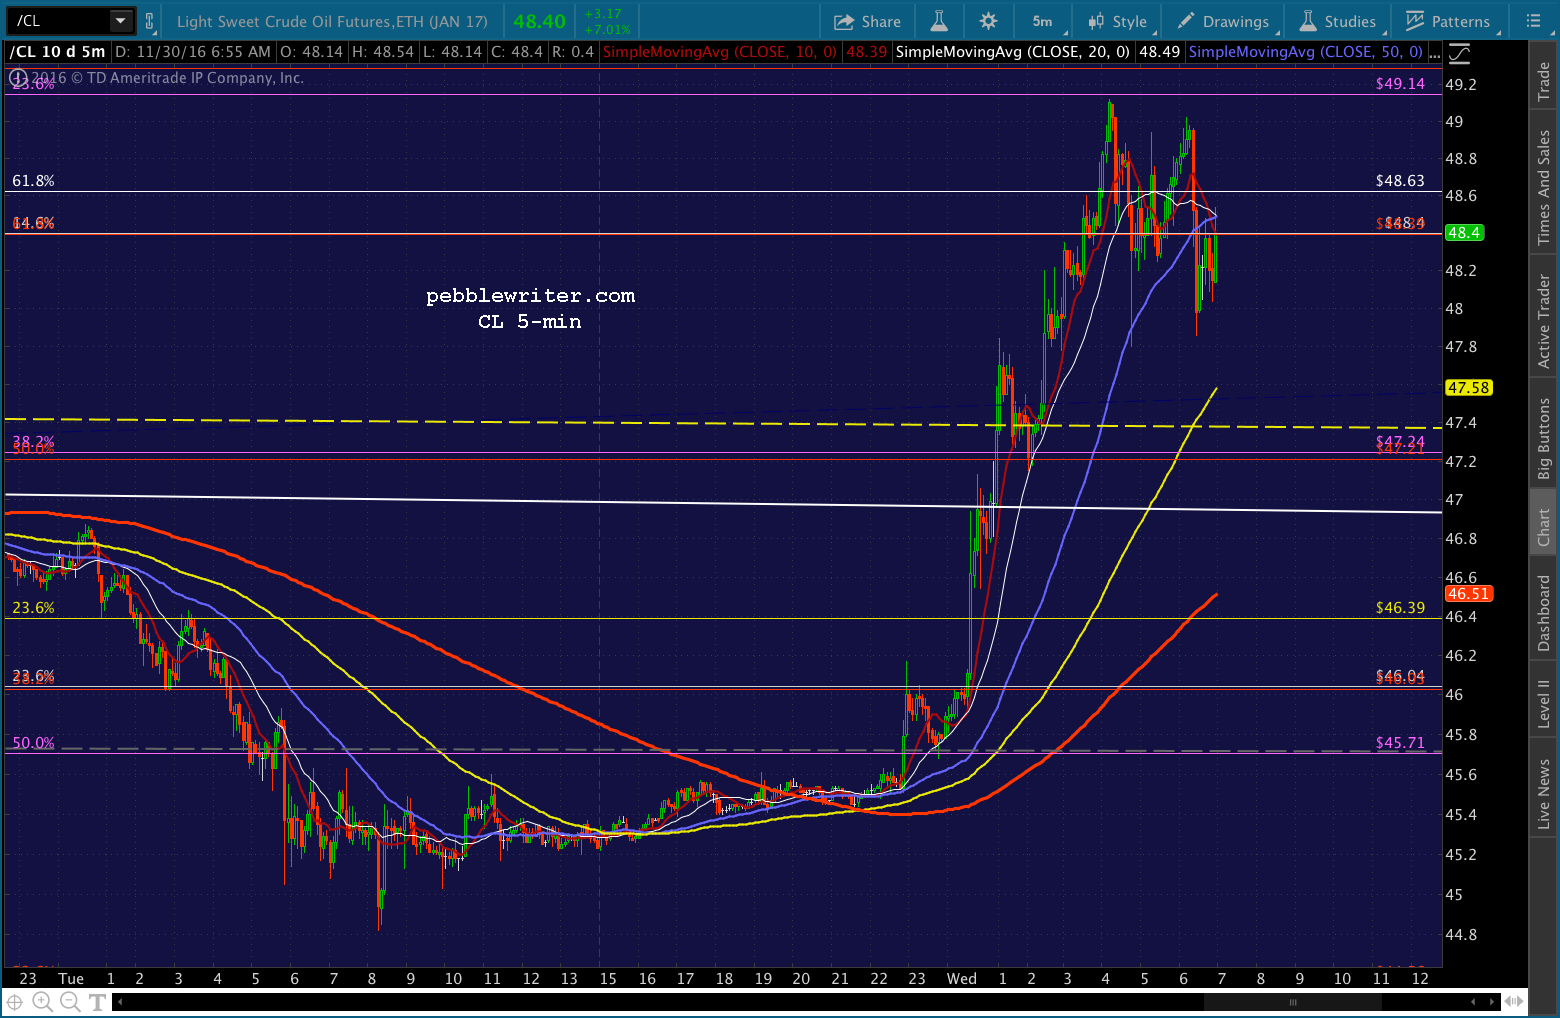
If the deal does in fact get done, CL is back to a completed IH&S Pattern that promises much higher prices. Though I suspect TPTB will be satisfied with backtesting the broken white channel at a slightly higher high than 52.22. Anything higher and they have inflation problems on their hands. Watch the neckline.

And, if SPX holds the futures’ gains, then the completed IH&S we discussed yesterday awaits.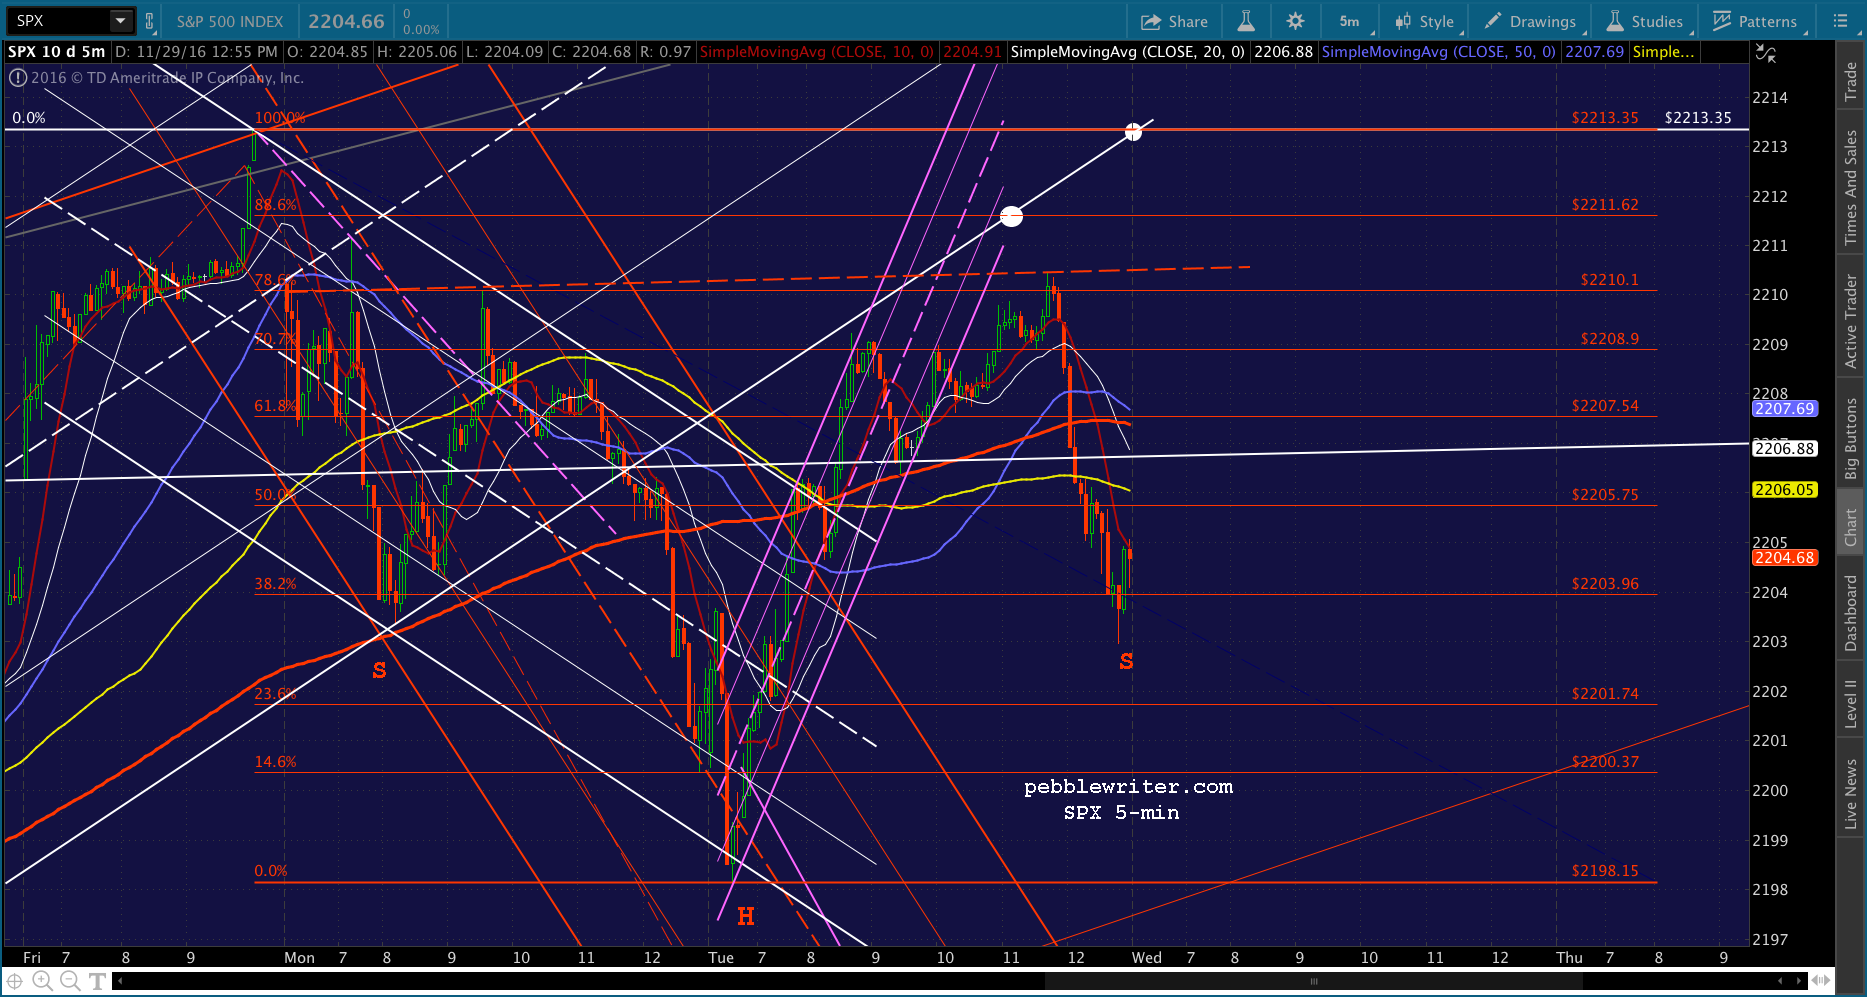
UPDATE: 9:38 AM
Going out on a limb here and shorting at 2213.63. Tight stops, of course. The reason – ES and SPX’s backtests at new highs. This feels quite overdone.

Make no mistake about it: this is a concerted effort. Even though CL hasn’t even reached its Nov 22 highs and DX is still backing off last week’s highs… …USDJPY is breaking out, threatening new highs.
UPDATE: 9:55 AM
Those were the easy points. We’ll have to see how things go here at the .786/neckline, especially as the SMA5 10 arrives in a few. Expect the bulls to try to hold the line, here.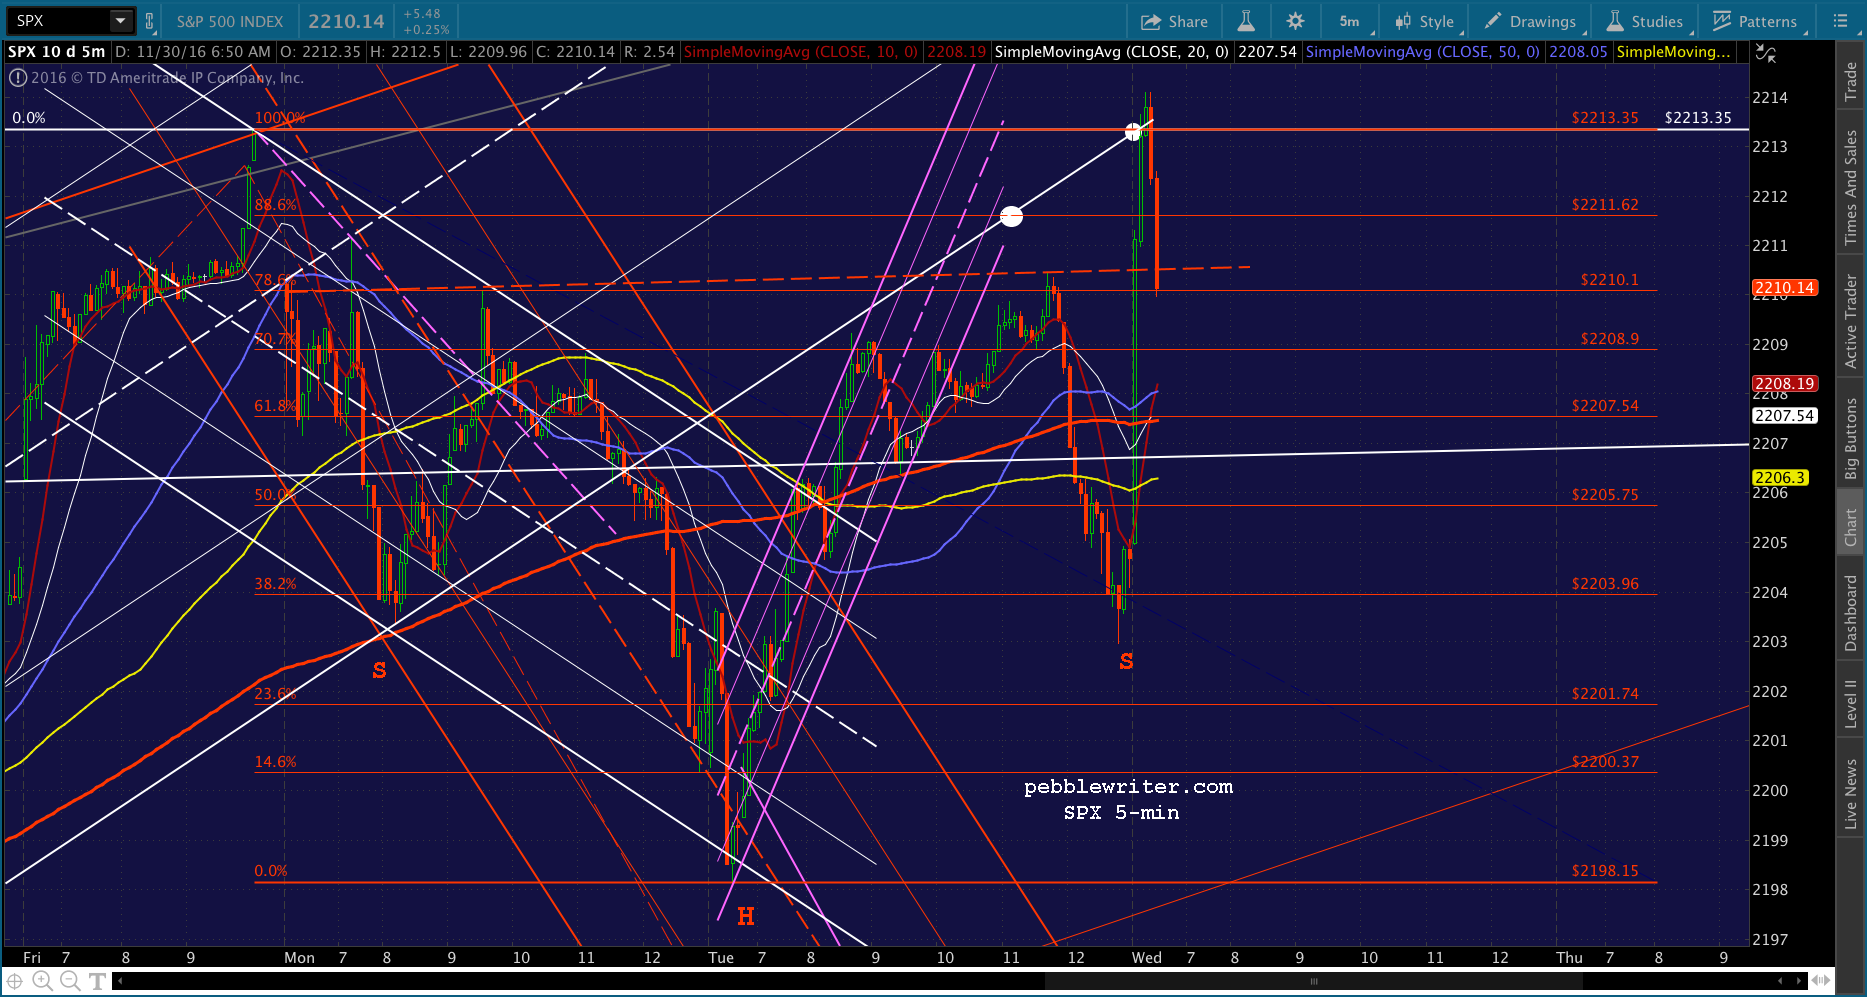
UPDATE: 10:05 AM
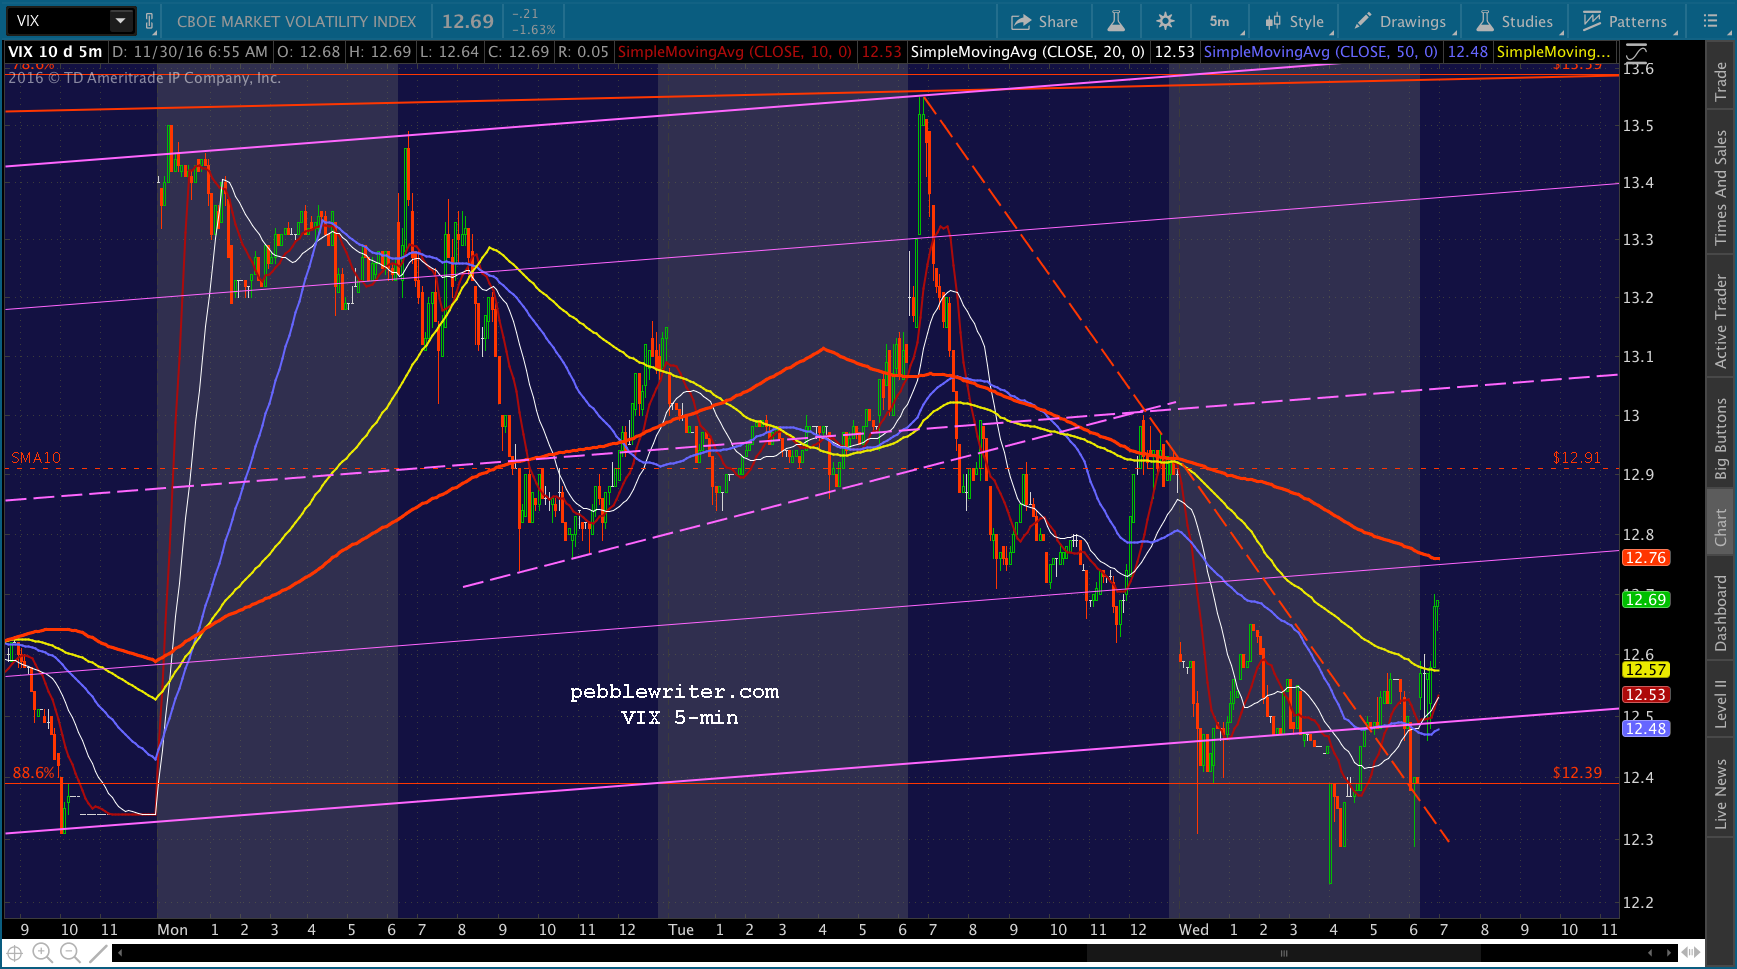
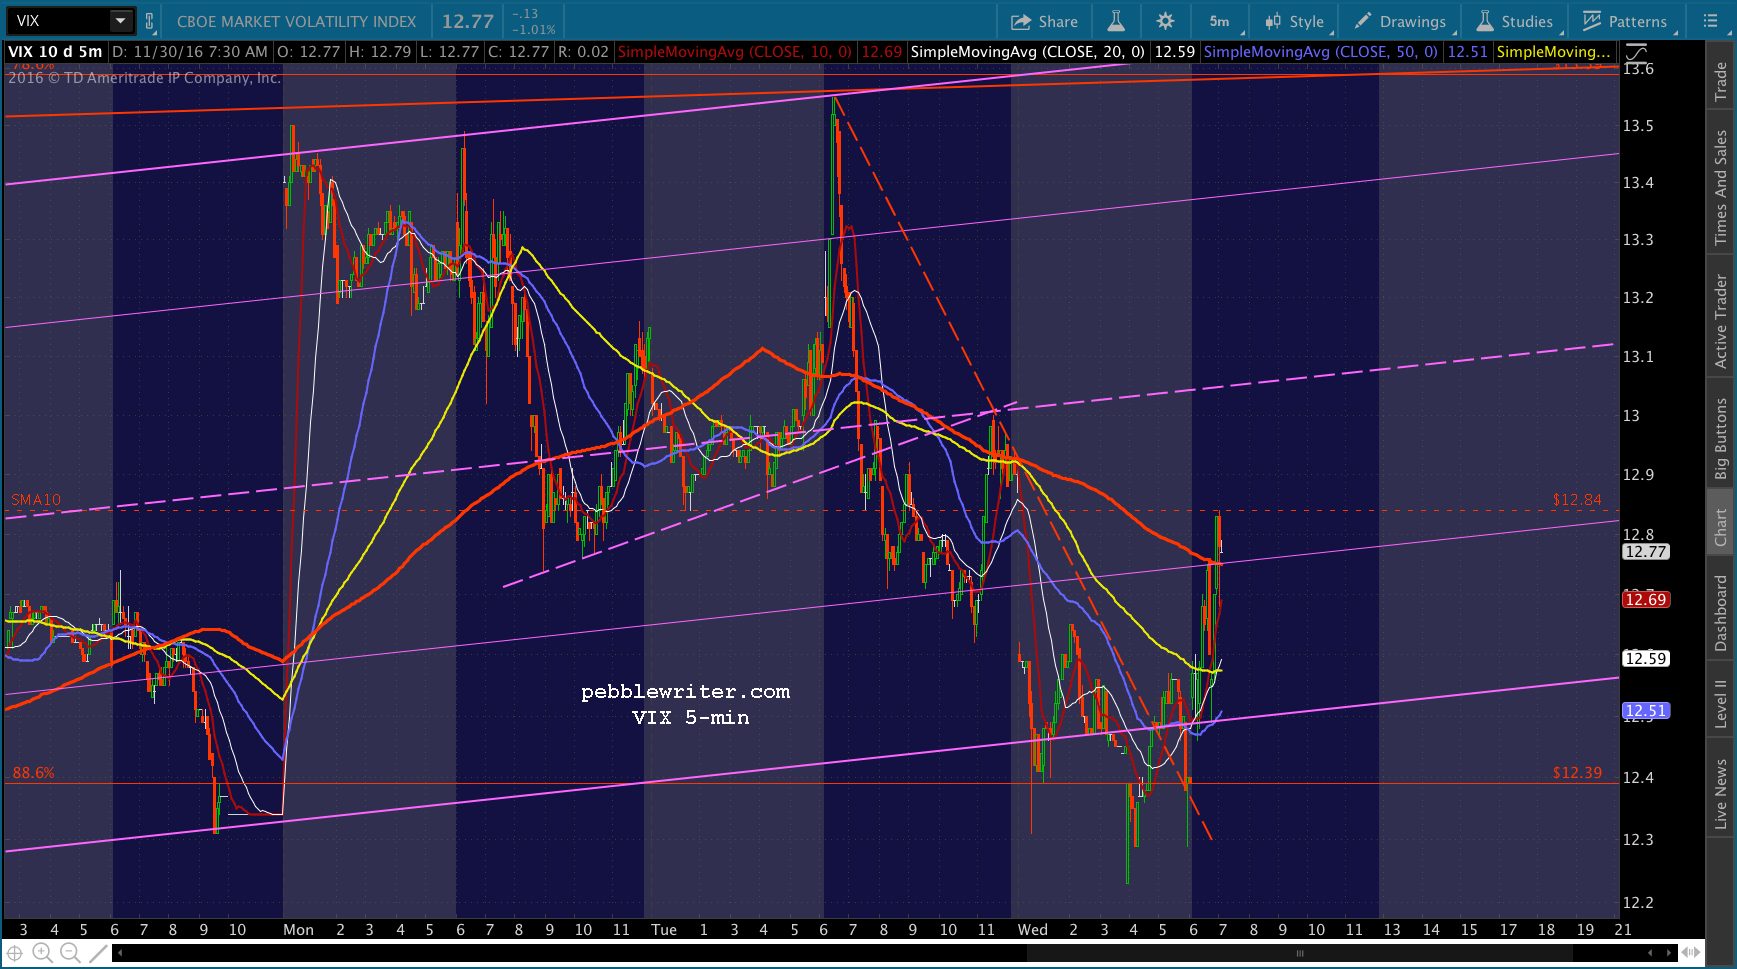
Another opportunity for a bounce, as VIX just reached its SMA5 200. I’d cover here at 2208.92 and re-short if it can move back through. While it’s bearish that SPX is back below the red neckline and CL is not advancing whatsoever, VIX appears to be waking up — and, we saw how great an impact it could have yesterday.
Bottom line, there isn’t enough natural buying pressure to keep stocks on the rise. So, out comes the bag of tricks.

UPDATE: 10:16 AM
Got it up above the neckline and SMA5 10 for a few, but it’s not holding. Back to short at 2210.20. The next potential support is the SMA 5 200 at 2207.47. We’ll watch to see whether or not VIX can push through its SMA5 200 at 12.75 this time.

UPDATE: 10:26 AM
No real SPX support here, but ES is testing channel and TL support. And, VIX just reached SMA10 resistance at 12.84.

UPDATE: 10:50 AM
A chart only central bankers could love…every time a NKD trend line breaks, they buy it up to higher highs and re-gain the TL.
As we’ve discussed many times before, this move in NKD is utter rubbish. It’s driven by USDJPY, which is rallying despite a drop in DX. And, in what universe does it make sense for Japanese stocks to rally when the cost of oil is spiking and their currency is plunging?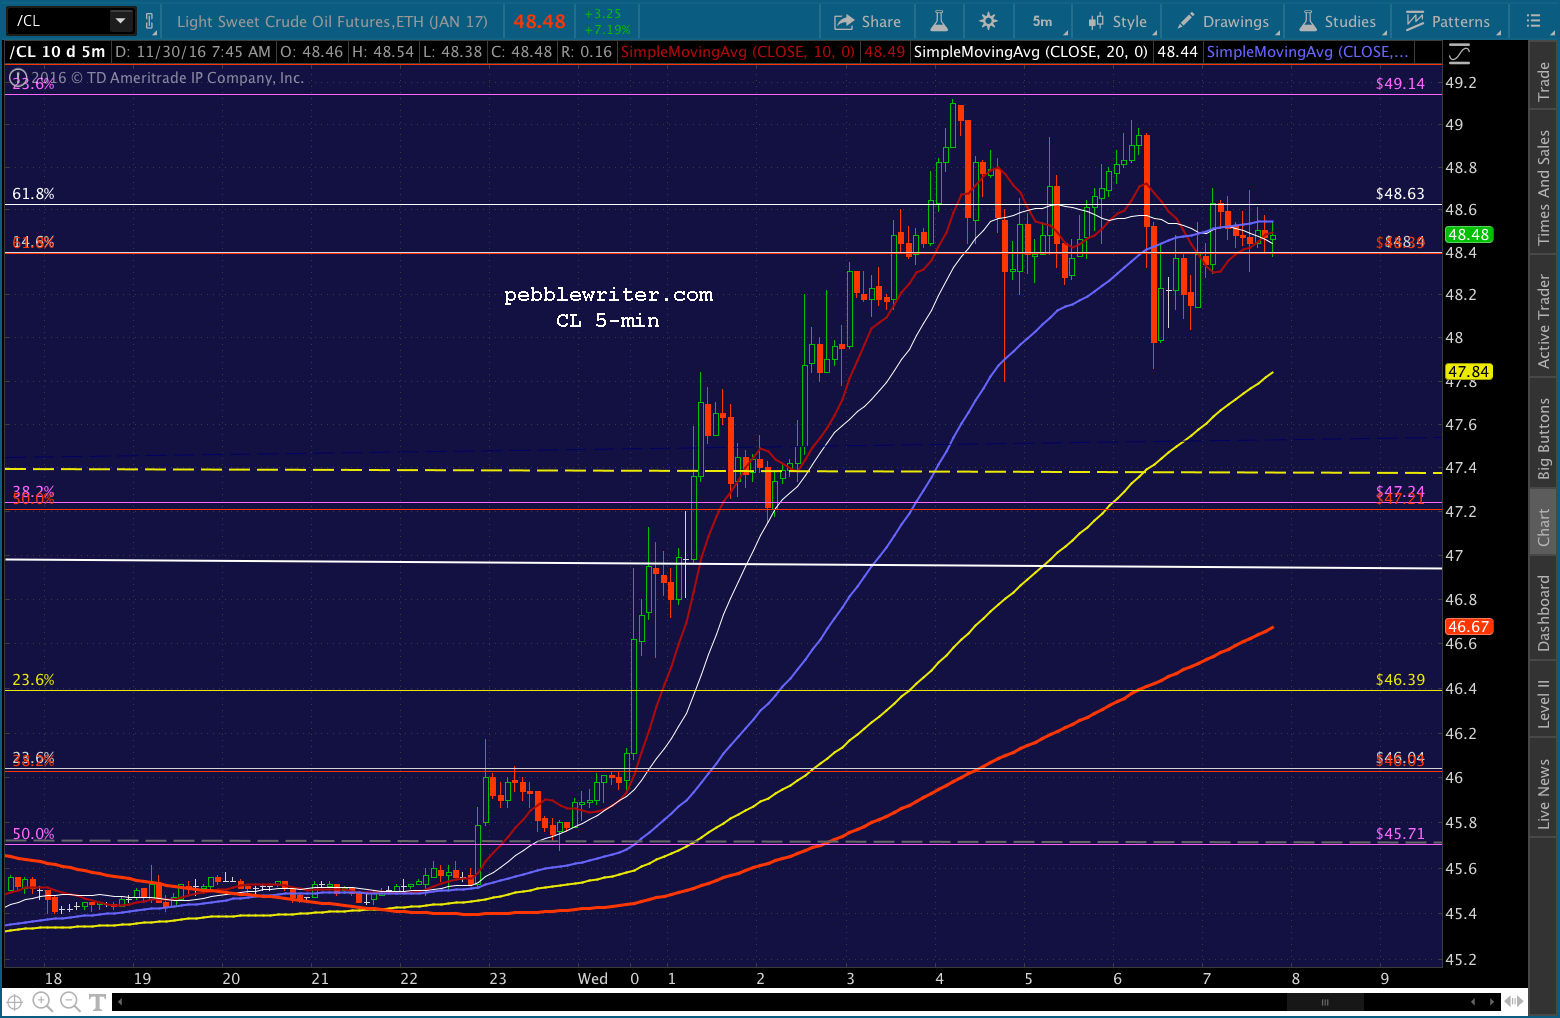
FWIW, CL is being actively propped up, just like yesterday. EIA data just came out, and it wasn’t pretty.
Traders are puking all over the OPEC deal, which essentially amounts to reallocating Indonesia’s allocation (Indonesia was just kicked out of OPEC for not agreeing to a cut, but obviously won’t stop pumping oil) and a nominal reduction by Saudi Arabia (and, maybe Russia) but exemptions for nearly everyone else. In short – don’t expect this to impact the inventory glut one iota.
While I was writing that, SPX’s SMA5 10 finally “caught down” to the index. It’s obviously not as bullish as SPX reaching and surpassing the SMA5 10. But, the algos often don’t care how SPX gets on board as long as it gets on board MA support. Since CL is still drooping, any further equity gains will fall to VIX and USDJPY, which just made a new high.


UPDATE: 11:22 AM
Neckline backtest, again. Cover shorts if it pops through.
It’s still being driven primarily by USDJPY… …though, CL is finally helping out a little.
UPDATE: 12:10 PM
Do or die time for SPX. I’d cover here at the purple TL, but short again on any drop through 2205. Note that it’s only marginally lower than the last dip. But, because SPX chopped sideways for a while, it now constitutes TL support. ES has broken TL support, but still has channel support. I expect it to drop through, so this exit is a precaution and hopefully only temporary. I have to jump on a conference call, should be back in 30 minutes or so.

UPDATE: 2:02 PM
Short again at 2206.77 on the dip through the purple TL and the SMA5 200. Remember, our downside targets are the SMA10 at 2195.19, the purple midline around 2184-2187, the red midline around 2176-2182, the SMA100 at 2161.53, and finally the .618 at 2133.57. I give ranges for the midlines, of course, as the value depends on when they’re tagged. My target date for this decline is still Monday, Dec 4.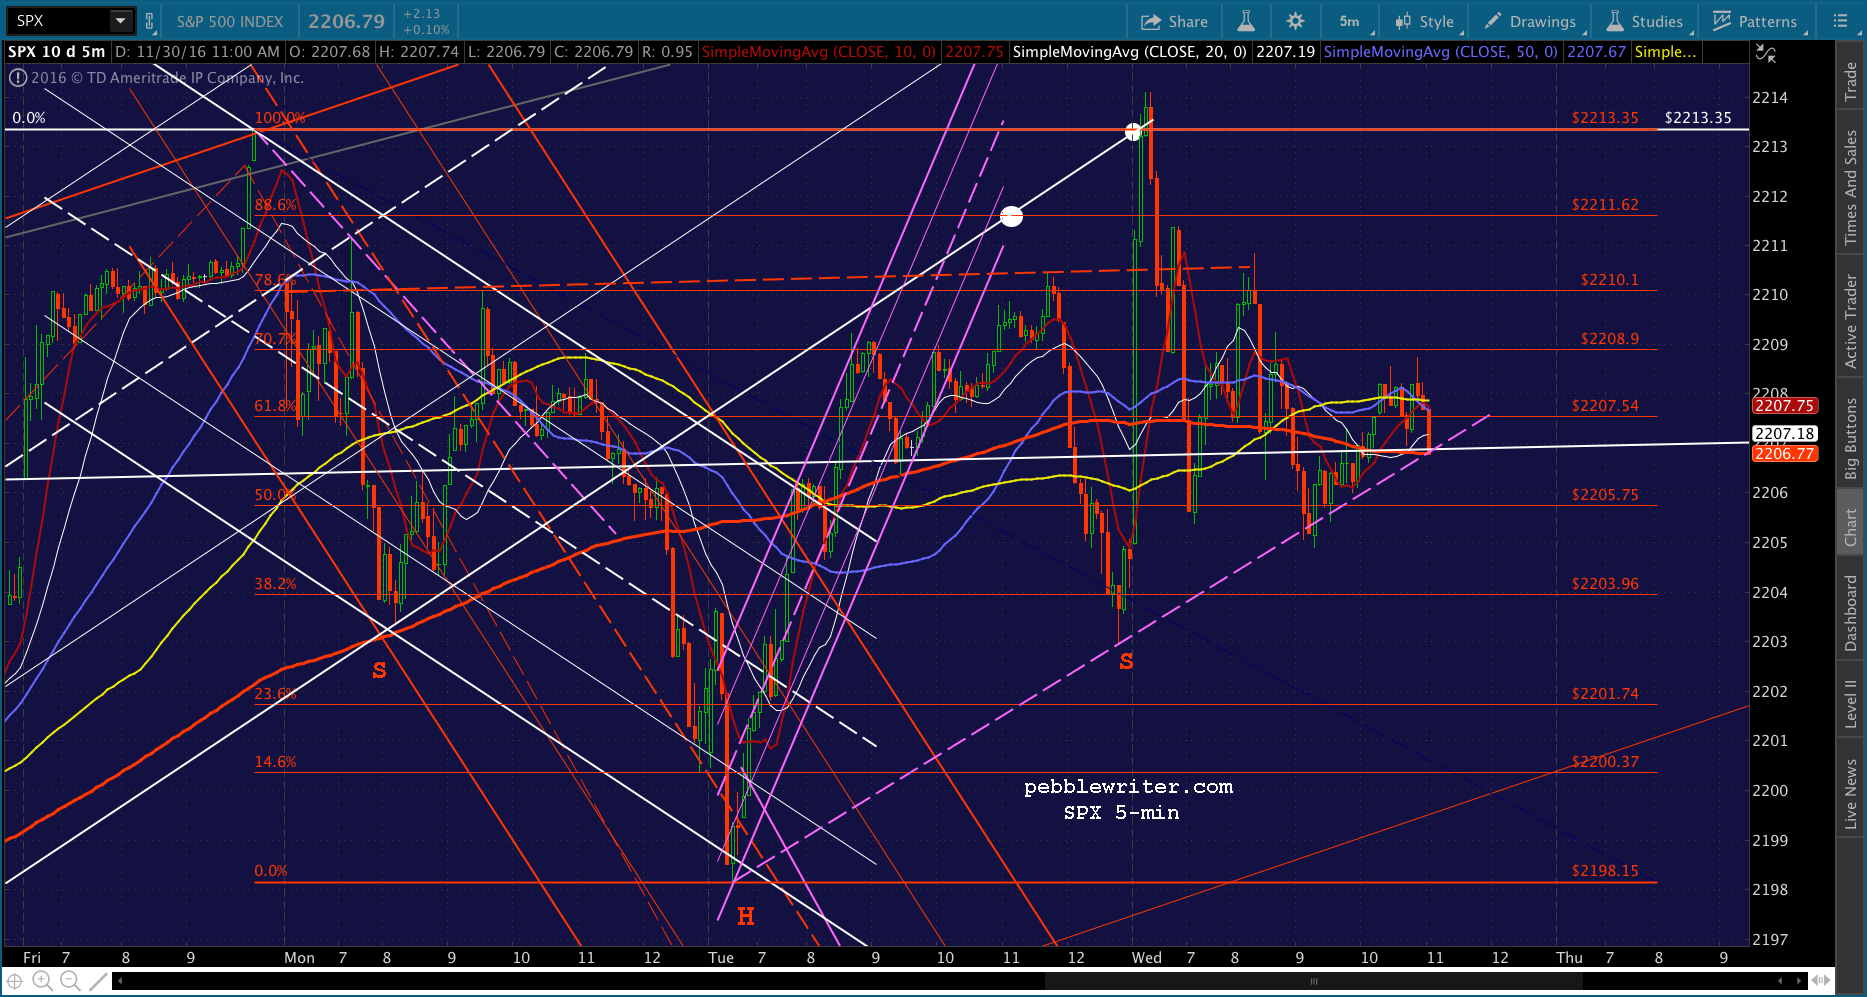
UPDATE: 3:15 PM
SPX is testing 2200 again, and VIX suddenly reversed. This would be a logical place for them to take another stand, being that it’s very close to the .146 Fib. Traders might want to consider covering here; though, I still expect lower prices as detailed above over the next few sessions.

UPDATE: 3:40 PM
Heading into the close with SPX nearly flat on the day — even as CL is up over 8%. I suppose the takeaway, here, is that investors are not impressed with the OPEC deal. If an 8% rally can’t drive stocks higher, then there’s a lot of selling pressure that’s ready to be unleashed. I’d be comfortable staying short overnight. At the very least, we should see a SMA10 test somewhere around 2197.


Comments
5 responses to “The Two Critical Charts”
FYI I believe Monday is December 5th this year, not 4th (Just a note)
Could today be “day 100” on the analog (or close)? Which would suggest a drop of at least 60 spx points from here?
Sure. Being off by only one day would be a win for the analog at this stage of the game. Keep in mind, however, that the size of the drop is up in the air. See the 2:02 update for other downside targets.
Cheap Yen and expensive oil… I guess Japan really is the sucker of the world. How much longer are they willing to “play along” to the destruction of their people’s wealth and hard work?
You nailed it. Given that they’ve “invested” so much of their wealth (BoJ and Gov’t Pension) into stocks, they’re caught in an equity trap. They have little choice but to play it out and hope for the best. For more on this, see: https://pebblewriter.com/japans-equity-trap/