

If you’re a chartist, there are two distinct markets to deal with. Both are predictable, but only one is enjoyable. Friday, when SPX nailed our 2090 downside target, closely following the path we laid hours earlier, was fun.
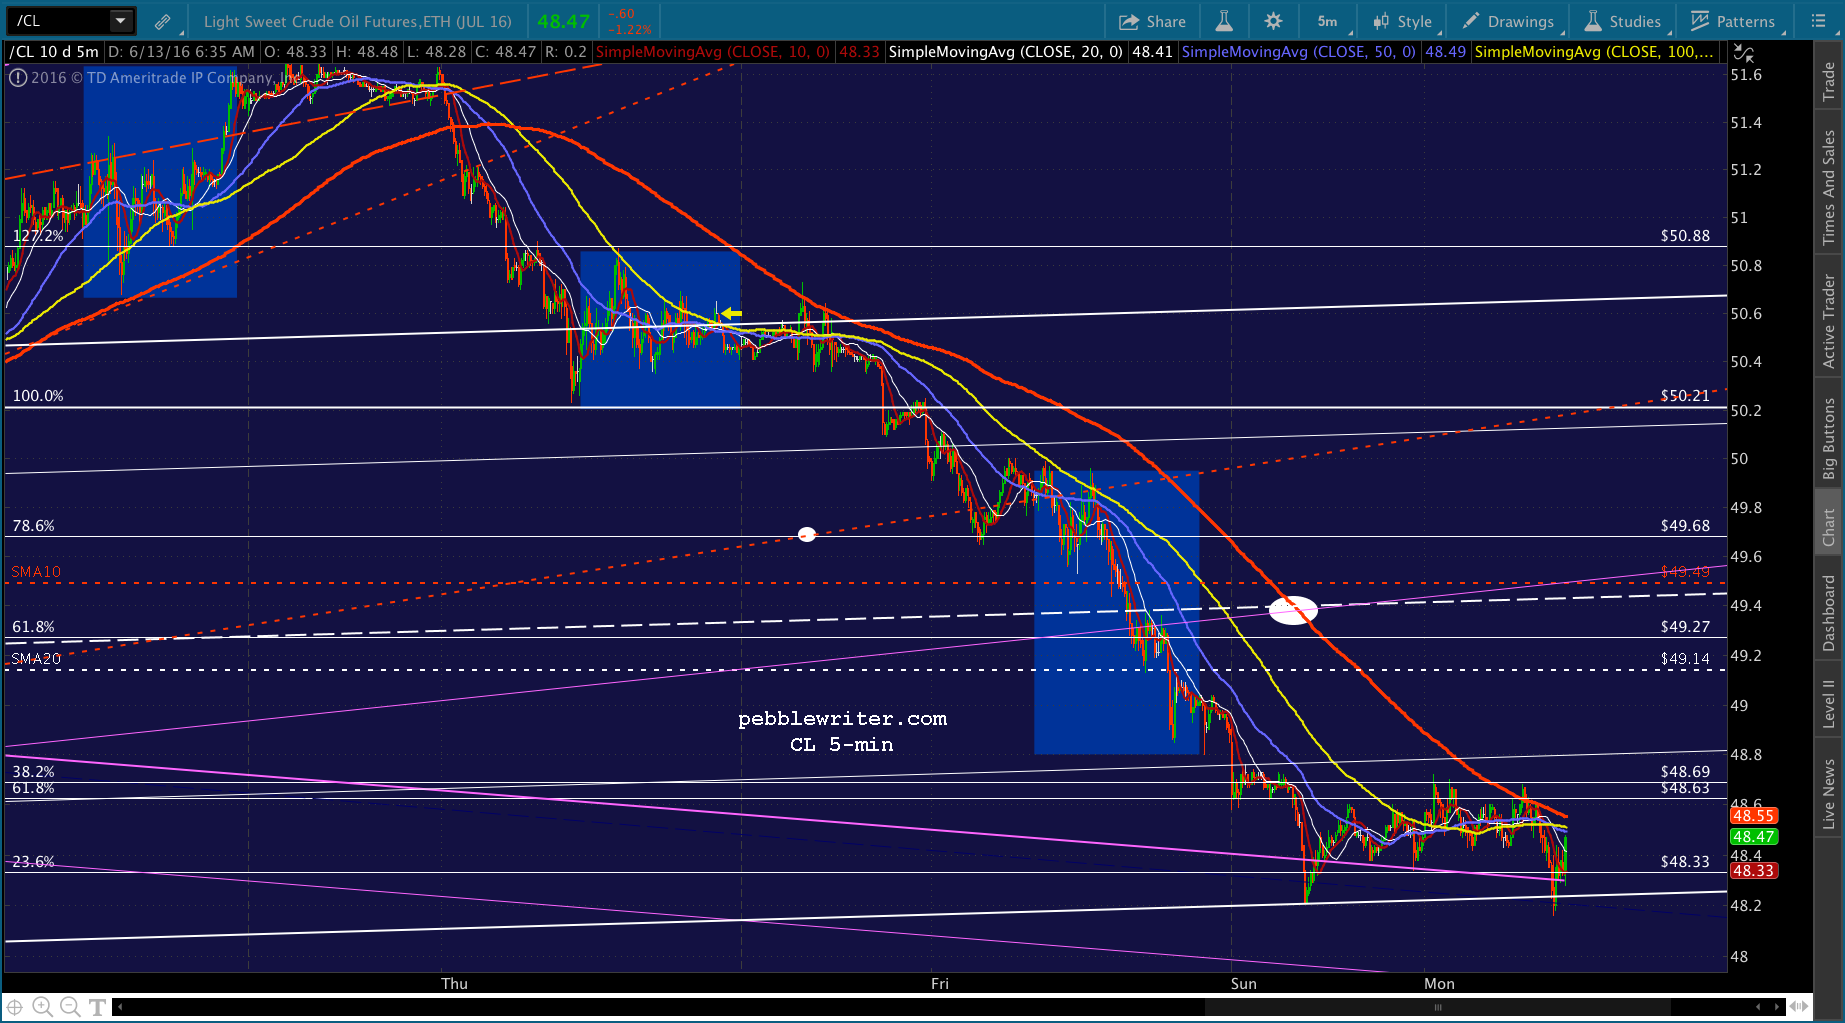
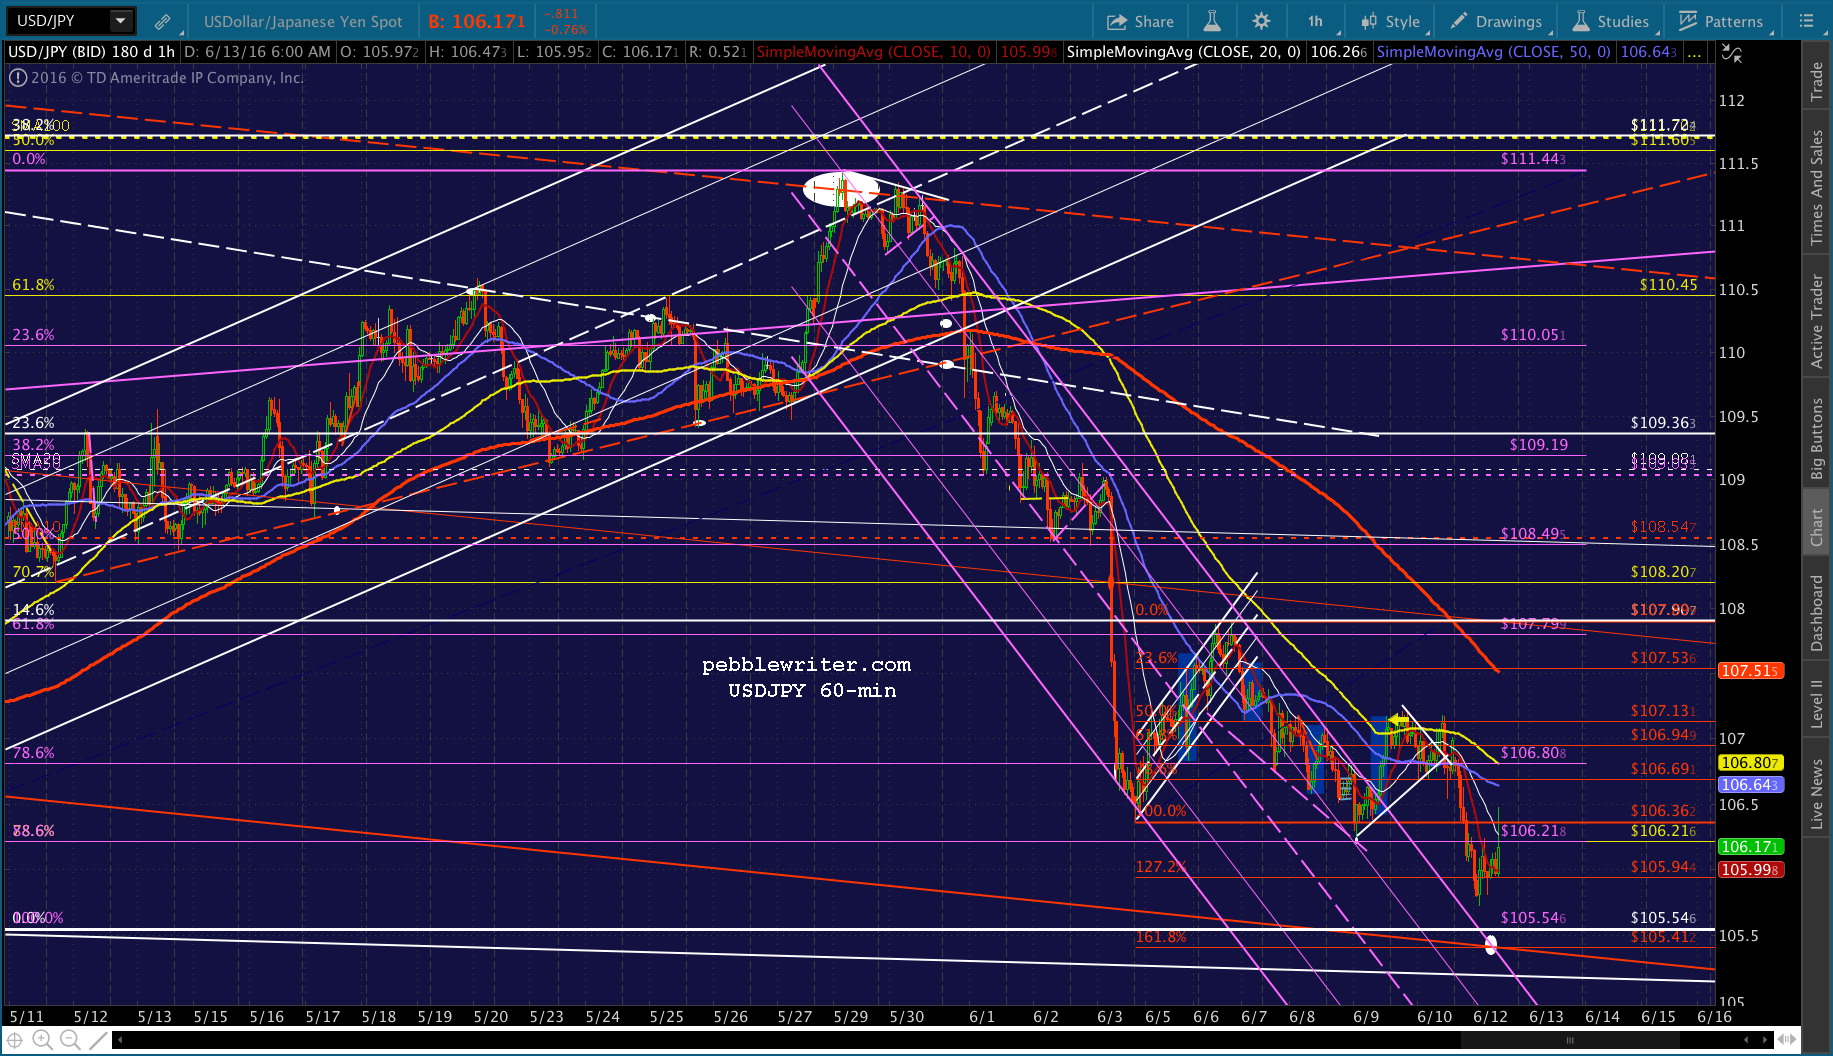
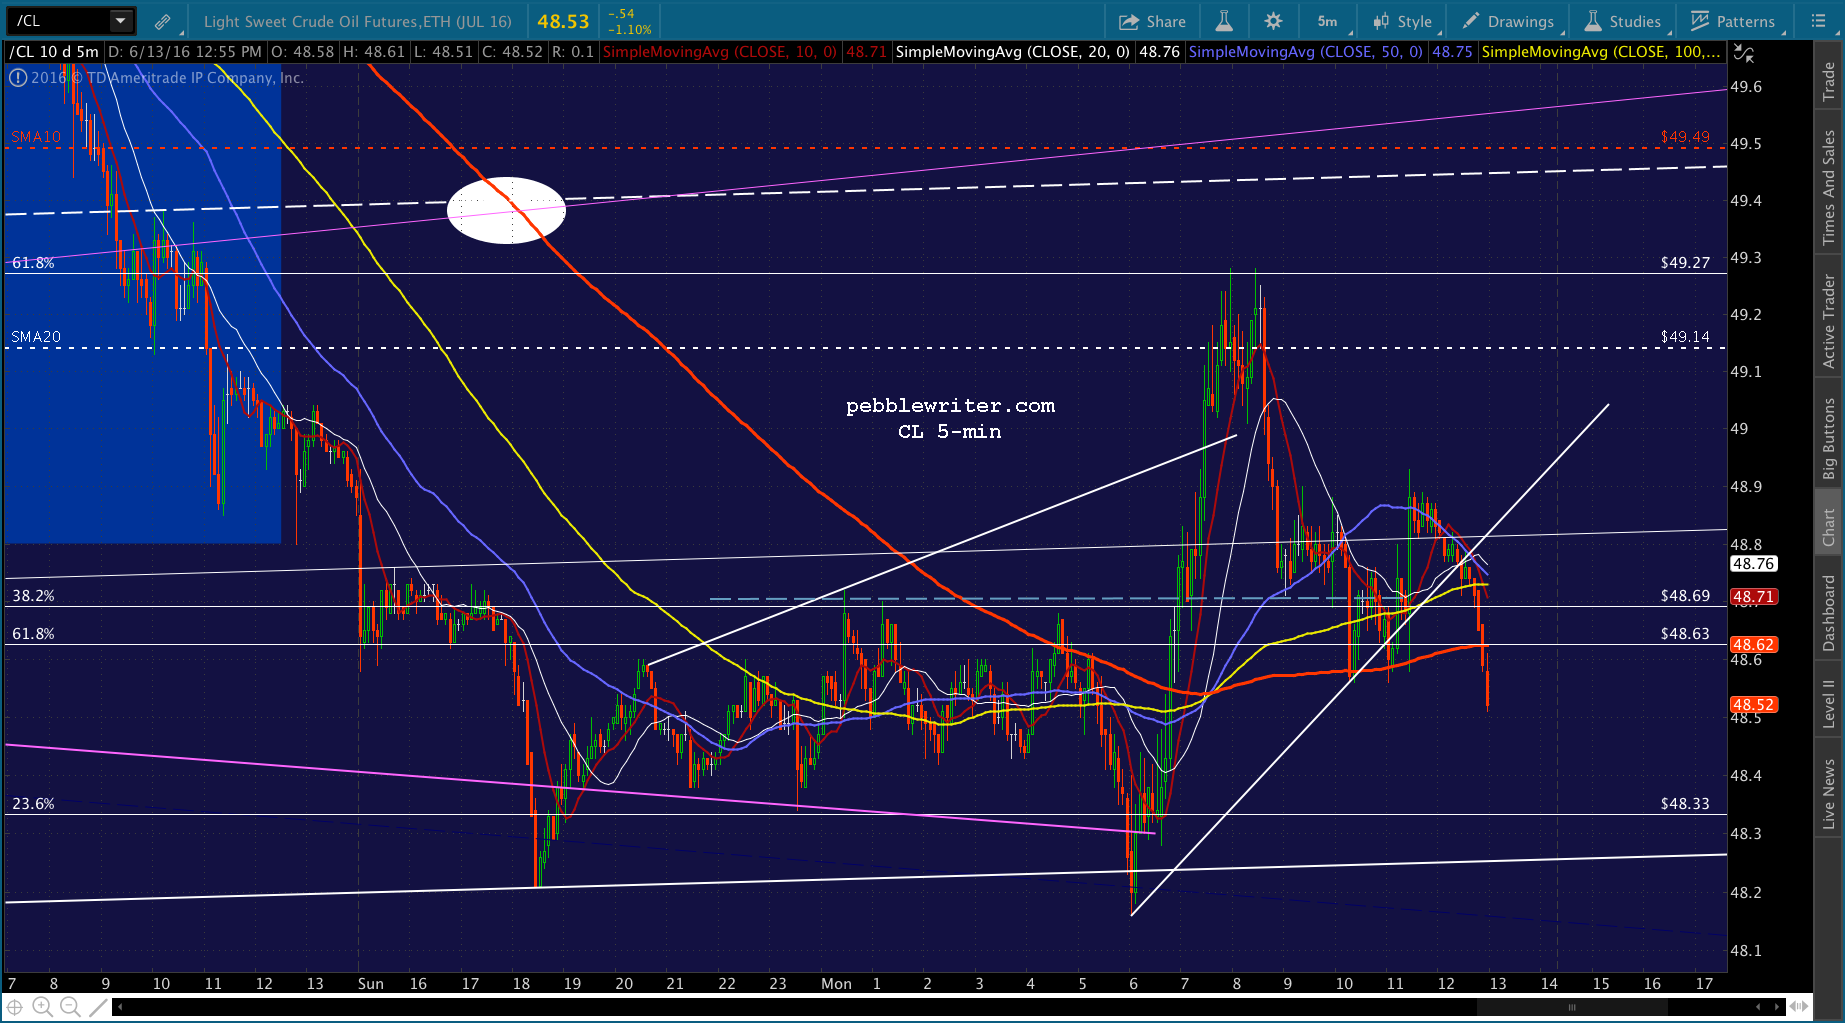
Then…there’s the market’s evil twin. It’s driven by algorithms that respond to manipulation in CL and USDJPY prices — a clear case of the tail wagging the dog. Consider the night of June 5, when CL futures, after having struggled to push past a key Fibonacci level for several weeks, departed from a falling channel to push up and out of a rising channel. Never mind that CL is back below the rising white channel top and is even contemplating reentering the falling purple channel. Never mind that it burned bears by driving ES 22 points higher over the next three sessions. And, never mind that it’s back below the white .618 Fib level at 48.63.
The point is, it established new highs for ES and SPX — meaning that all those nifty bearish harmonic patterns that reinforced the bearish chart patterns got busted. It’s a common occurrence, and one that makes charting a lot tougher than it was a few years ago.
continued for members…
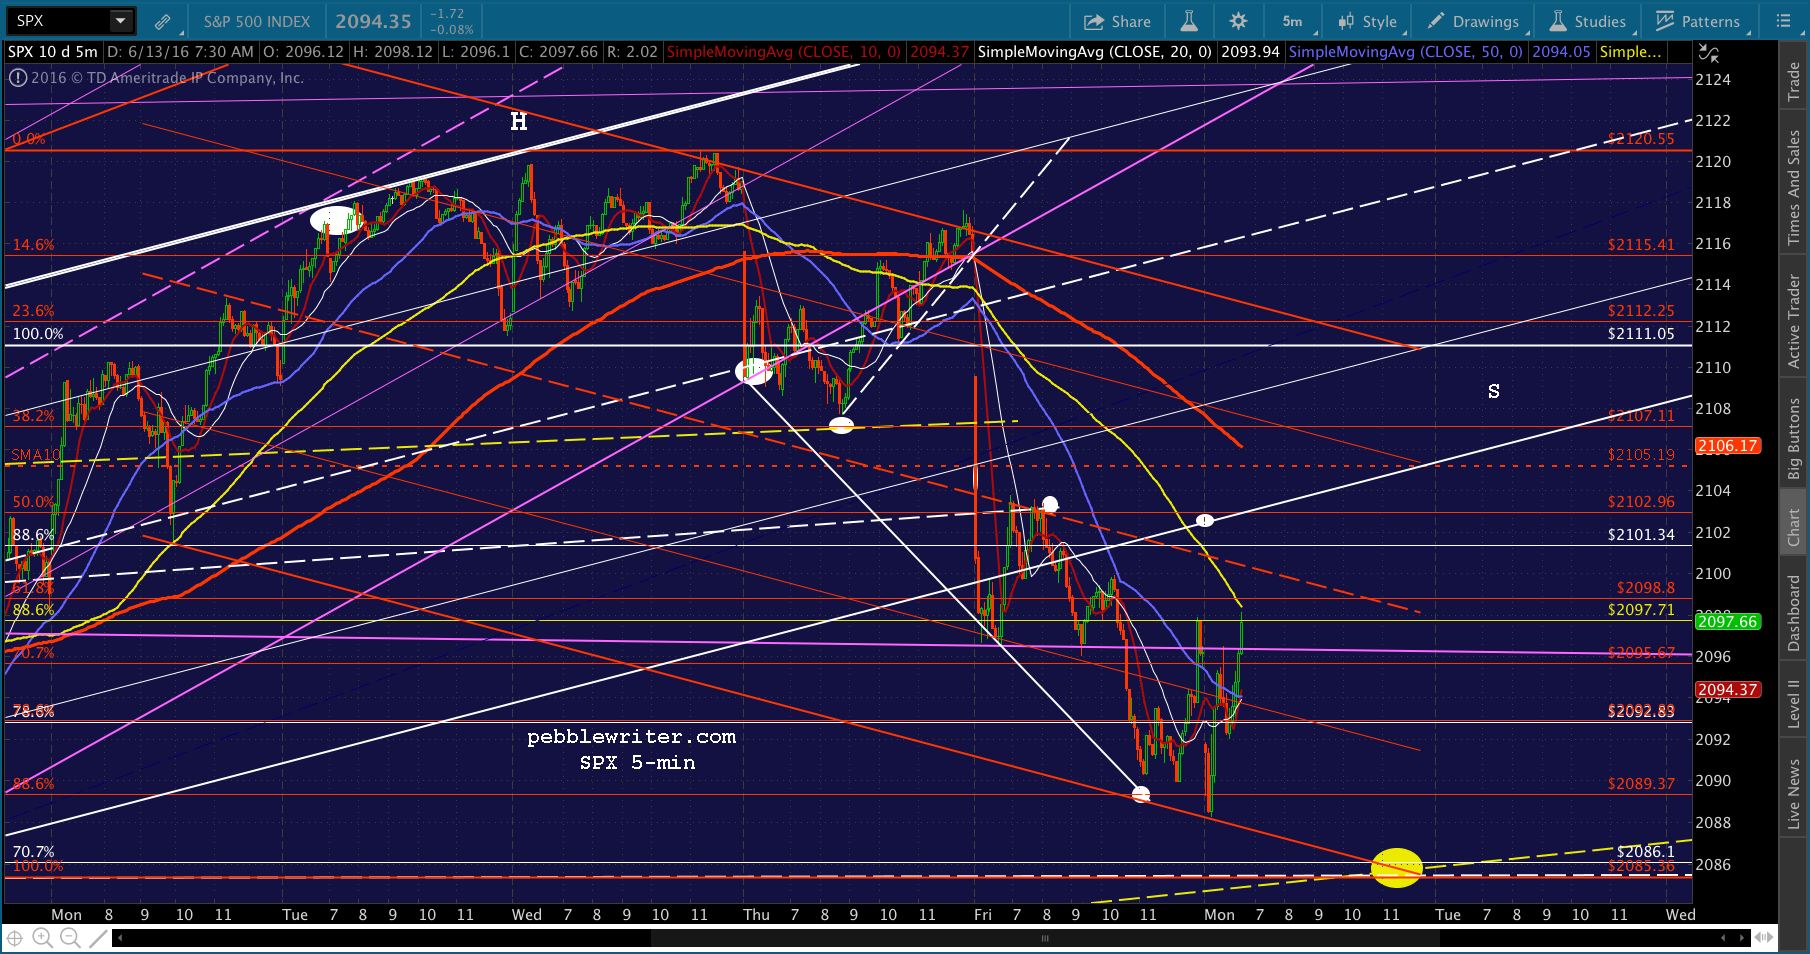
The picture this morning is a little tricky. ES has reached the white channel bottom, even dipping below the yellow neckline to do so. SPX should reach the 2085 level — a tag of the yellow neckline (targeting 2049) and the new white neckline I charted last week. Of course, it would mean ES has to at least temporarily dip below the white channel bottom to reach 2072-2073. There are plenty of targets there, with the SMA50 at 2072.17 and the purple .500 Fib at 2070.88.
 USDJPY is due to reach 105.41, but could spend most of the day recovering from the overnight plunge — supporting a rebound or at least delaying or moderating stocks’ drop.
  Note the red channel bottom running through the white dot. It’s not the lowest possible target, just the closest that might make sense if SPX, as I suspect it will, pushes below 2089. It’s easier to understand its significance on the daily chart.
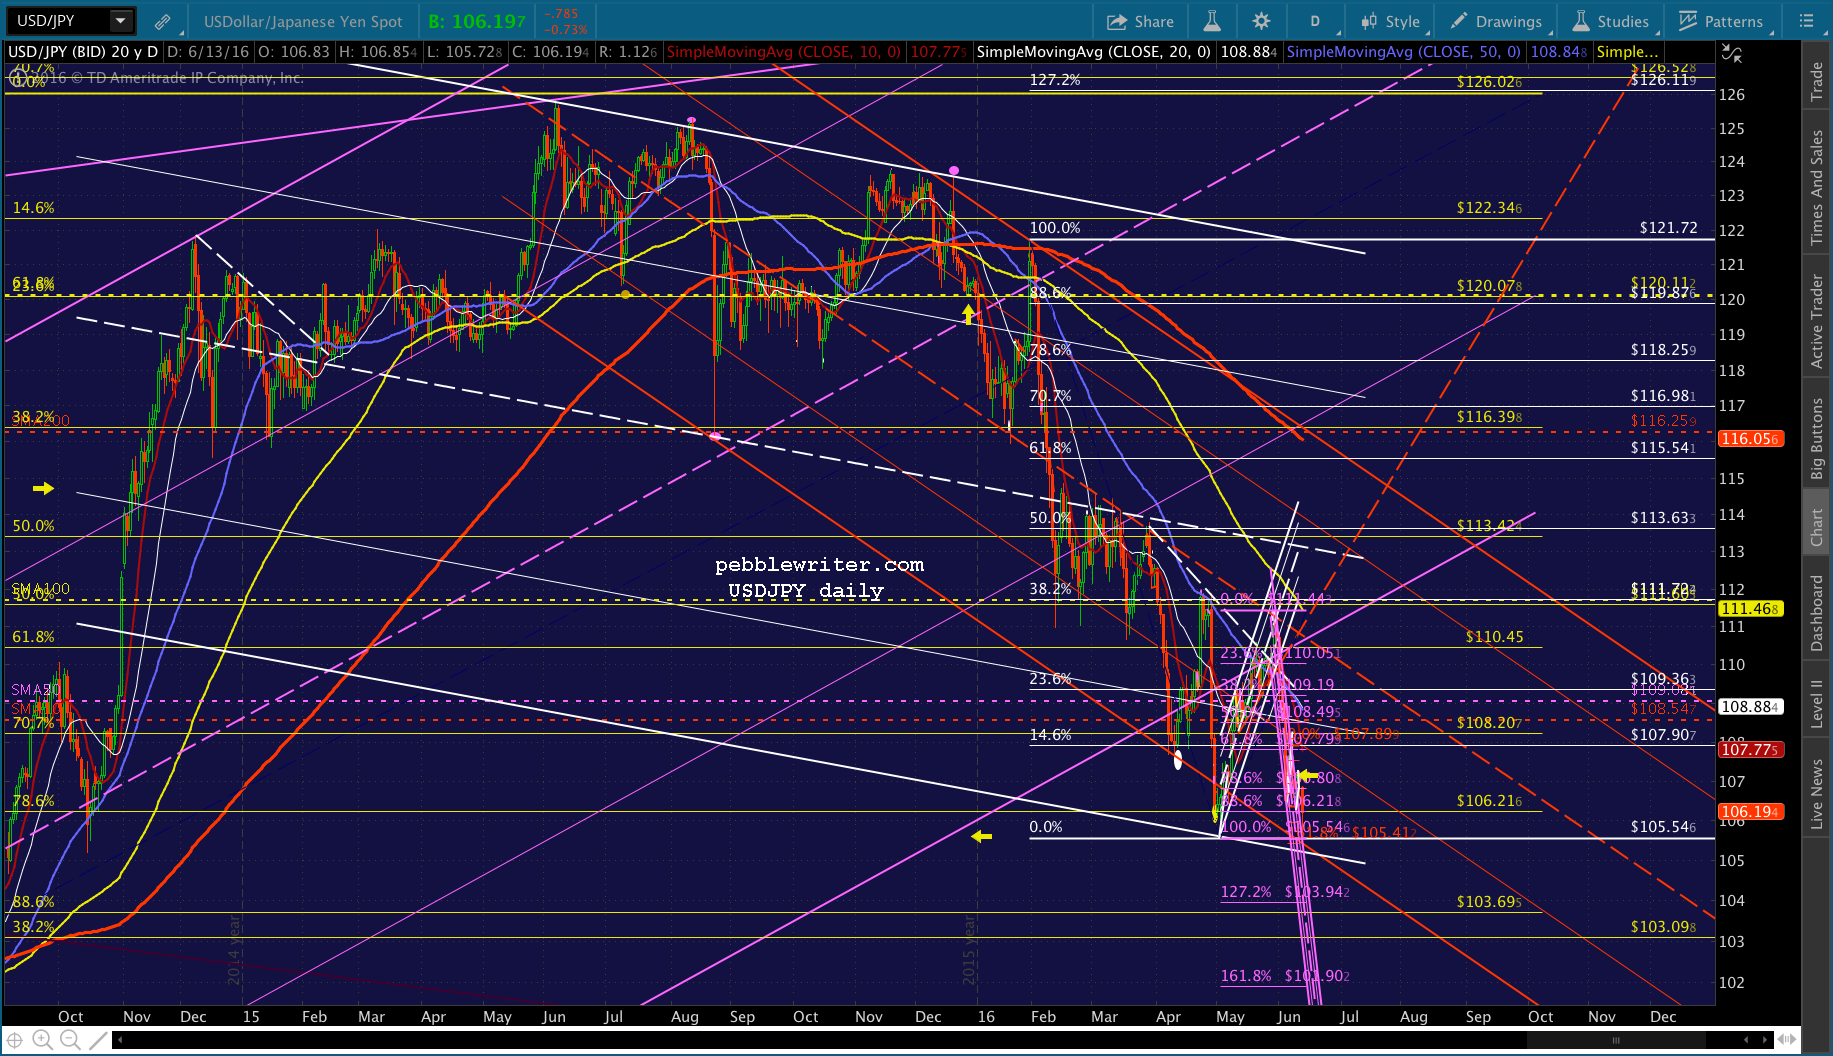 The net net is that SPX should test the red .886 in the opening salvo. If USDJPY and CL don’t bounce like they usually do, then SPX should get a shot at reaching 2085.36. If they do, then SPX could spend most of the day filling gaps on a bounce, and forget about the neckline tags.
UPDATE: 9:35 AM
The .886 bounce isn’t all that impressive yet, and CL is still hinting at lower. I’d stay short for now.
 UPDATE: 9:50 AM
No telling how long or how far the bounce might go. Short-term traders might wish to exit or play the bounce, while swing traders might as well ride out the gap close at 2095.51. USDJPY is replaying Friday’s moderating bounce, on an even more aggressive slope.
 While CL is staying with striking range of breaking out, but conspicuously hasn’t.
 UPDATE: 10:02 AM
SPX just closed the gap and bumped up against the purple channel top that it’s fallen back below. It should reverse here.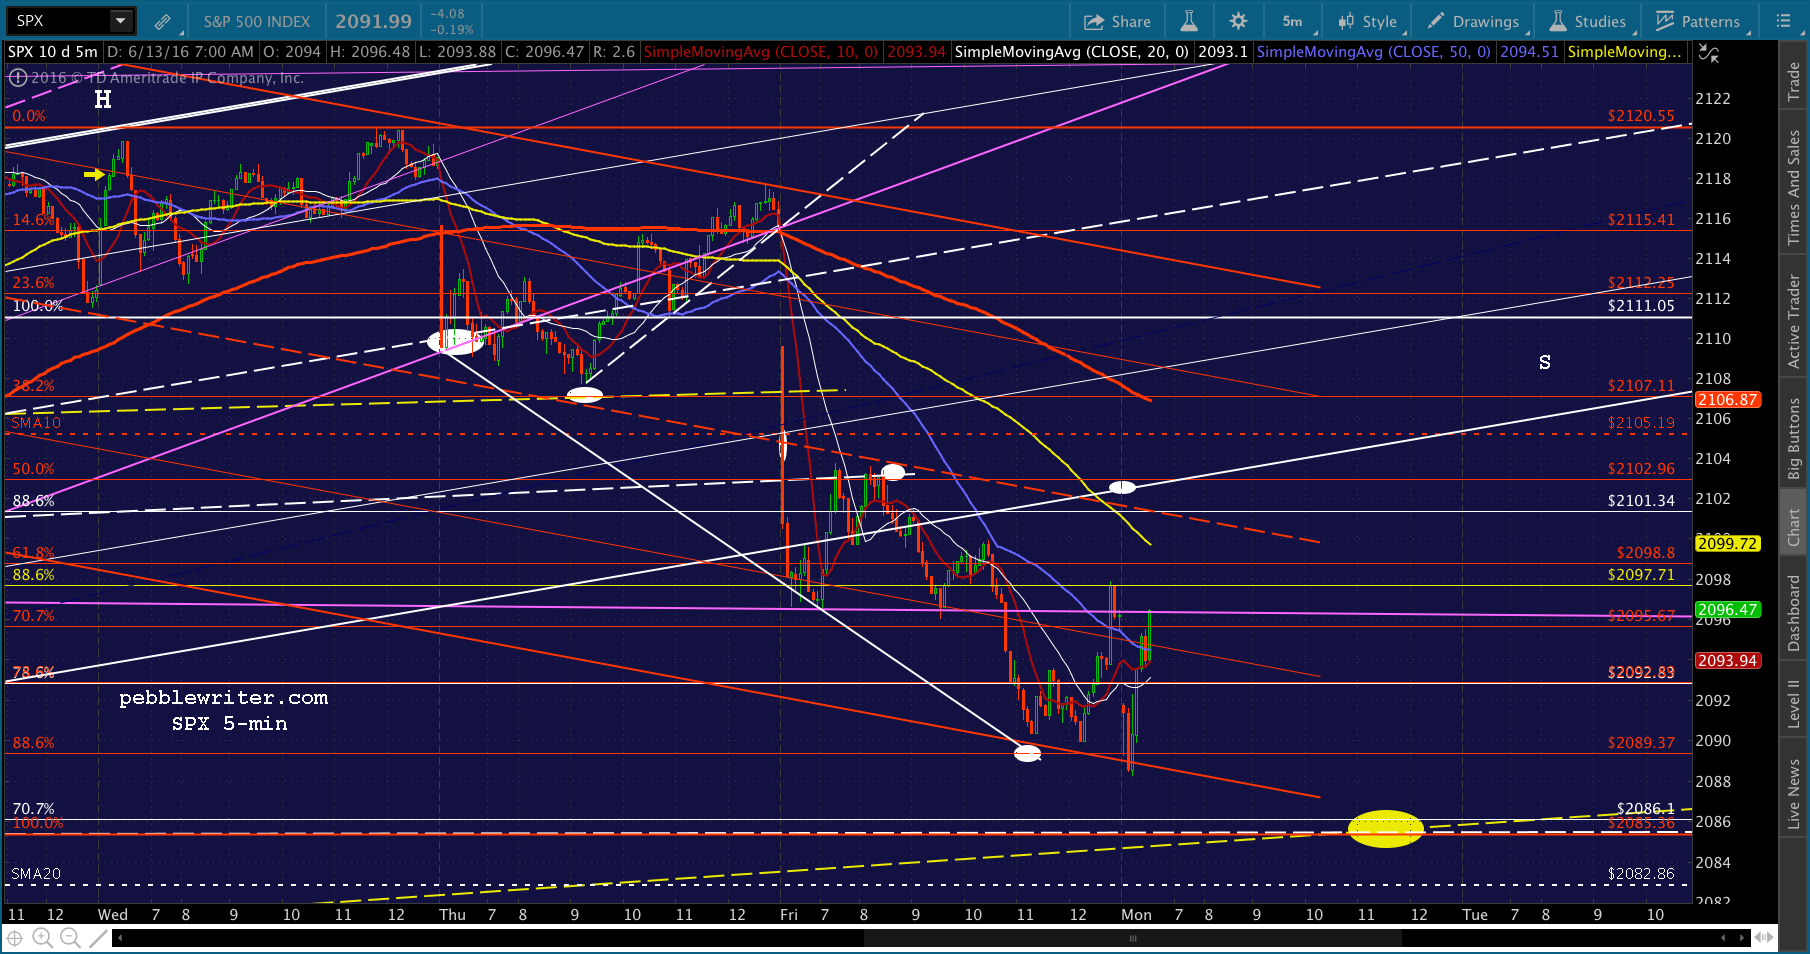 But, CL is edging higher. So, any further drop could be (at least) delayed.
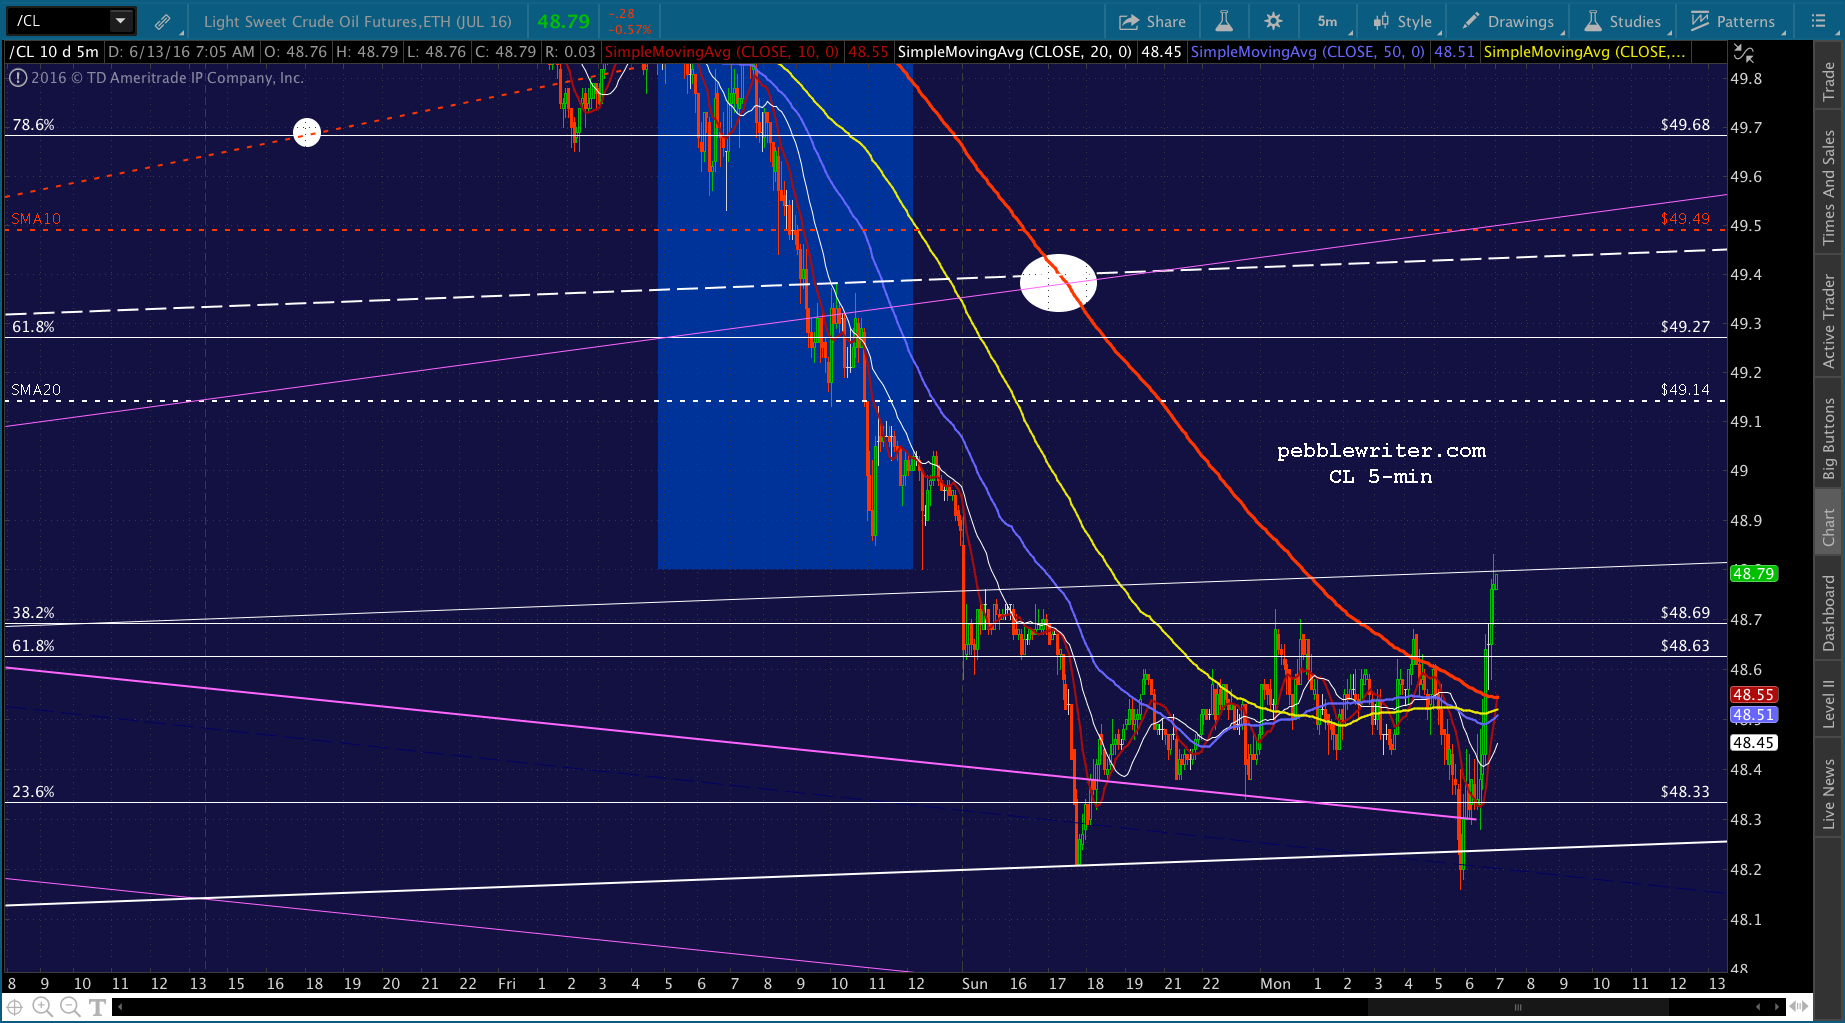 USDJPY is in position to break out, but hasn’t just yet. Both bear close watching.
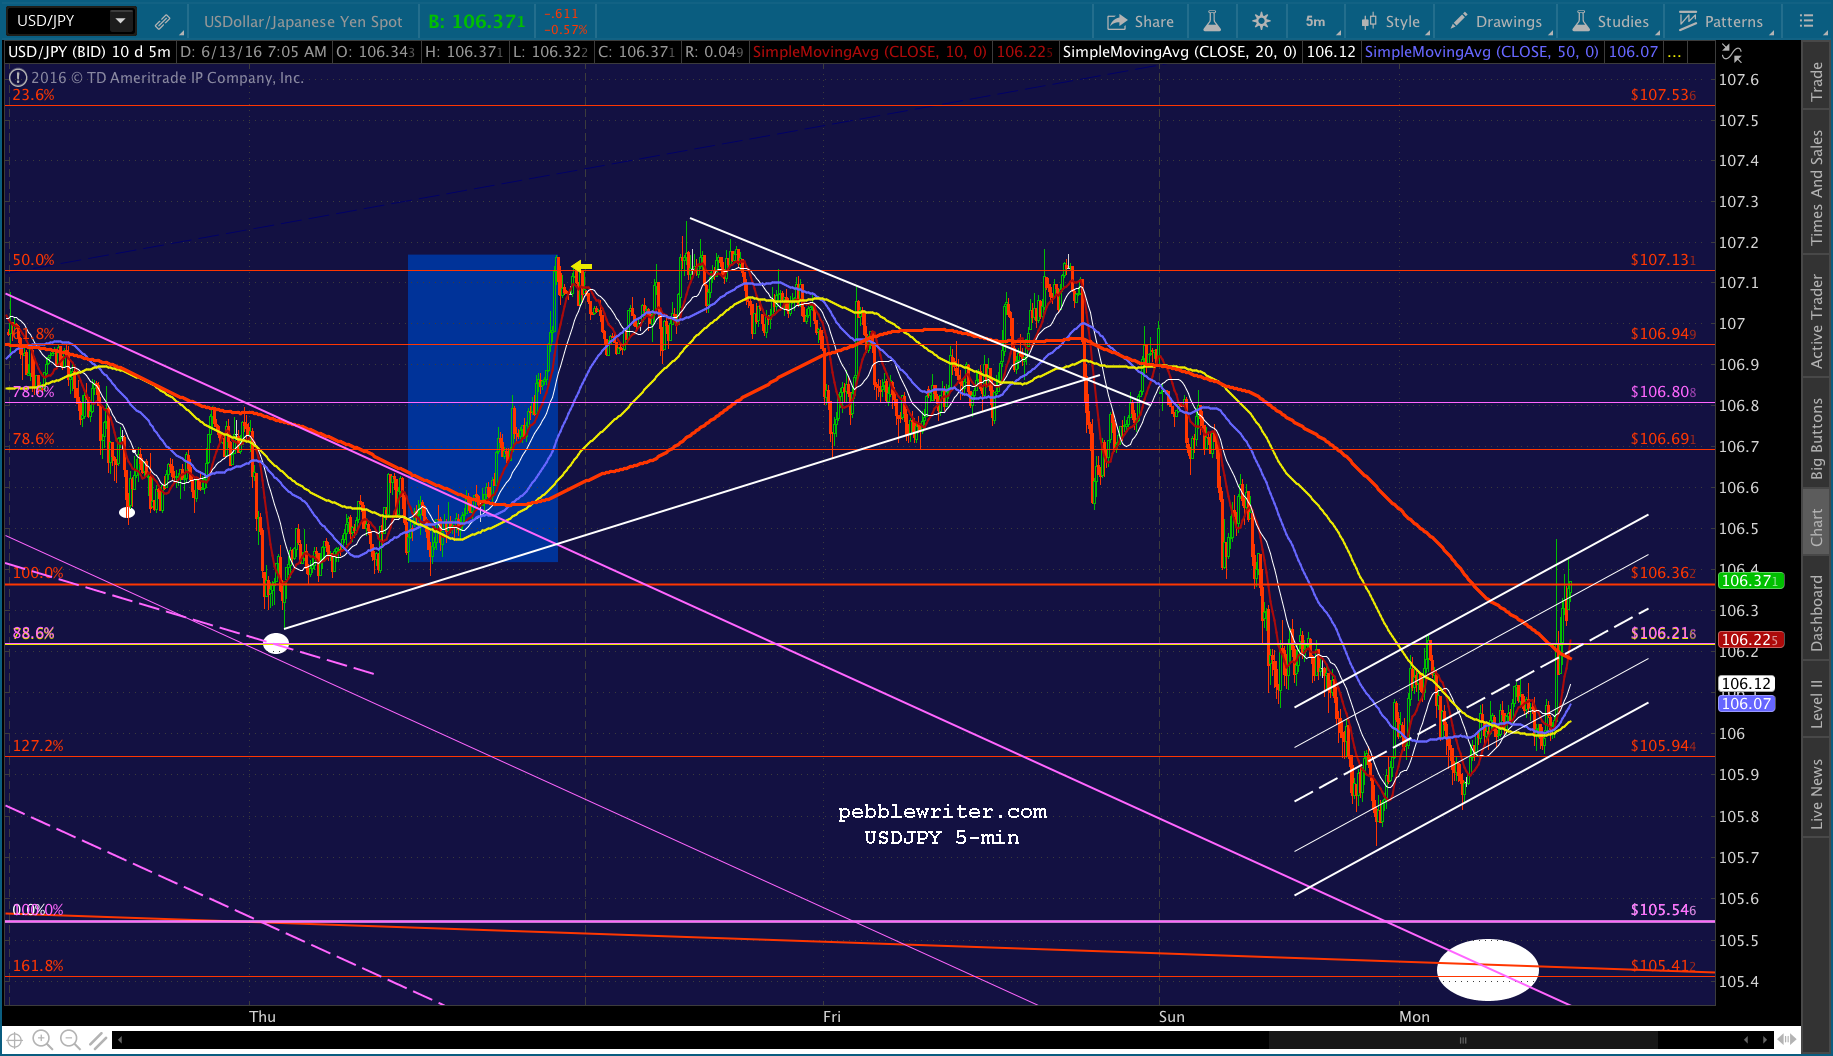 UPDATE: 10:15 AM
USDJPY is breaking out of its rising white channel, and CL just plain breaking out. Back to cash if SPX breaks above its SMA5 50 (about 2094.16.) Again, I view this as a delaying tactic rather than the end of the drop.
 UPDATE: 10:22 AM
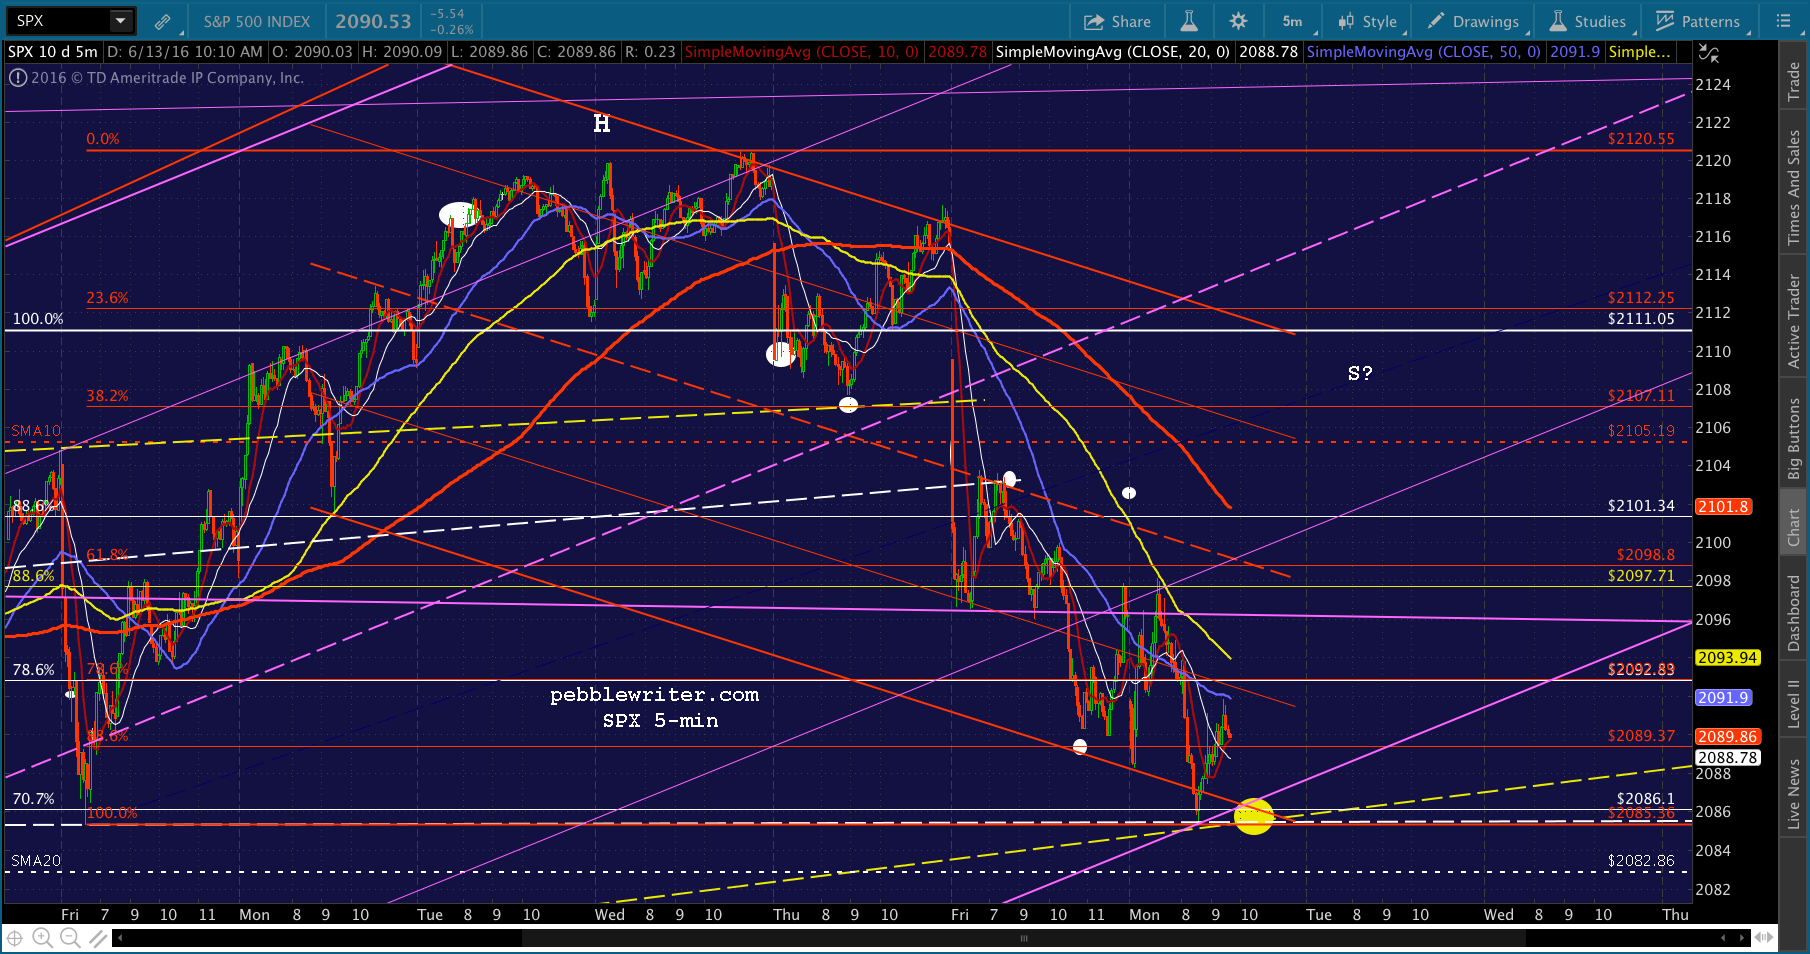
SPX is pushing up past the SMA5 50, so traders might consider reverting to cash. Swing traders, I still think we’ll reach 2085-2086.
 Here’s a daily chart showing that purple channel top (marked with the yellow arrow) from the 2015 highs. As we noted at the time, CL’s breakout on Jun 6 was responsible for SPX’s break above the channel top. If they intend to push back above it again today, then we’ll no doubt see CL spike higher pretty soon.
 UPDATE: 10:34 AM
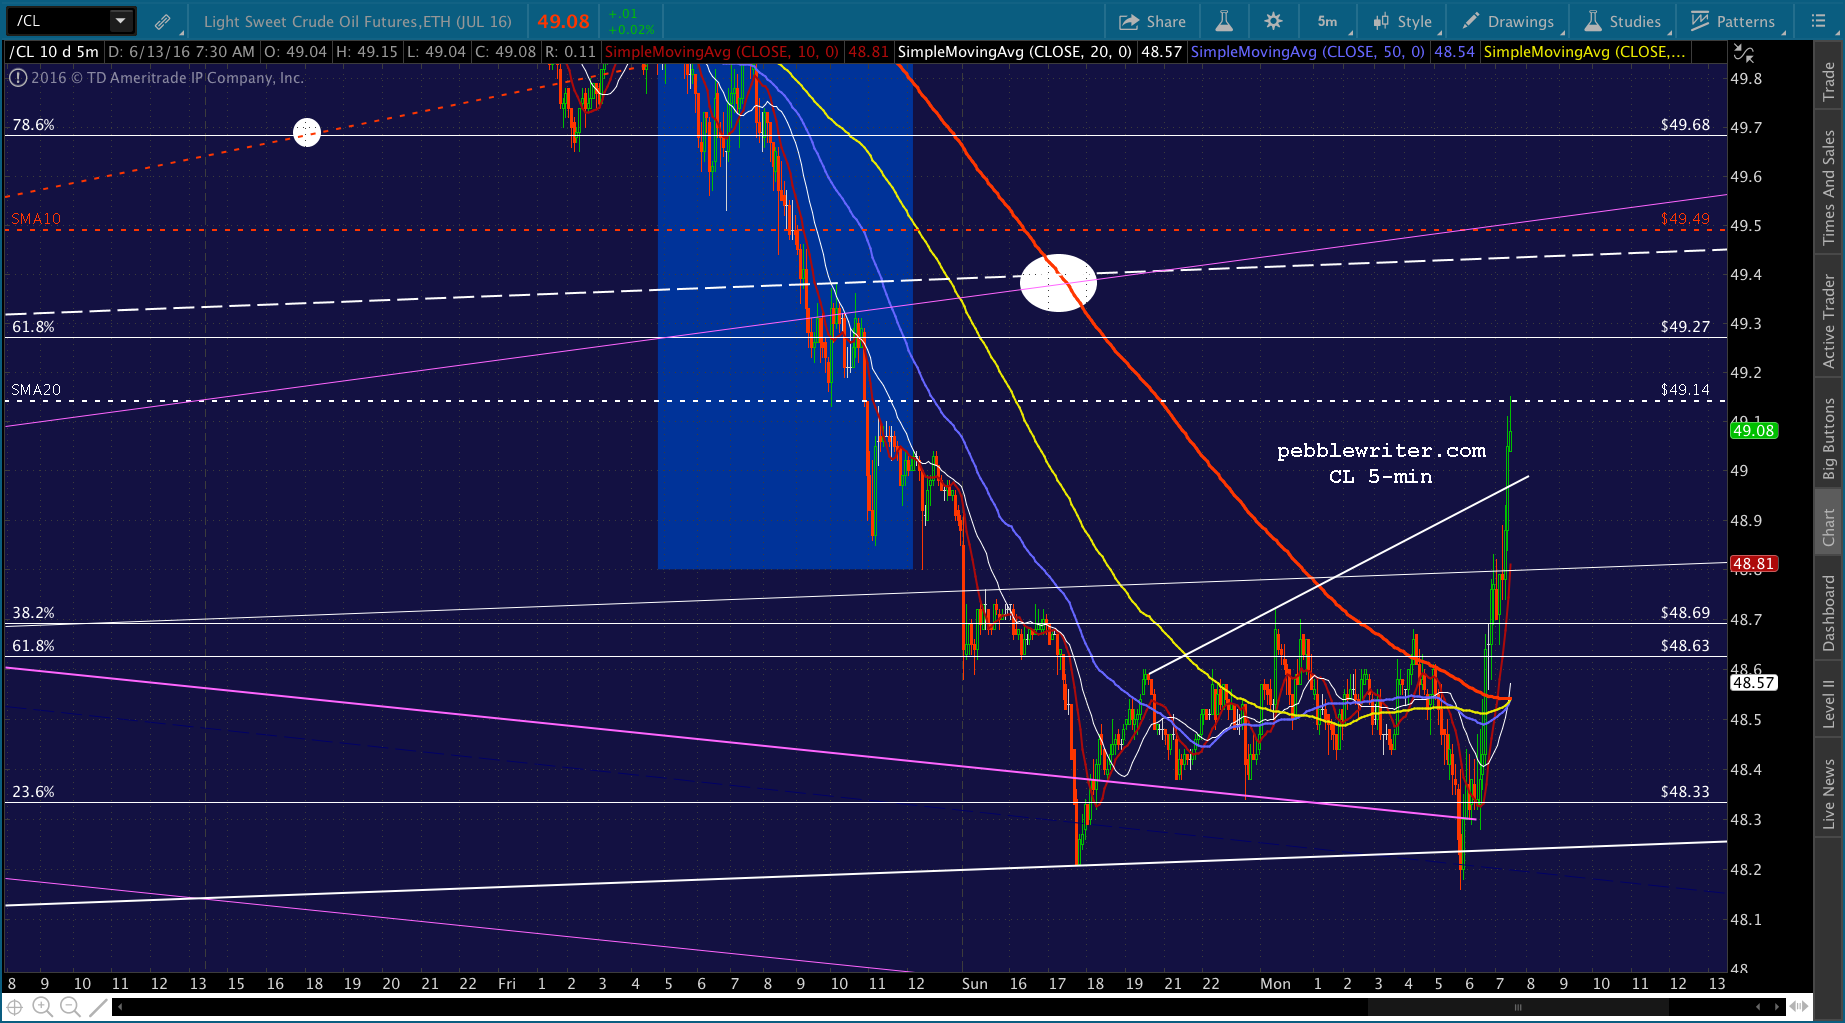
USDJPY getting in on the action, too. It looks like an effort to get SPX up to the SMA5 100 at 2098.24. Should get a downturn here unless NKD breaks out, too and CL pushes past its SMA20 at 49.14.

 UPDATE: 12:00 PM
There’s the white and yellow necklines. Should see a bounce here, so back to long with tight stops (lots of stronger support just below, such as the SMA20 at 2082.86 and the Jun 3 lows of 2085.36. USDJPY is at obvious support — but, is also probably in a pause that will resolve lower. Note the flag pattern and our target down at 105.41.
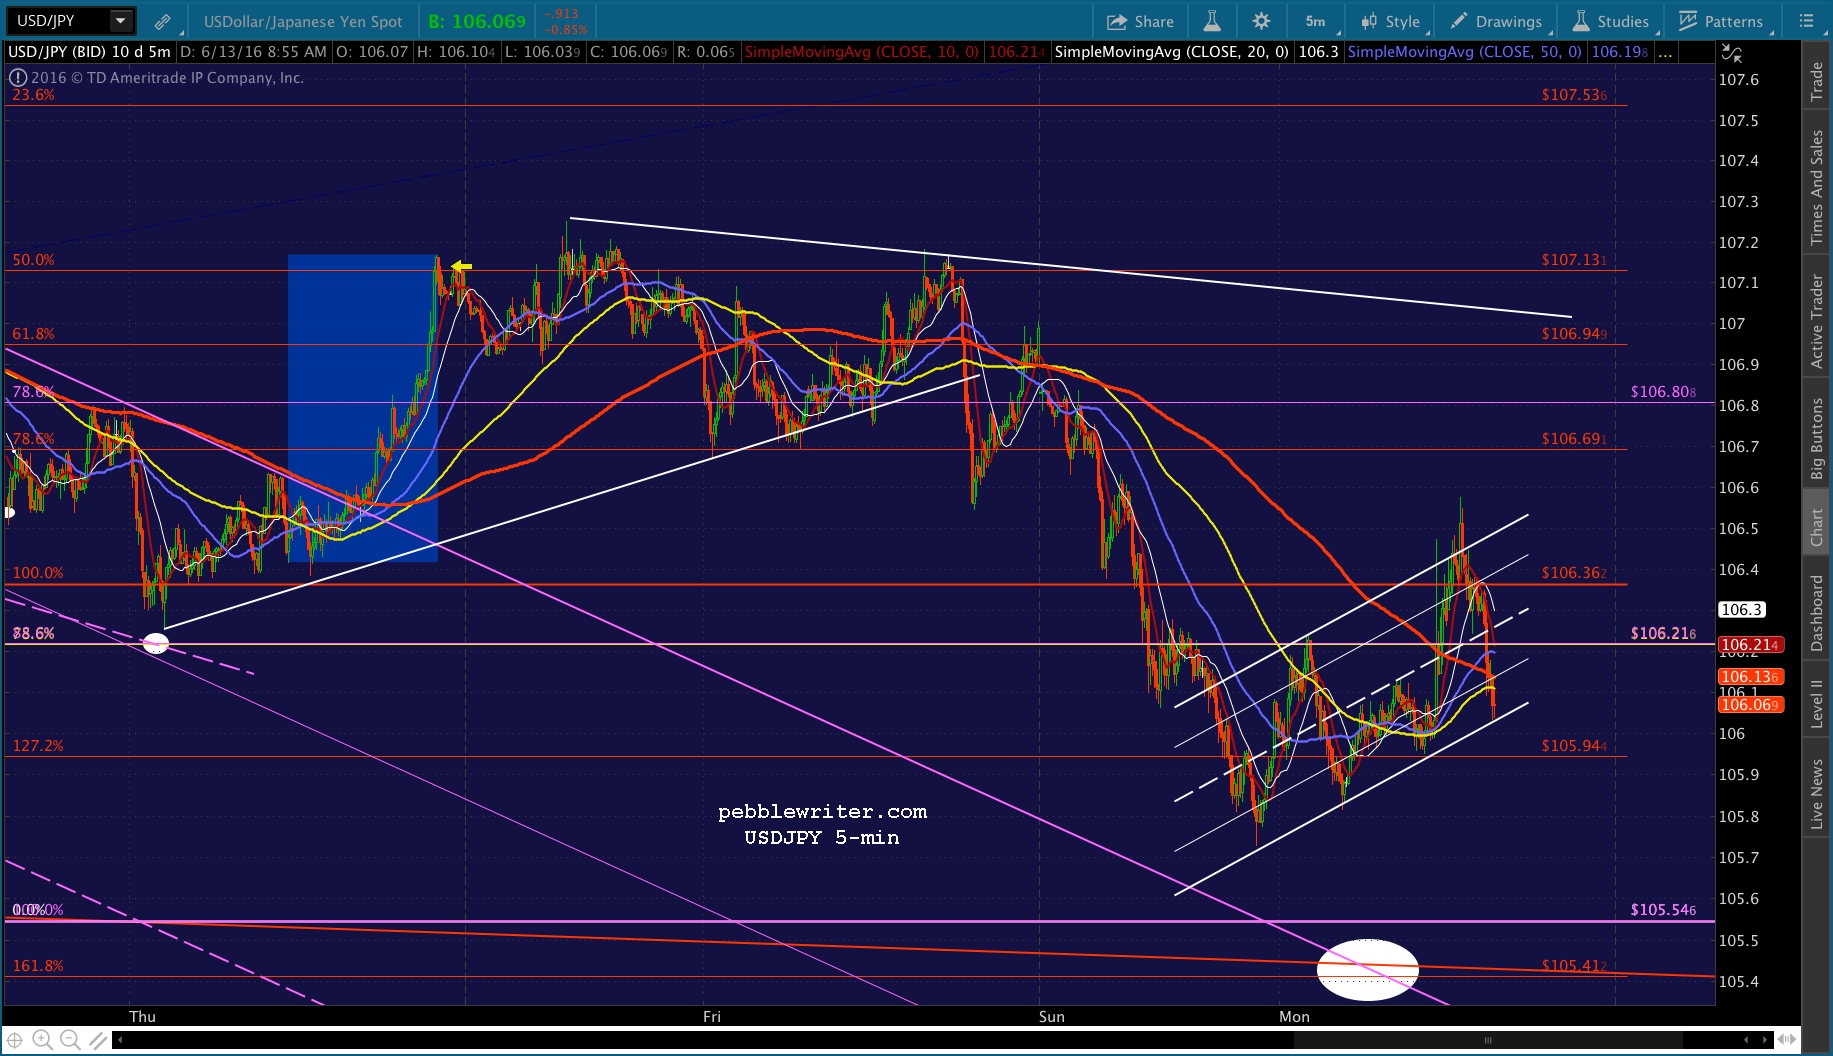 CL’s support is nothing really special and it clearly hasn’t started spiking the way it usually would if the downside was over.
 NKD doesn’t look finished. 15893 and 15876 would make better bounce spots.
UPDATE: 12:22 PM
ES’s targets down at 2071-2073 would be better bounce spots. So, I believe SPX has further to go — probably to 2081-2082. In adjusting the rising purple channel, it seems like a pretty good fit. It’s roughly parallel to the broken red channel.
 USDJPY and CL – very modest bounces so far:
 UPDATE: 12:33 PM
ES is slipping. I’d go back to cash here until CL or USDJPY break out more visibly. Traders might wish to revert to short.


 UPDATE: 1:12 PM
SPX and ES are dipping, and USDJPY and CL are just watching. No ramp at all. Back to short here on any drop through the SMA5 20.
 UPDATE: 1:19 PM
Shorting here on CL’s plunge through horizontal support.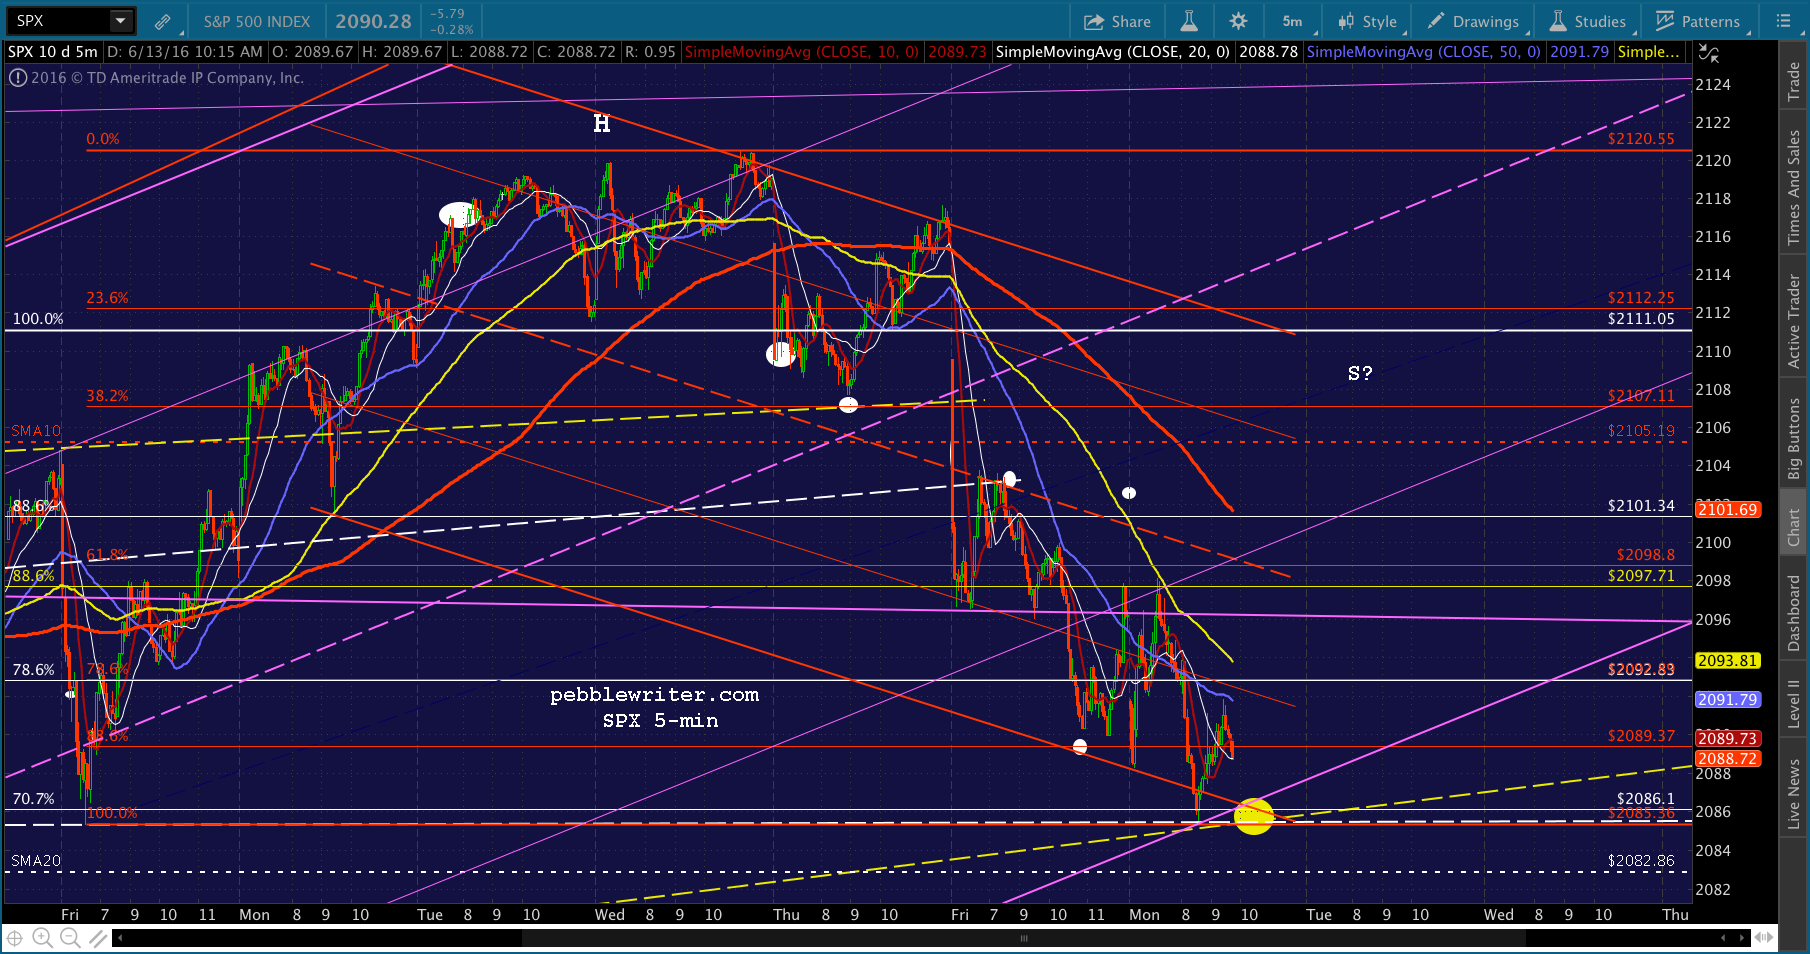
 UPDATE: 2:28 PM
Logjam is about to break. Still no clarity on exactly where, but should be ES 2070.88 or 2073.45.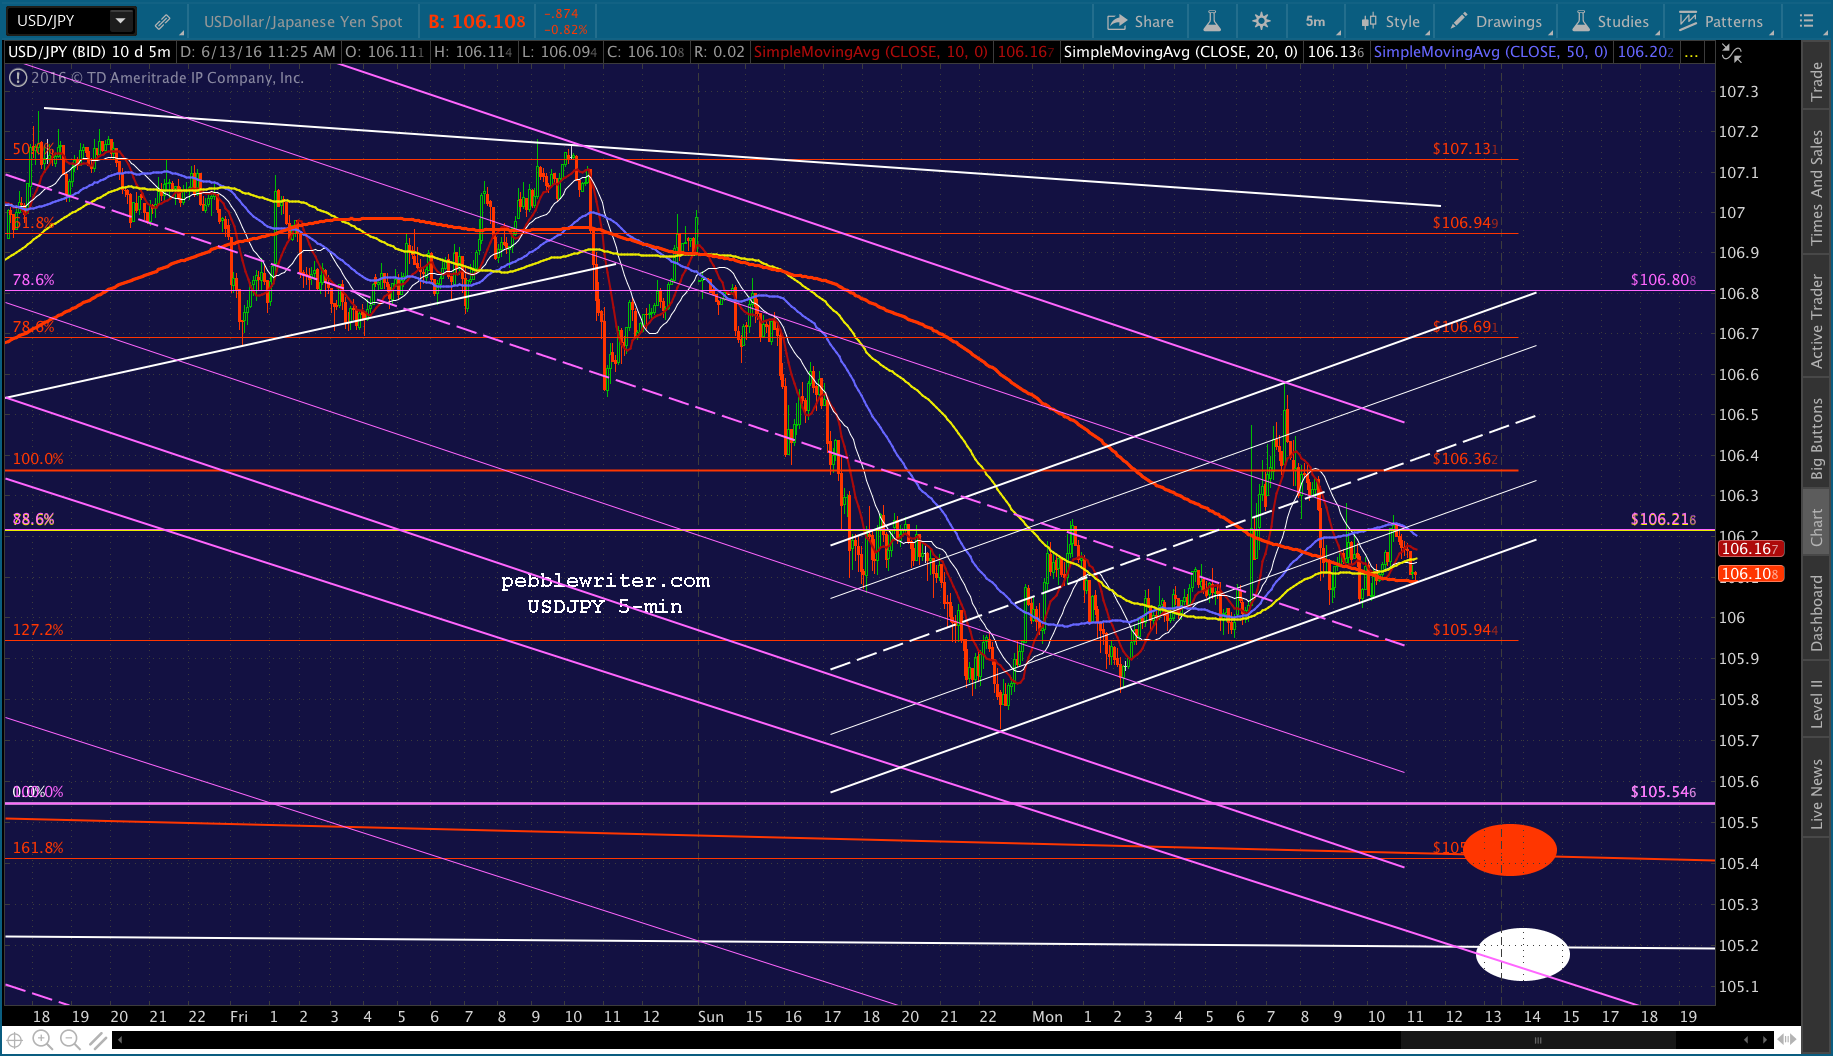


 CL, on the other hand, says it ain’t happening. Unless this is a head fake, it’s time to close the short and revert to cash.
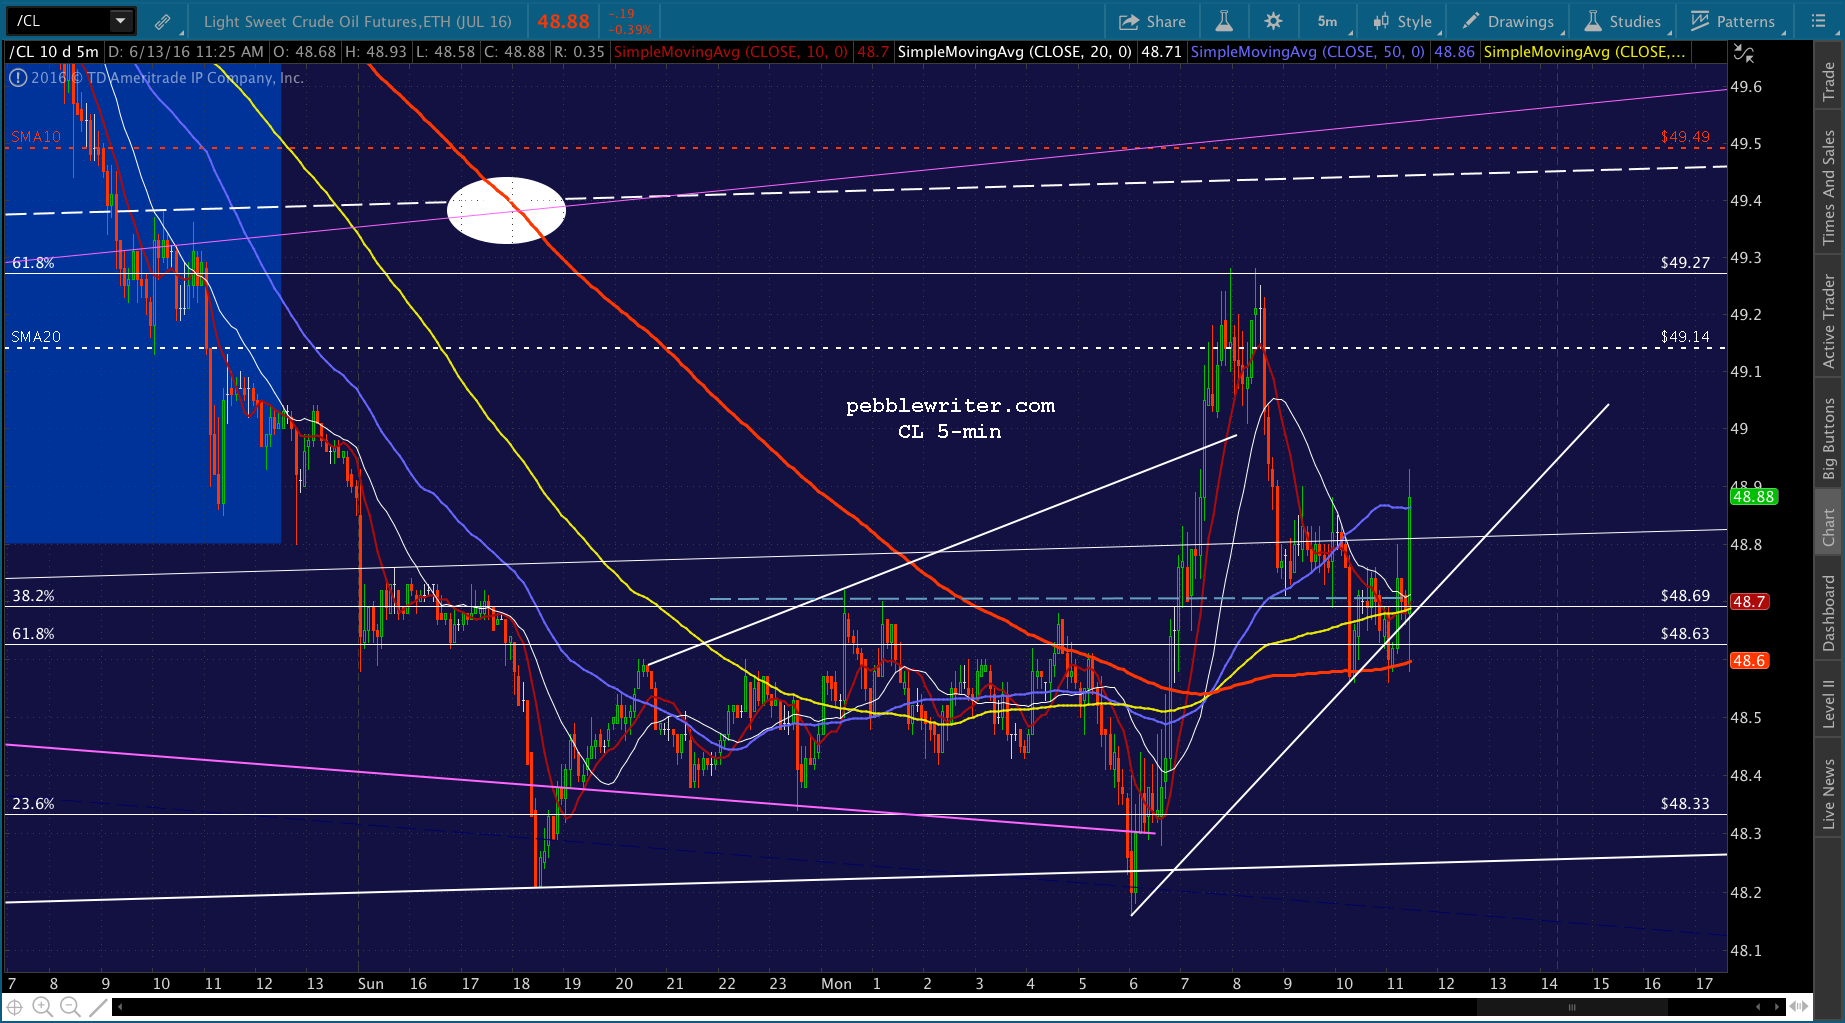 UPDATE: 2:34 PM
It’s almost certainly a head fake, but I see no value in holding short when CL is popping and SPX could pop out of this falling wedge at any minute. Back to cash for the time being. We’ll know it’s time to short again when NKD drops through 15995 and USDJPY below 106.09. Having said that, there’s a very good chance that SPX closes in this neighborhood, and ES dips down to tag one or more of those lower price targets after hours.
UPDATE: 2:50 PM
I’ll take one more stab at it. Shorting here on USDJPY and CL dips.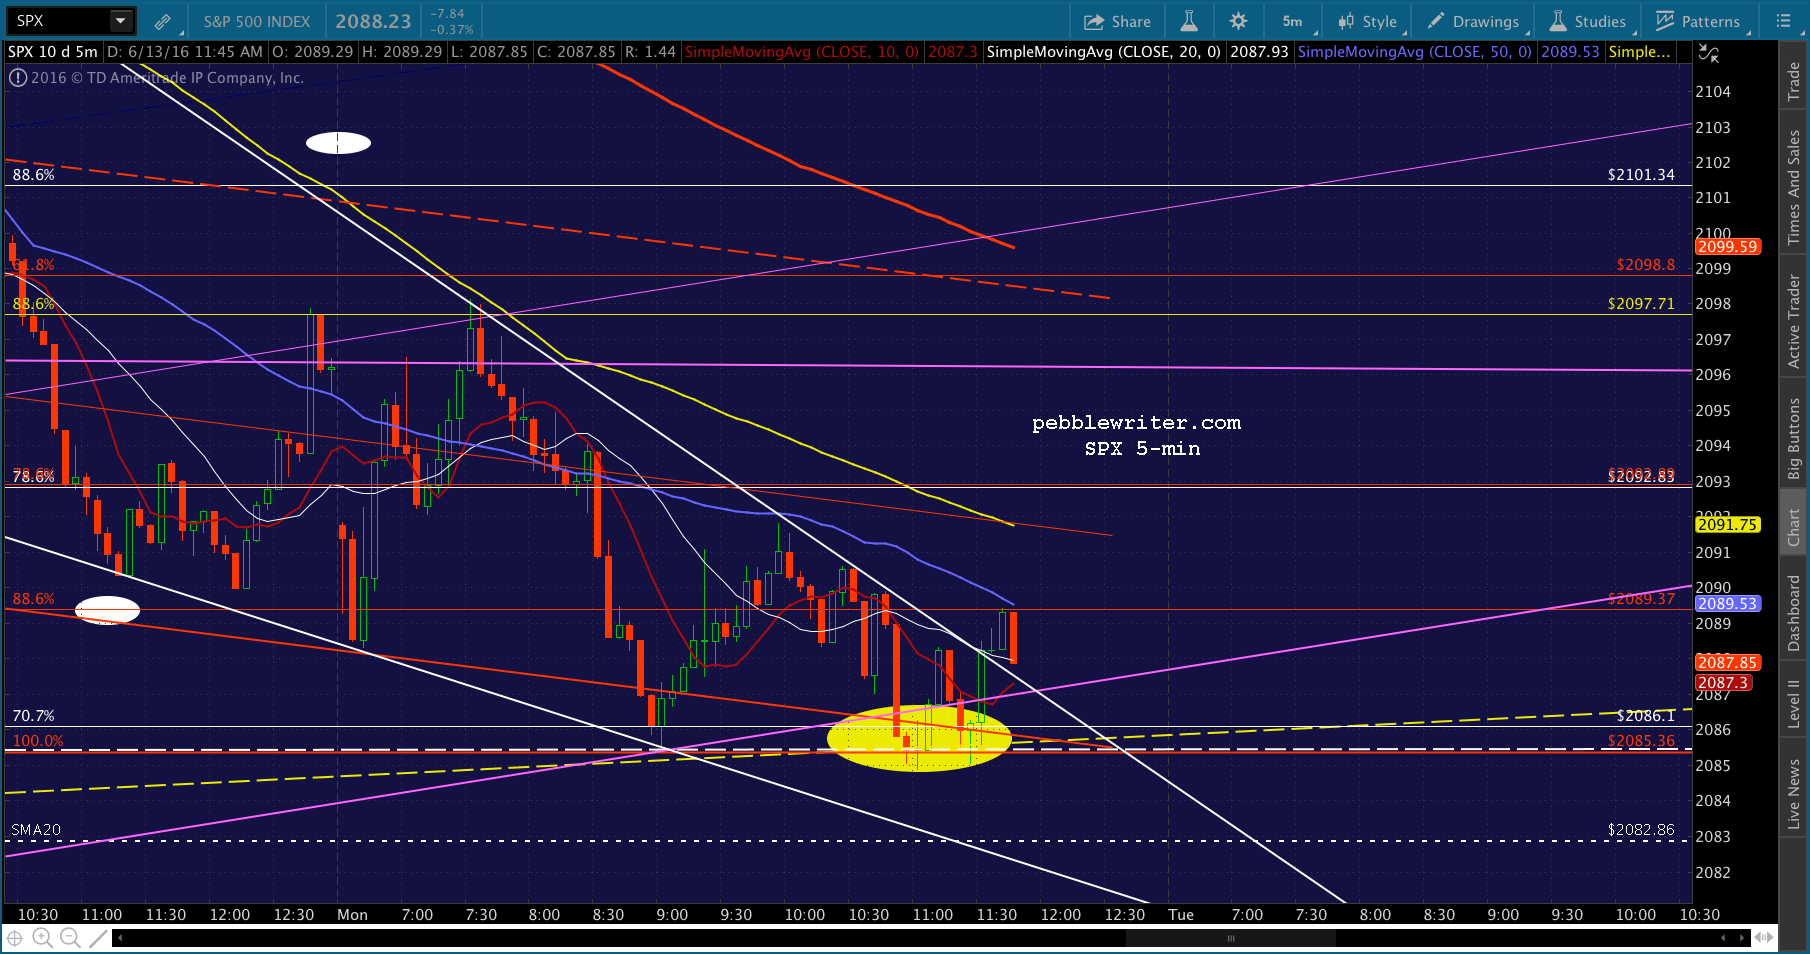 NKD still hasn’t broken down, so this might be nothing…
 UPDATE: 3:15 PM
SPX just tagged the SMA20 and ES its SMA50. There might be more to come, as NKD is still dropping, but I’d be comfortable covering the short here. If it doesn’t reverse, then SPX’s .618 at 2078.53 is the next serious support, followed by the SMA 50 at 2076.37.


 UPDATE: 3:33 PM
NKD is trying to force stocks lower — either heading for 2078.53 or it’s a nifty headfake. I’d take another swipe at the 6-7 points. Back to short here with very tight stops.

 BTW, I would not be inclined at this point to hold short overnight unless you can hedge or watch it very carefully. Nice selloff here at the close, but there’s a lot of chart pattern support here that smells a little too much like a bear trap.
UPDATE: 3:58 PM
That should do it. Back to cash here for the night on CL’s bearish efforts.
Comments
2 responses to “The Market’s Evil Twin”
Hey PW, will you be able to update the “current forecast” (AKA more long term forecast) sometime this month, maybe after all the central bank meetings this week? I realize anything long term is hard to chart in the current environment, but it is still useful for many portfolios to have some clues to the months ahead.
Yes, thanks for the reminder. I’ll work on it today, now that we’ve finally reached some important downside targets.