Big storms are always scary. But, it’s usually the day after when we get the chance to assess the damage and count the casualties. So, here we are.
I’ve been yacking about ES 2728 so often and for so long, I’m sure a few of you were starting to tune me out.
Yet, the logic of this target was too compelling to ignore, as we’ve shown on every daily chart for the past several months.
Take this one, for example, from Feb 14 [see: A New Day] when ES came within 9 points of its eventual high a few sessions later. The red channel, which had broken down once already, was trying to get to 3600. If it failed, the white channel would then offer doubters a clear warning.
The final line of defense was the yellow 2.618 extension at 3076. If you ignored all those warning signs, then you probably had a pretty miserable day yesterday. I think we can safely put the ES 2728 argument to rest now.
 But, what about SPX 2703?
continued for members…
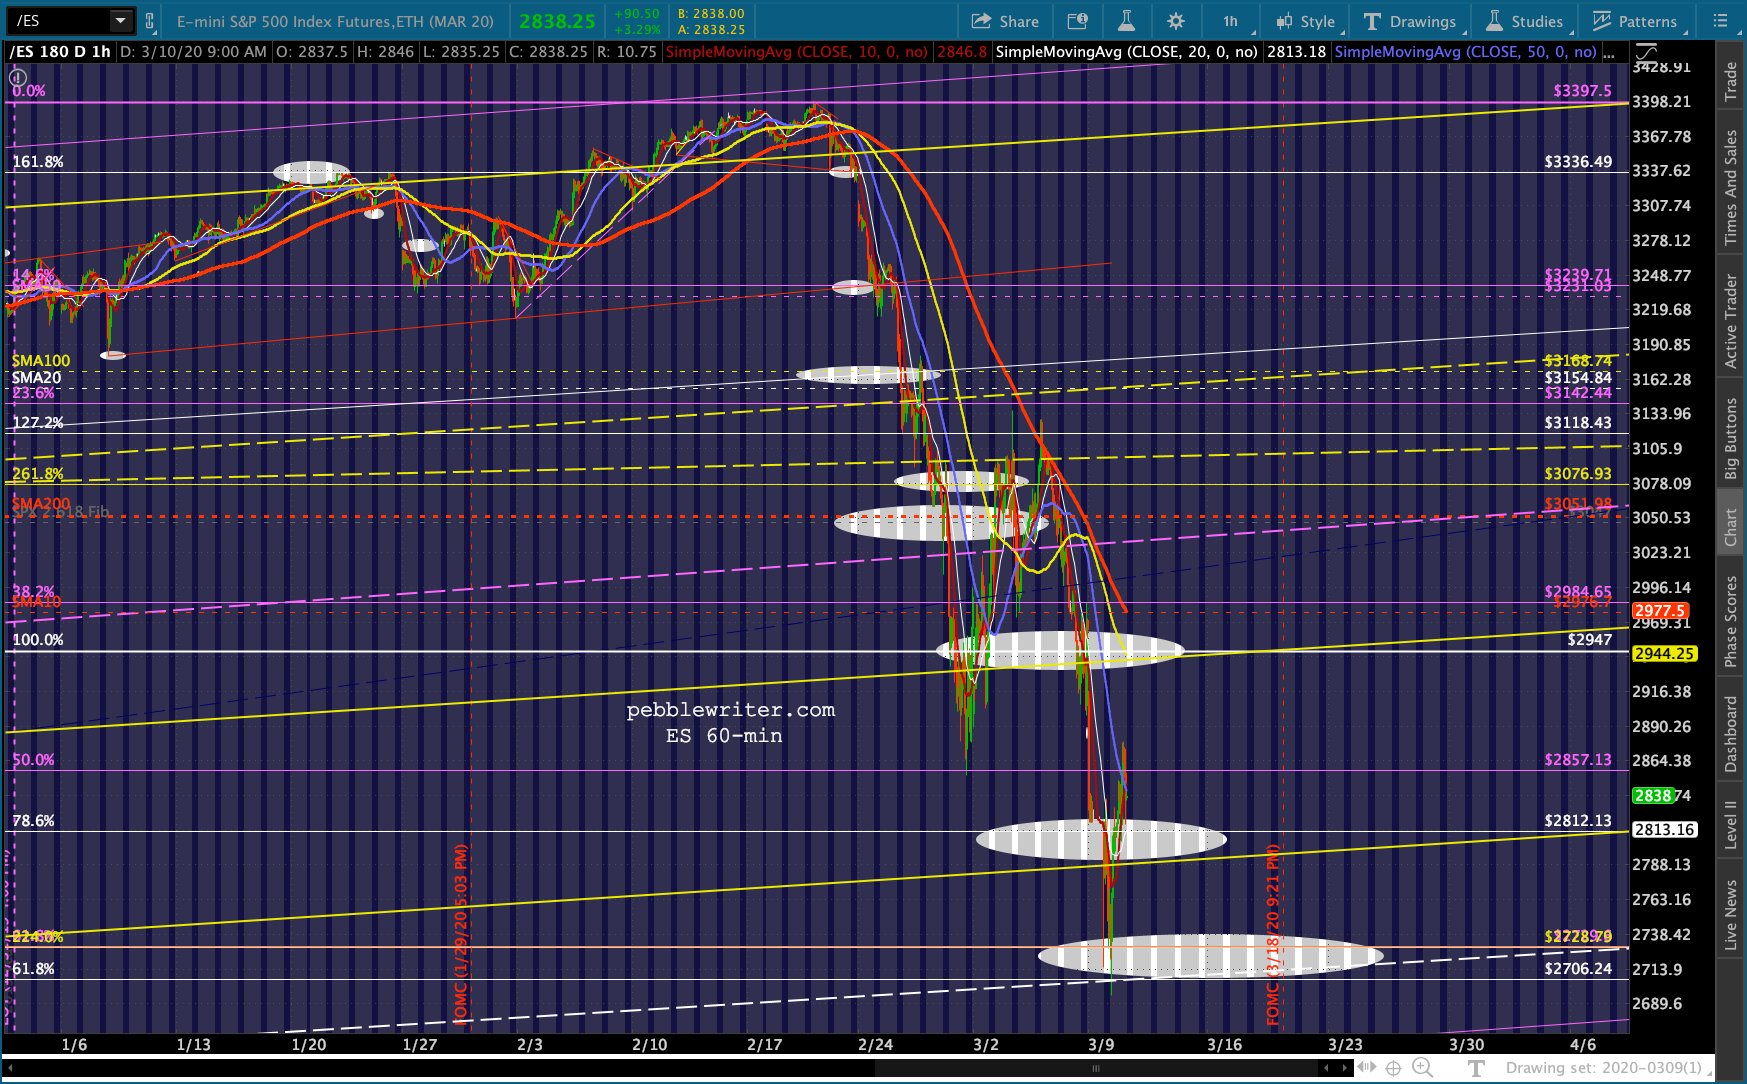
The complication has always been that ES and SPX didn’t properly align. And, 2703 is such a perfect target – better, in some ways, than ES 2728. Whether or not we get another dip to SPX 2703, the yellow channel bottom has been tagged. It’s just that it would just be more legit if the 2.24 fib were actually tagged too. No guarantee, though.
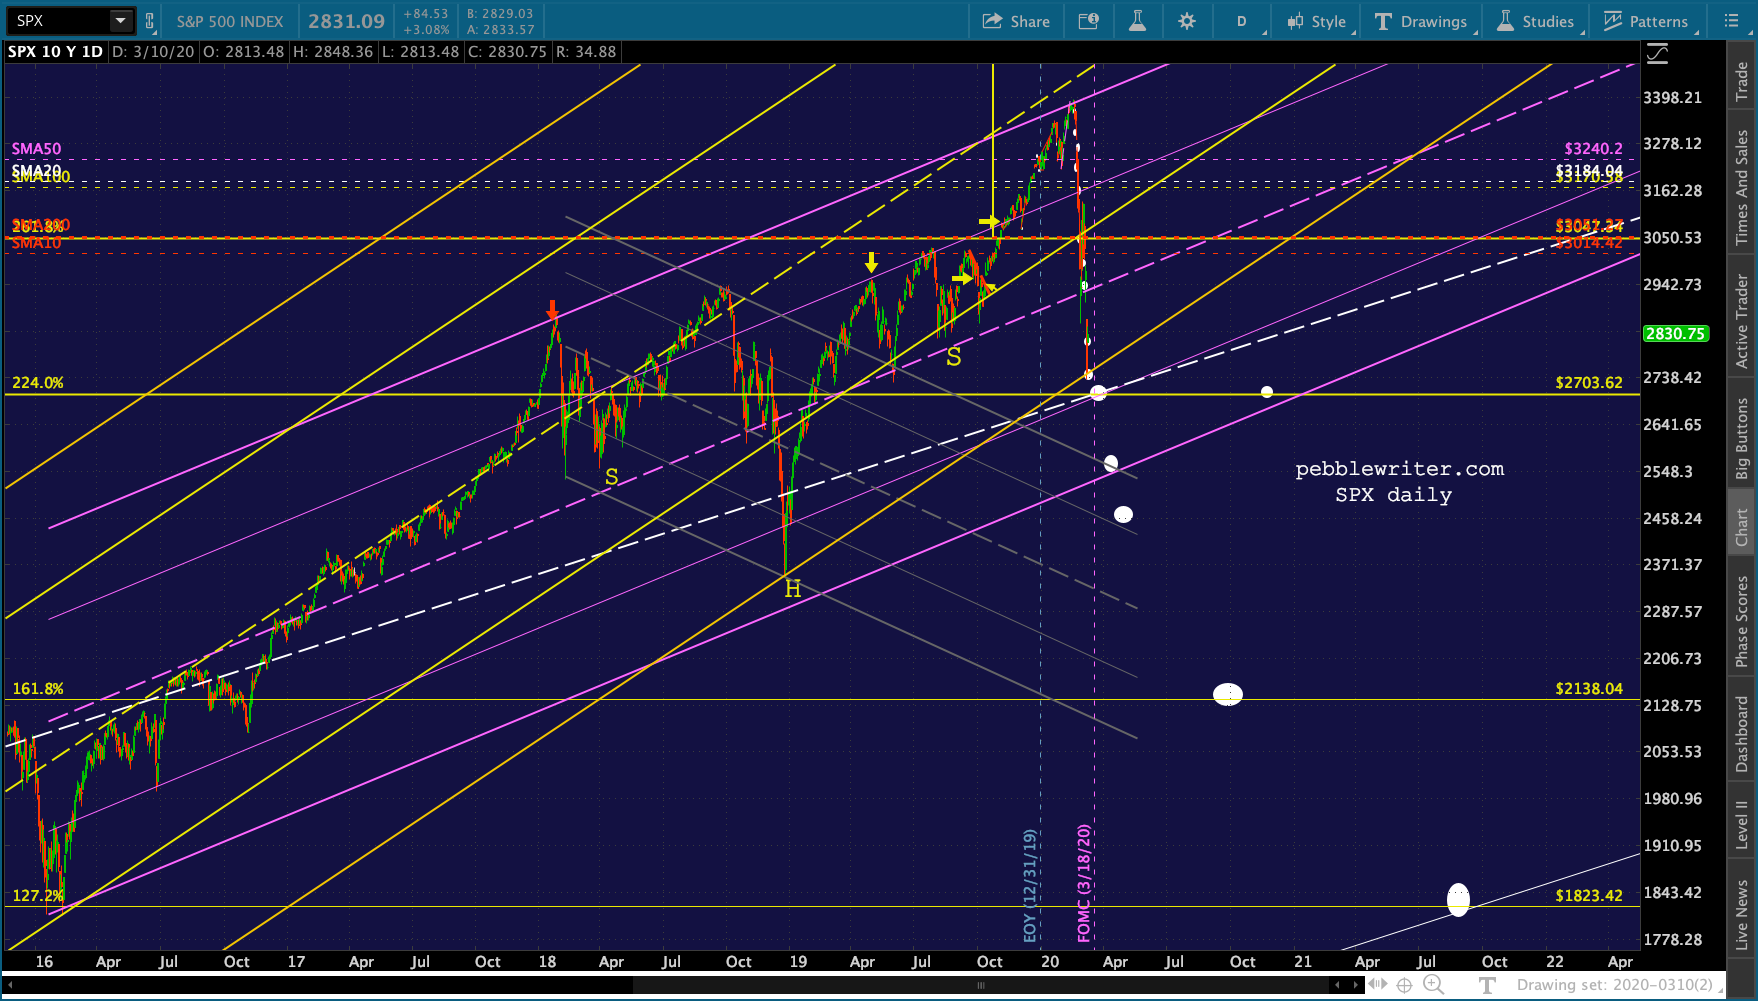 As we’ve discussed many times, the yellow channel is also the midline of the much bigger white channel. Together with the 2.24 Fib, they are the only things standing in the way of much lower pricess such as 2138 and 1823.
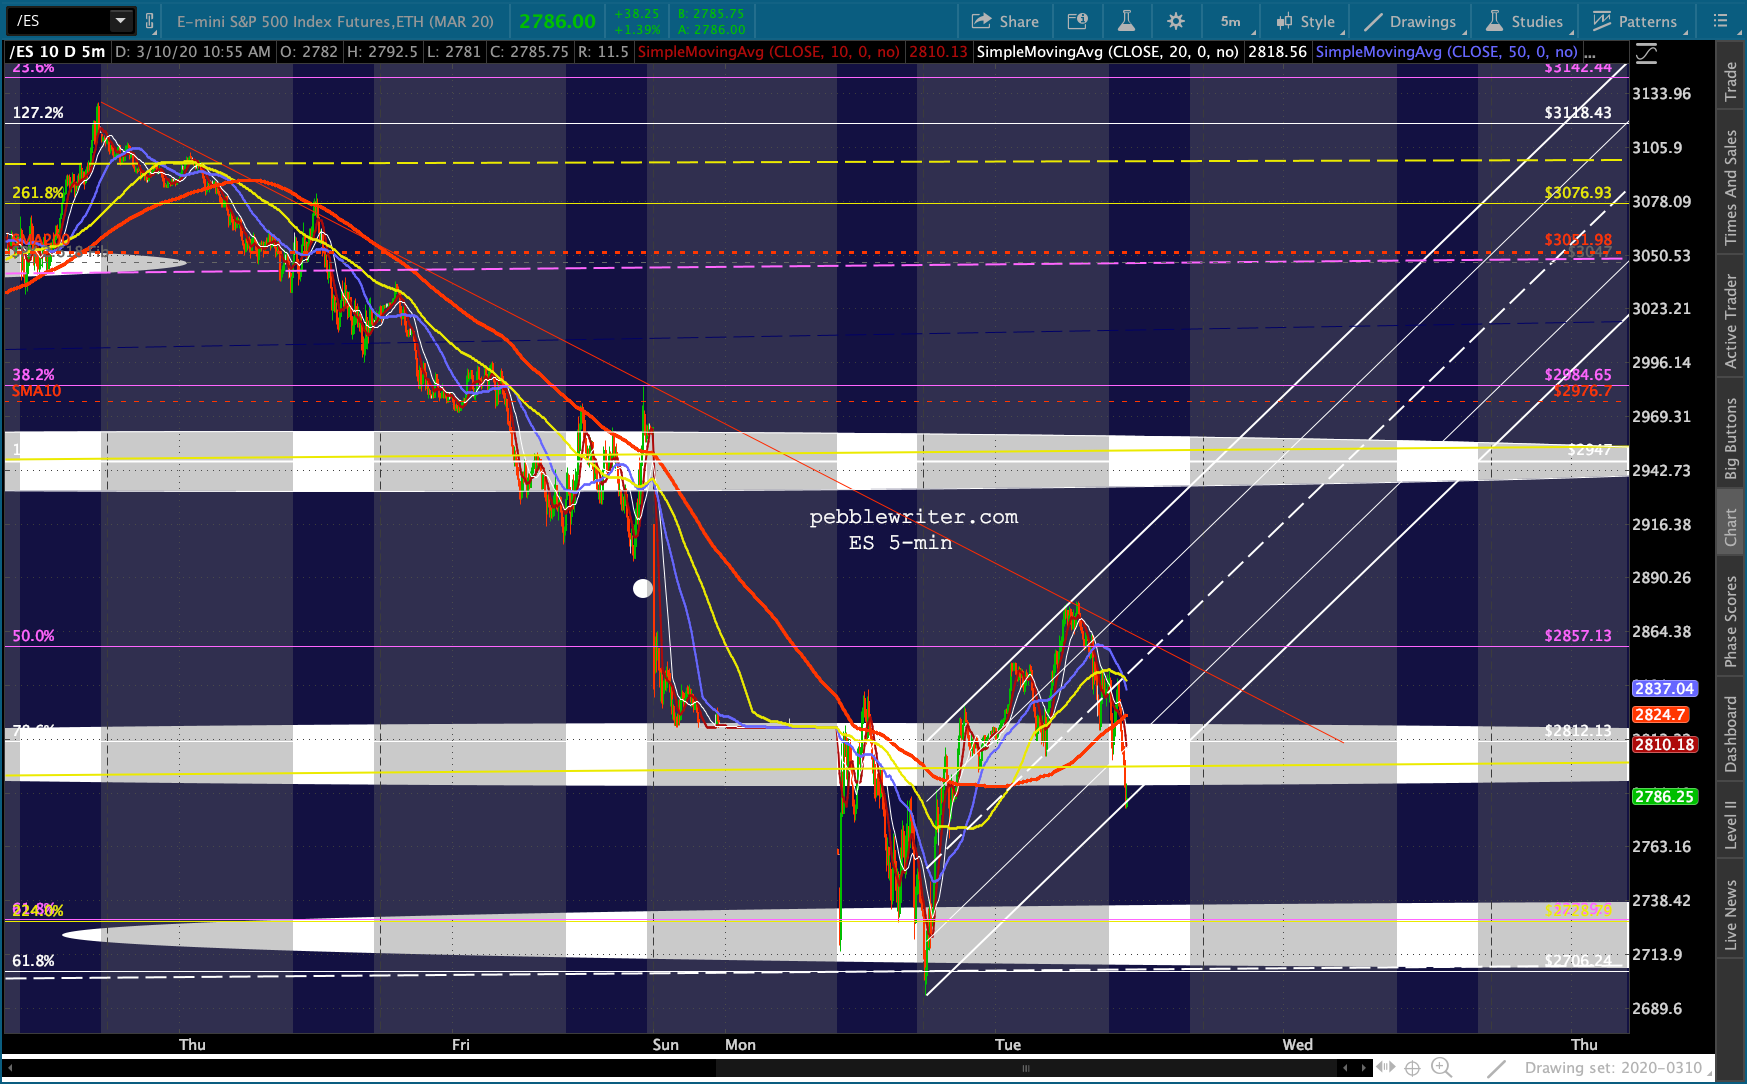
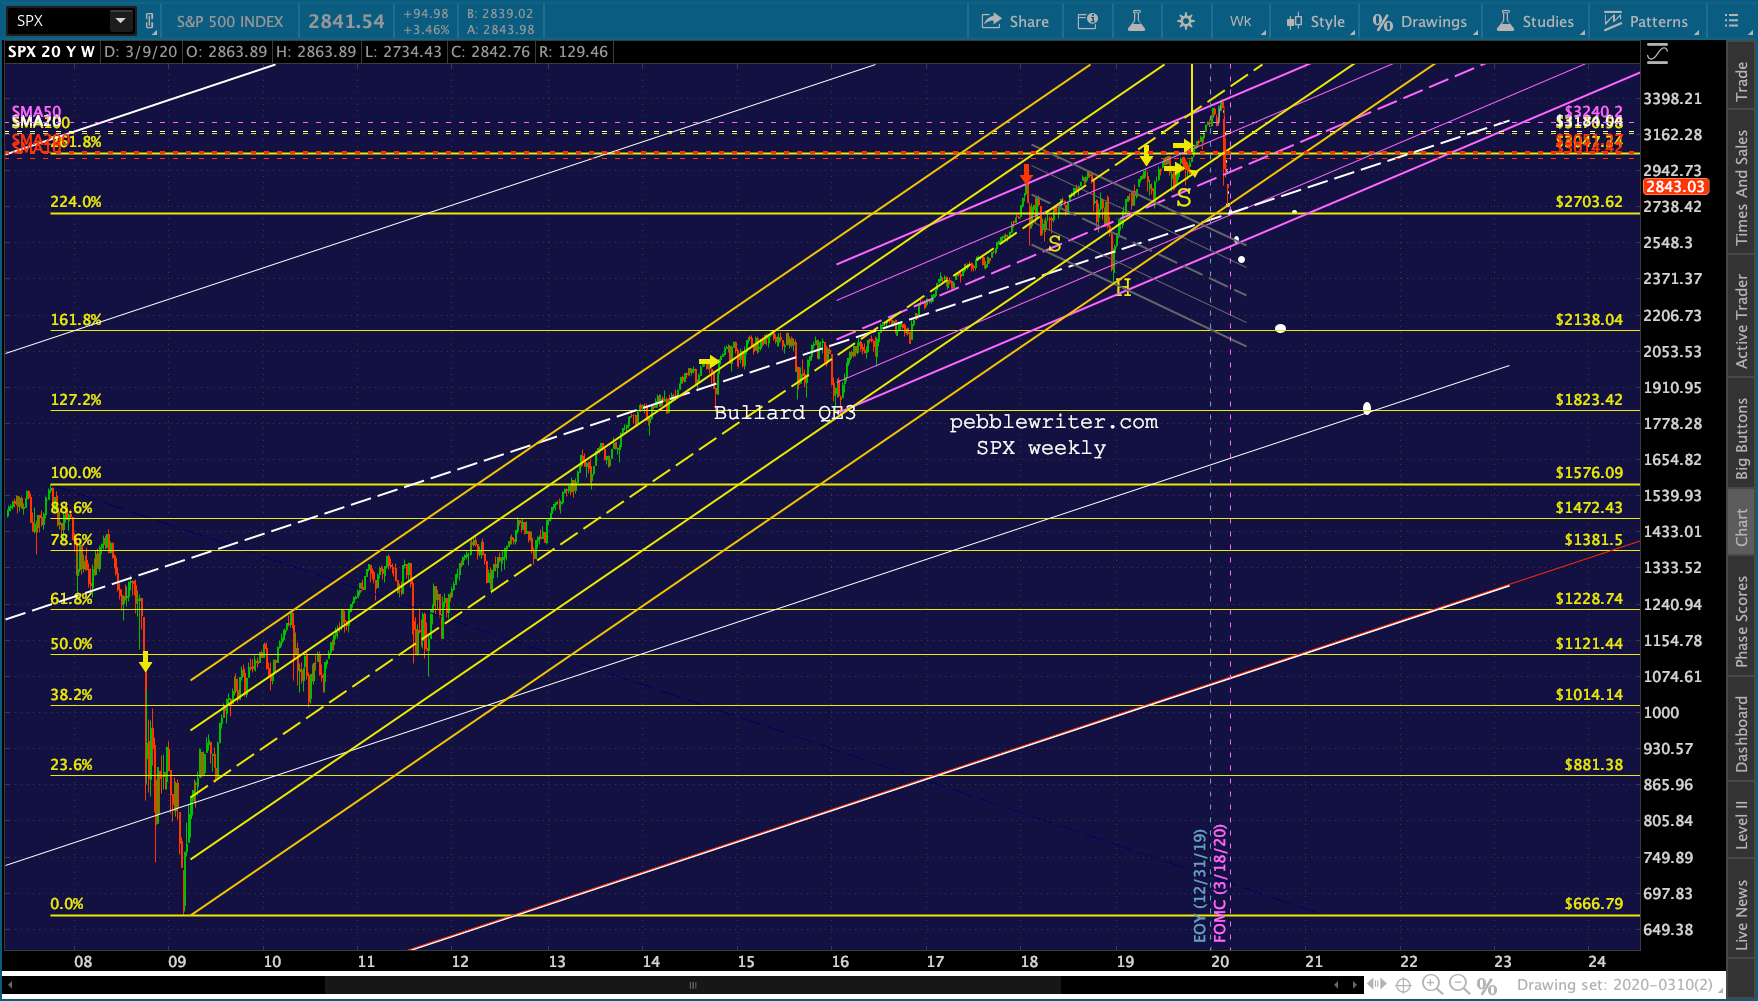 So far, ES is indicating some interest in slowing its bounce, but it’s hardly conclusive. Maybe if this channel on the 5-min chart were to break down, currently about ES 2777.
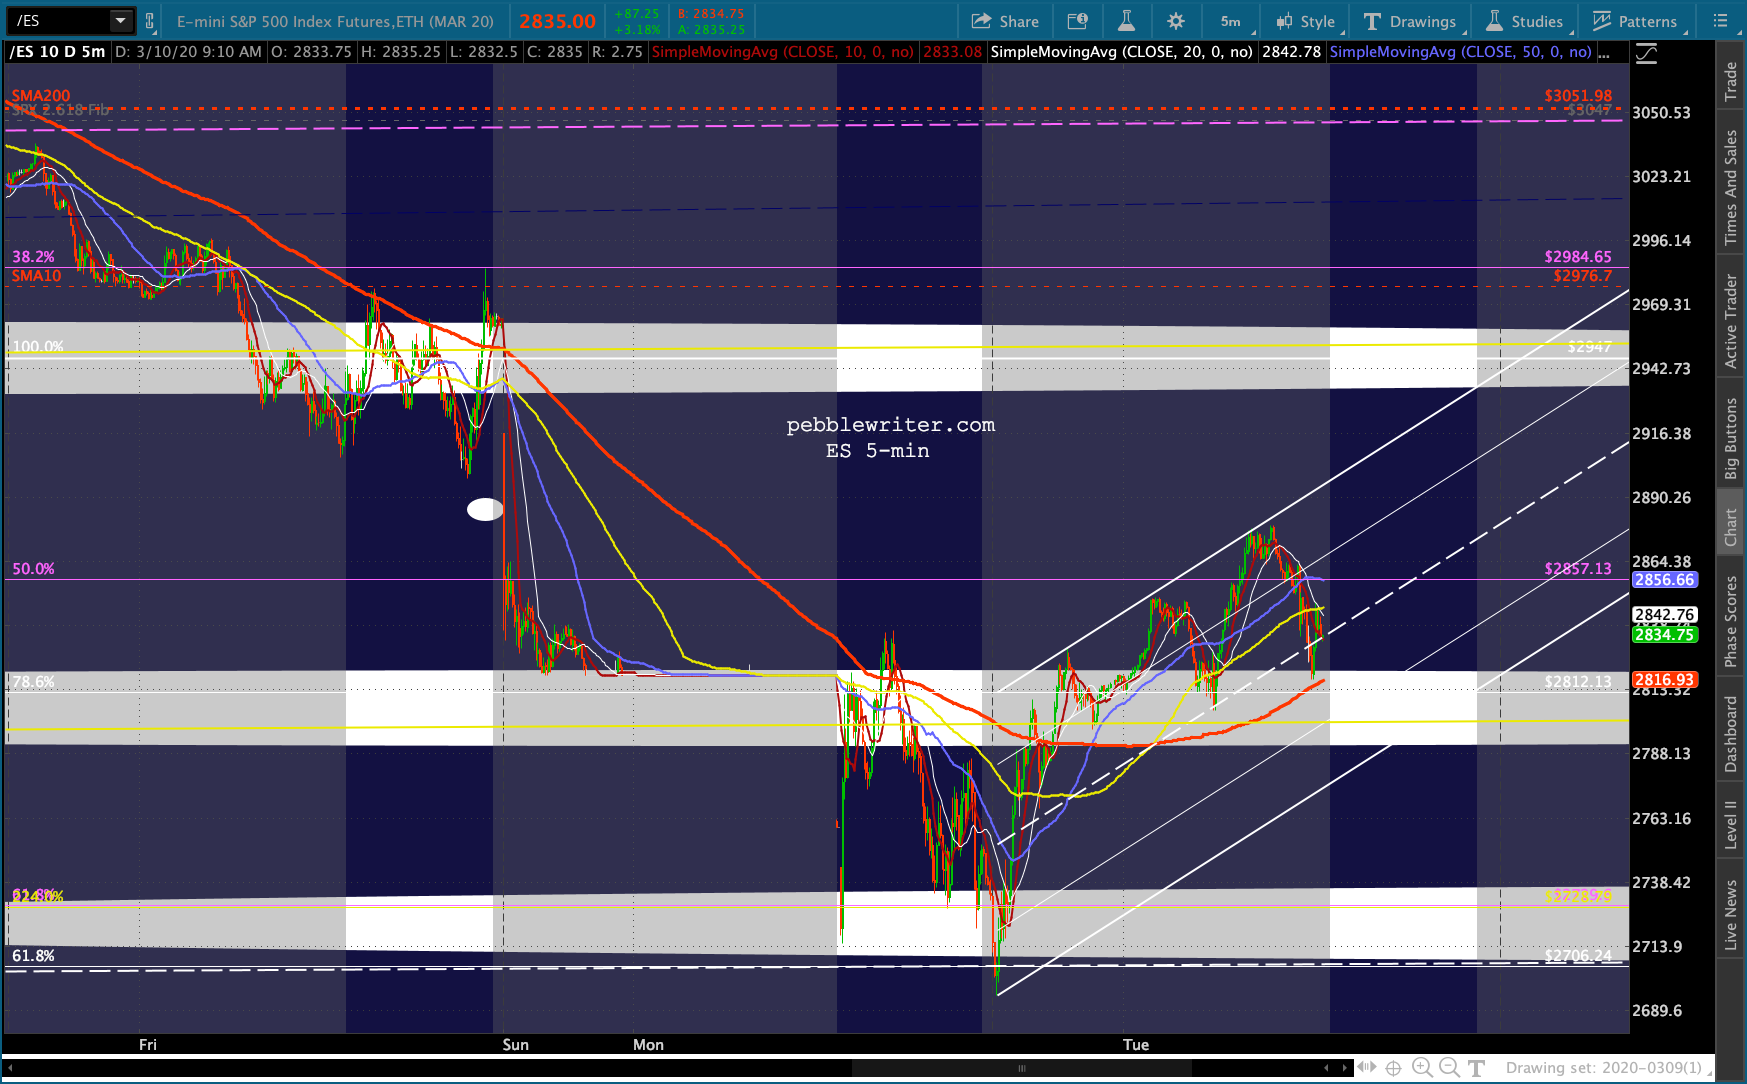
 The 60-min version…
 Many of our factors reached actual targets or reasonable bounce spots. VIX clearly shows more upside potential.
 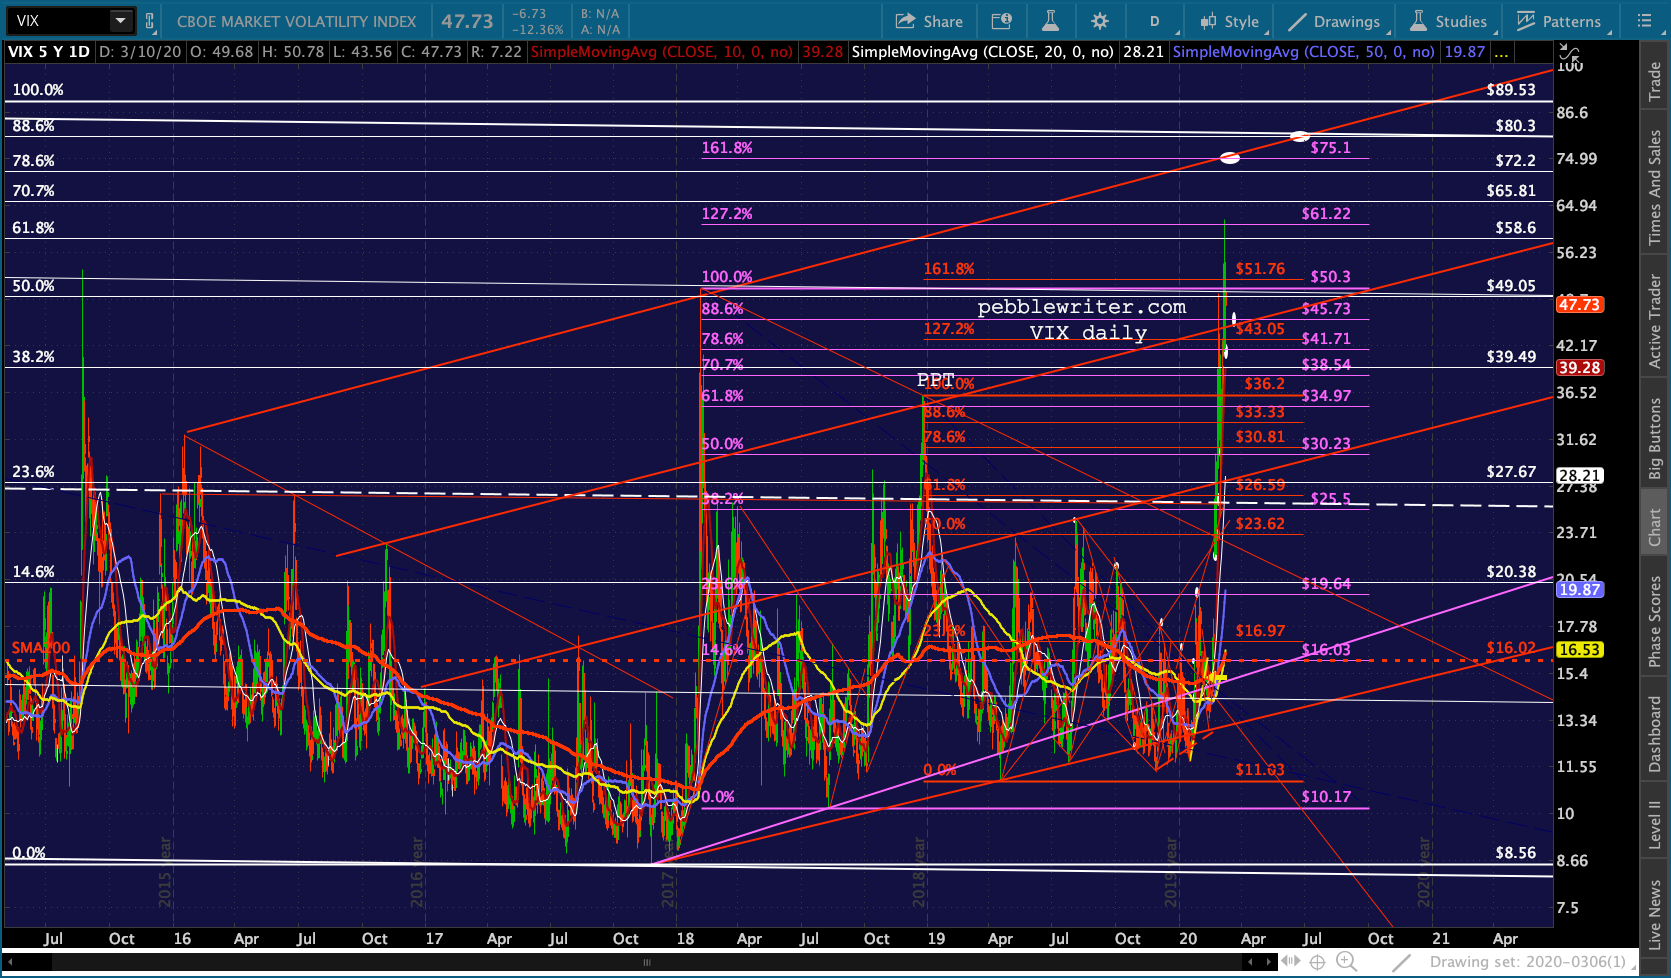 But, it also has a little TL on the 60-min chart that it could break down through in order to pump stocks higher.
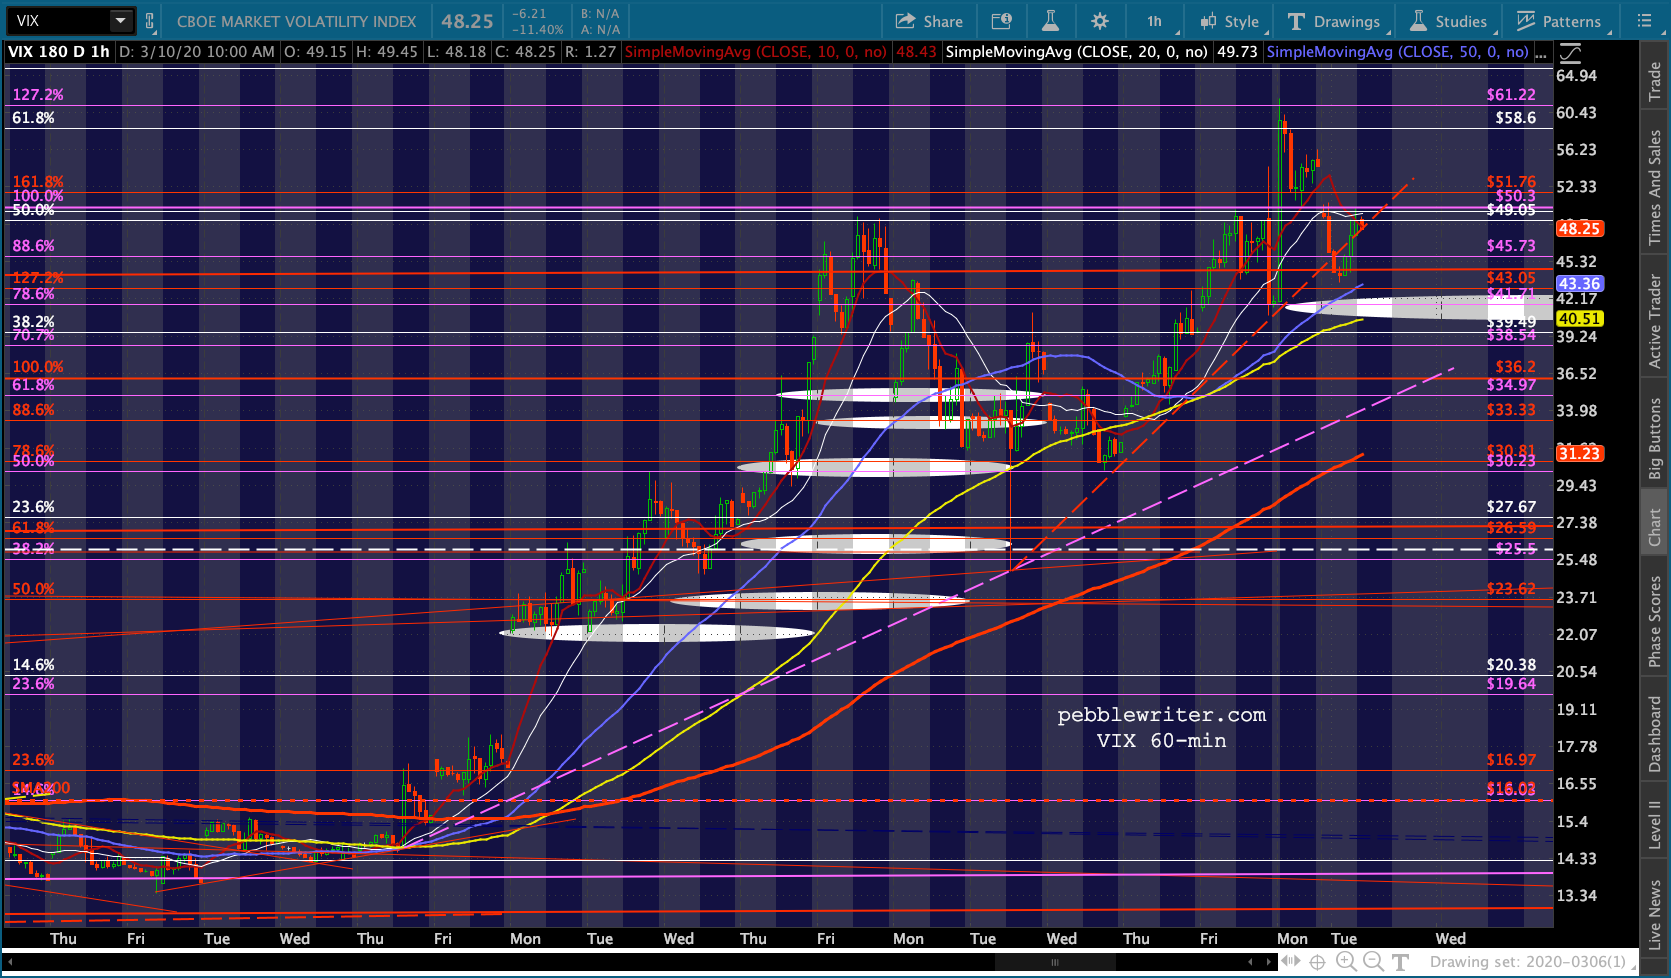 RB has reached a deep .886 retracement.
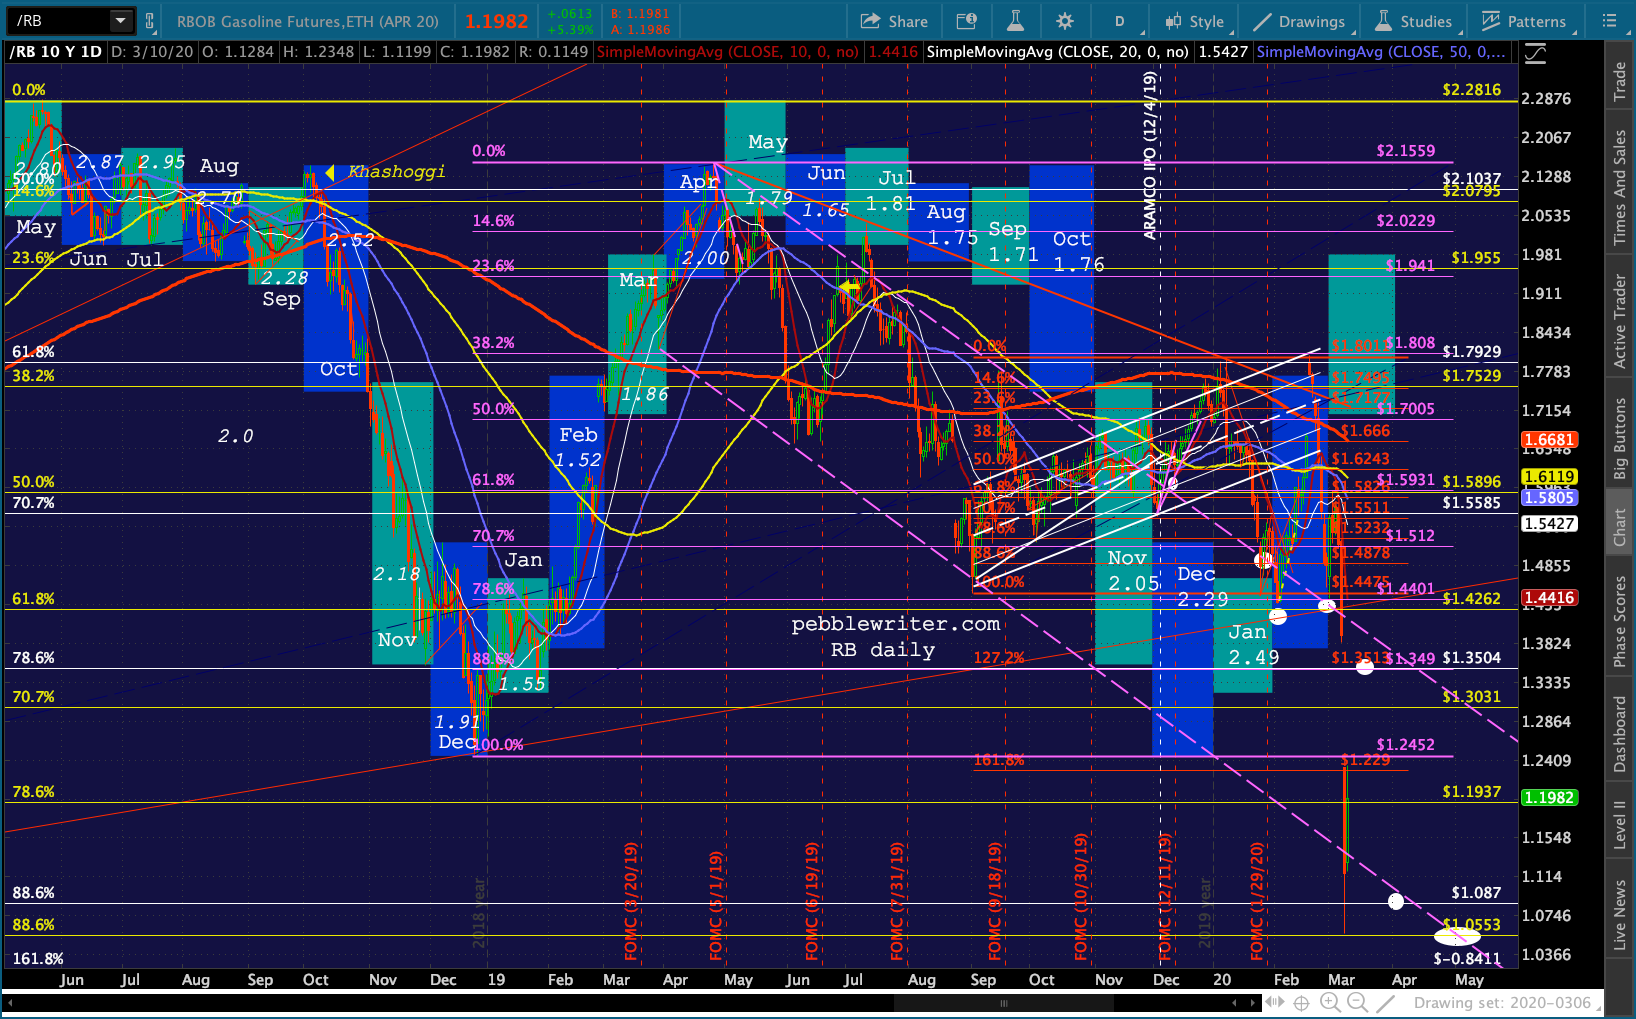 But, although it will obviously give the Fed cover for anything it feels like doing next, it has little other support here – especially if CL continues to crater.
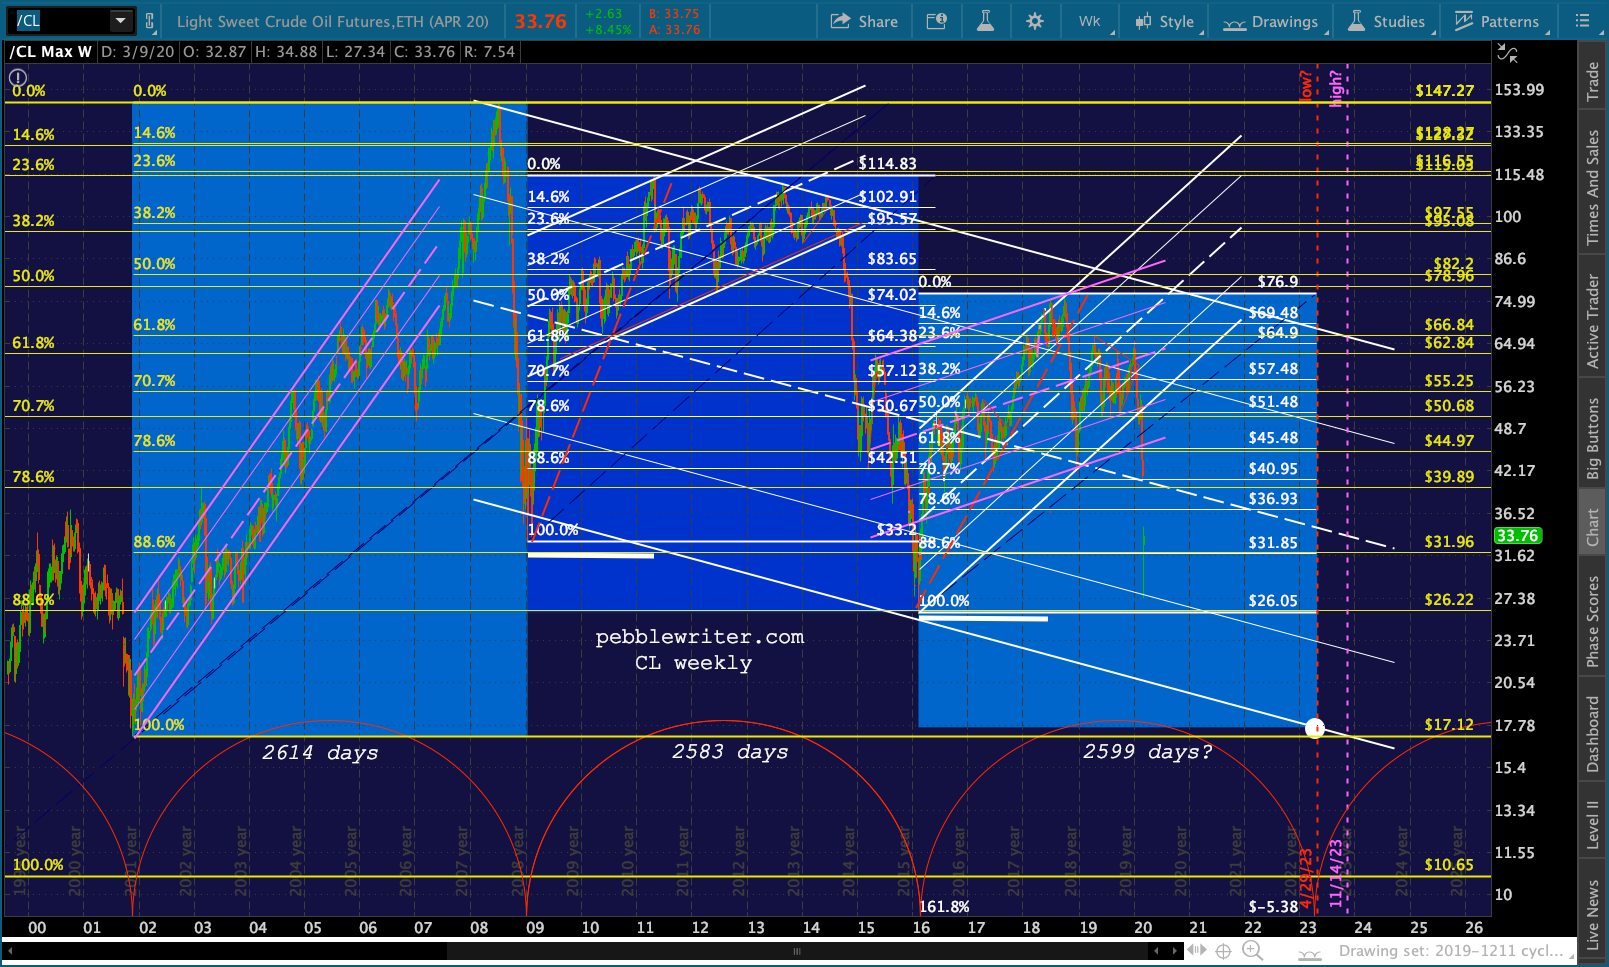
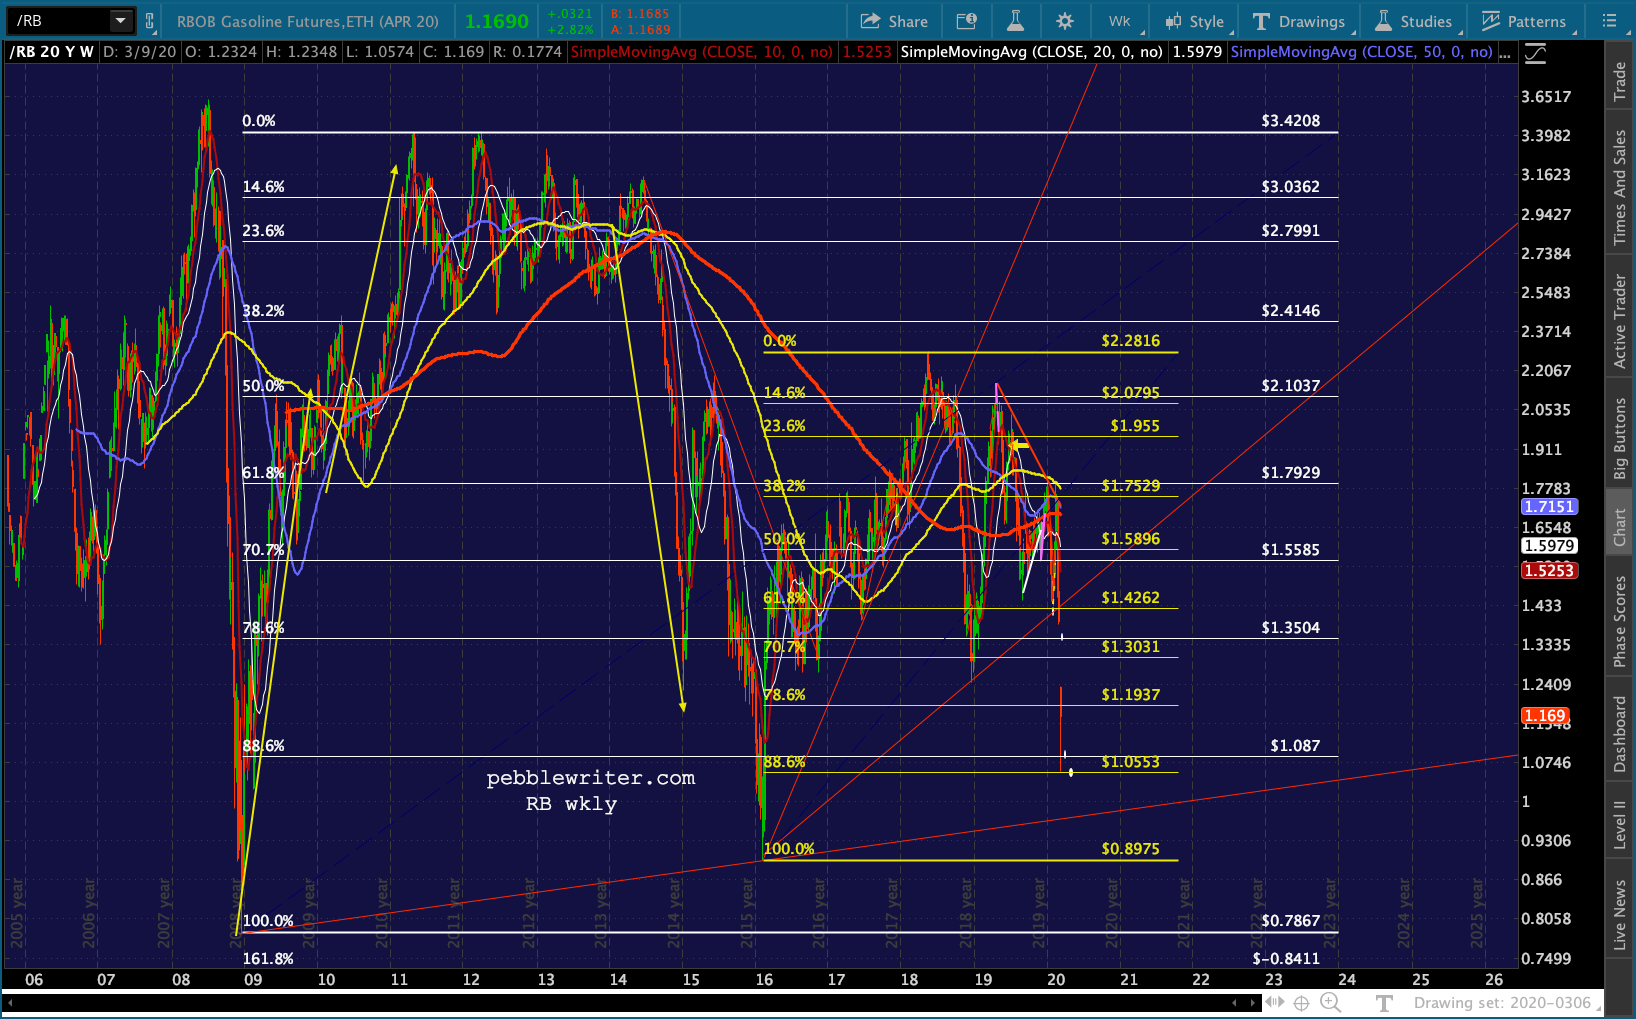 CL, meanwhile, reached a 1.618 extension…
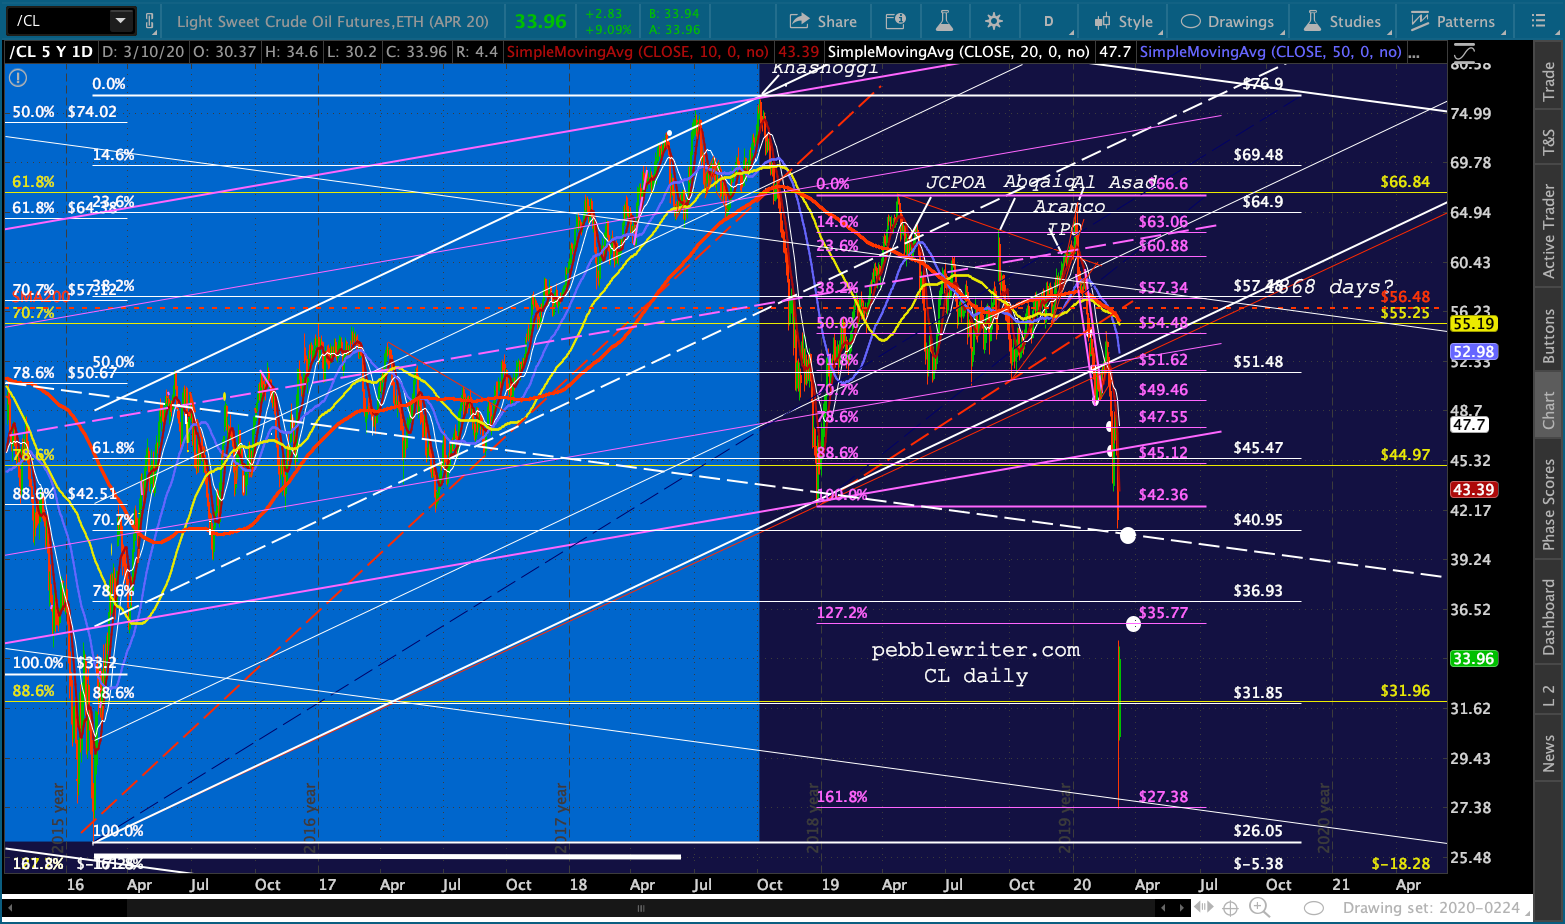 …and the .236 line of its huge falling white channel. Yet, I’ve heard nothing from the Saudi-Russia front to indicate the conflicts have been smoothed over.
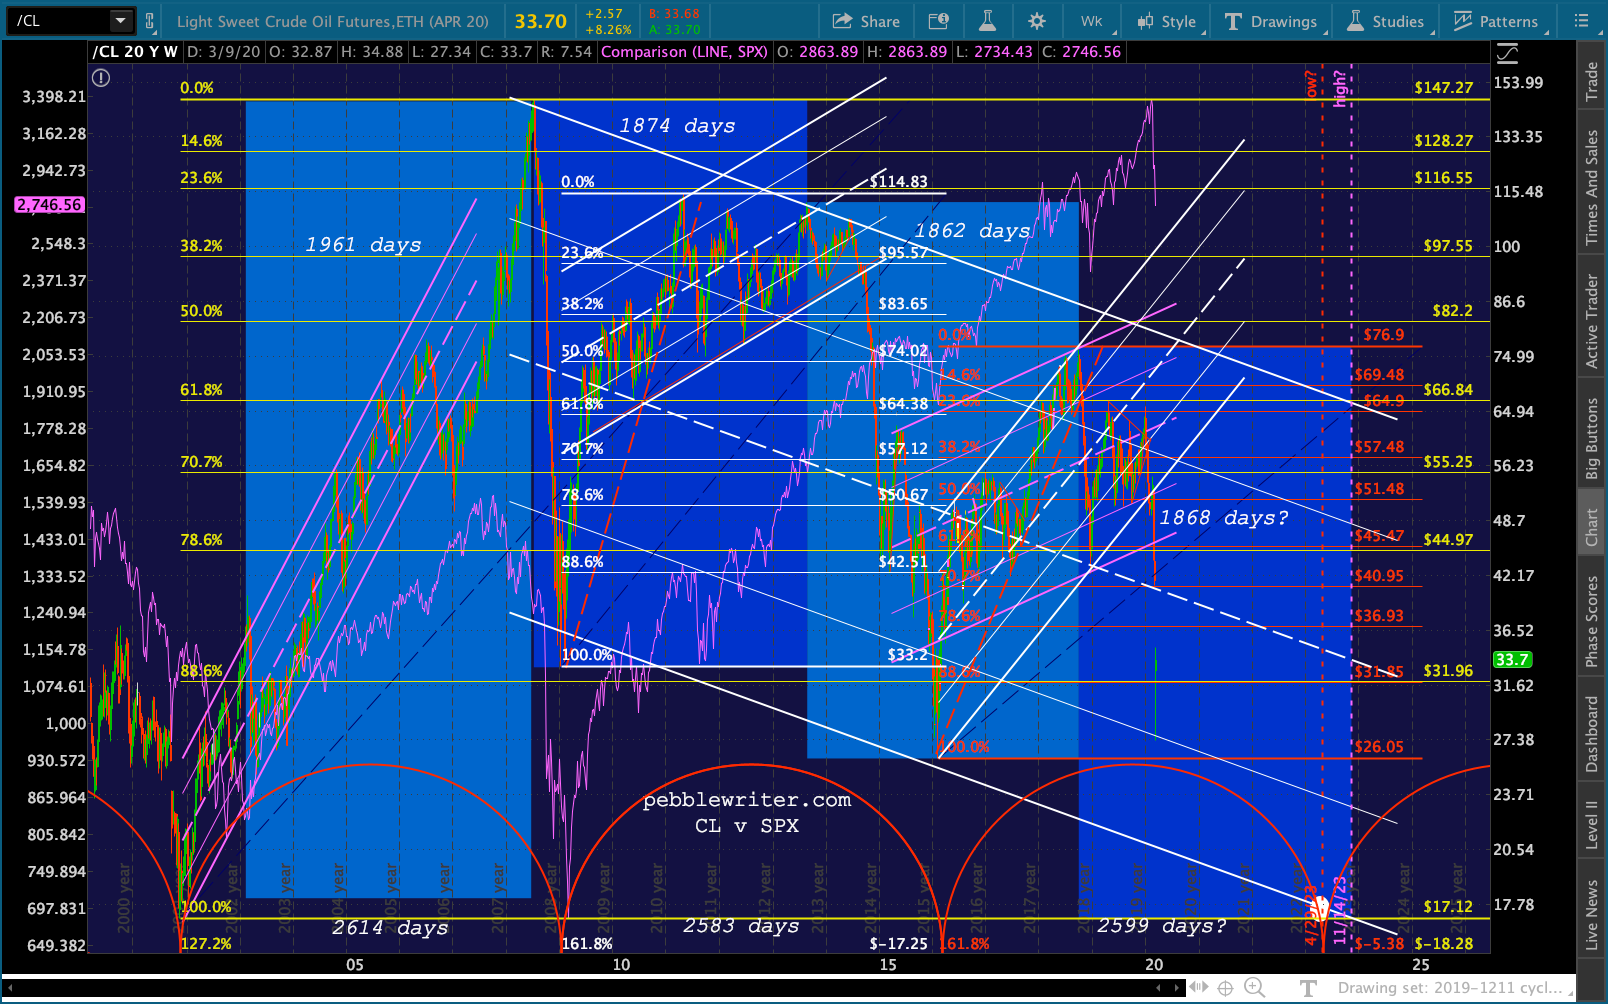
 USDJPY is getting a nice bounce off its .886 and is likely to backtest its red channel .786 line…
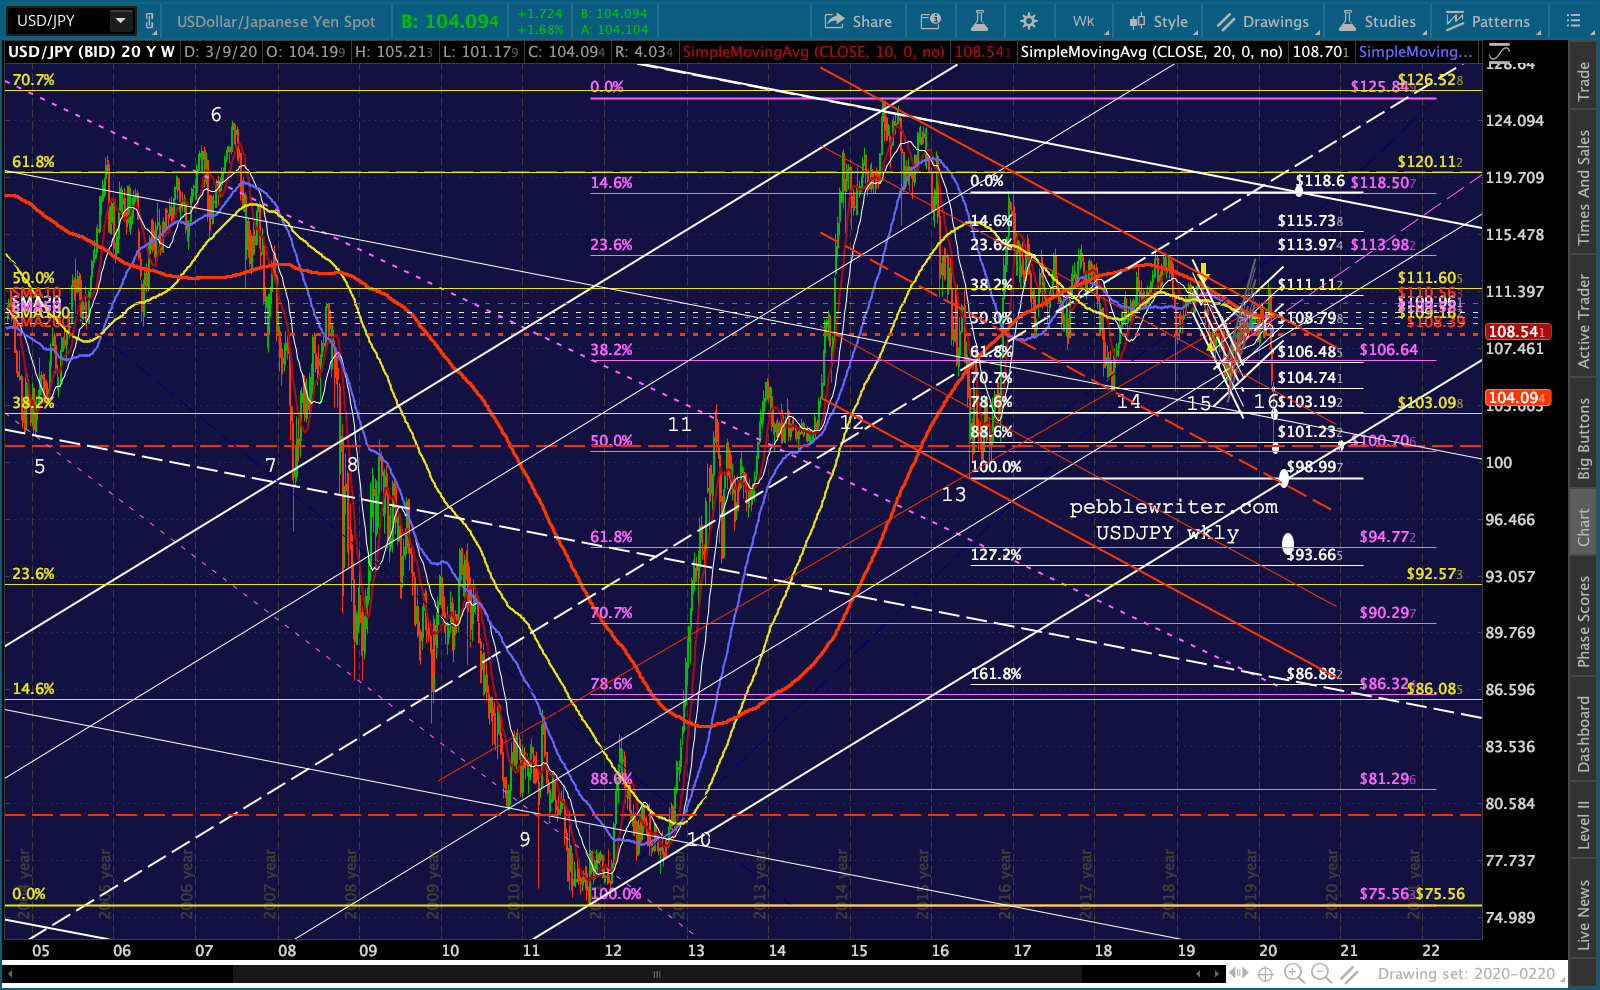
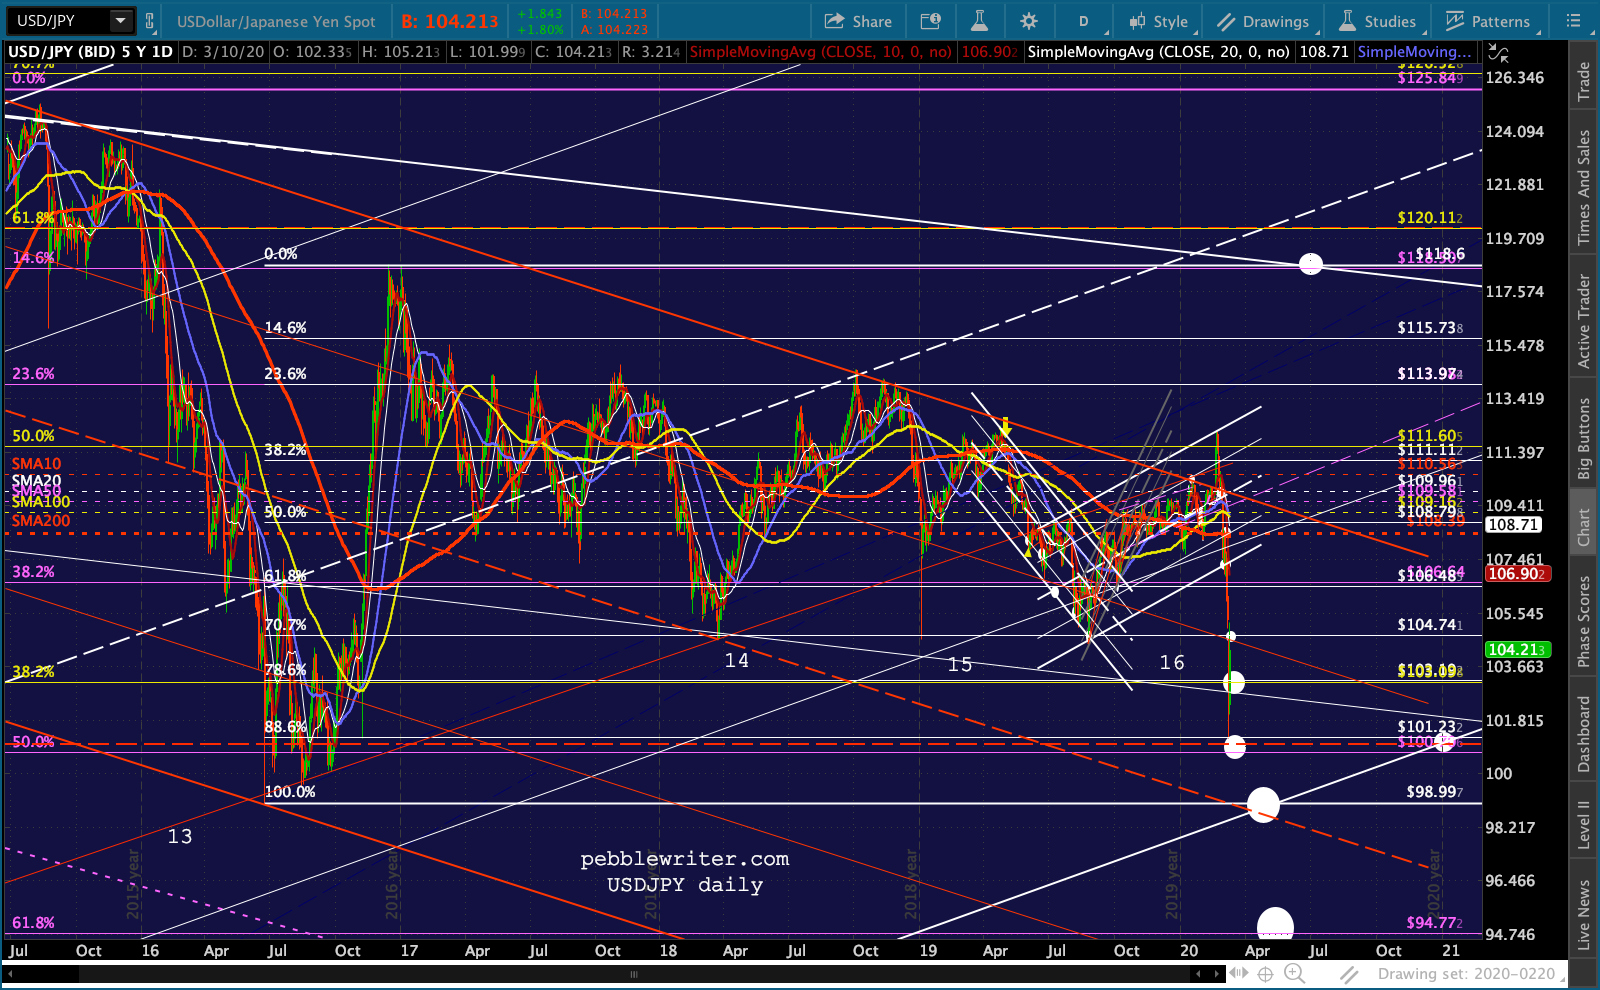 …but, the weekly chart shows more potential downside…
 …as does NKD.
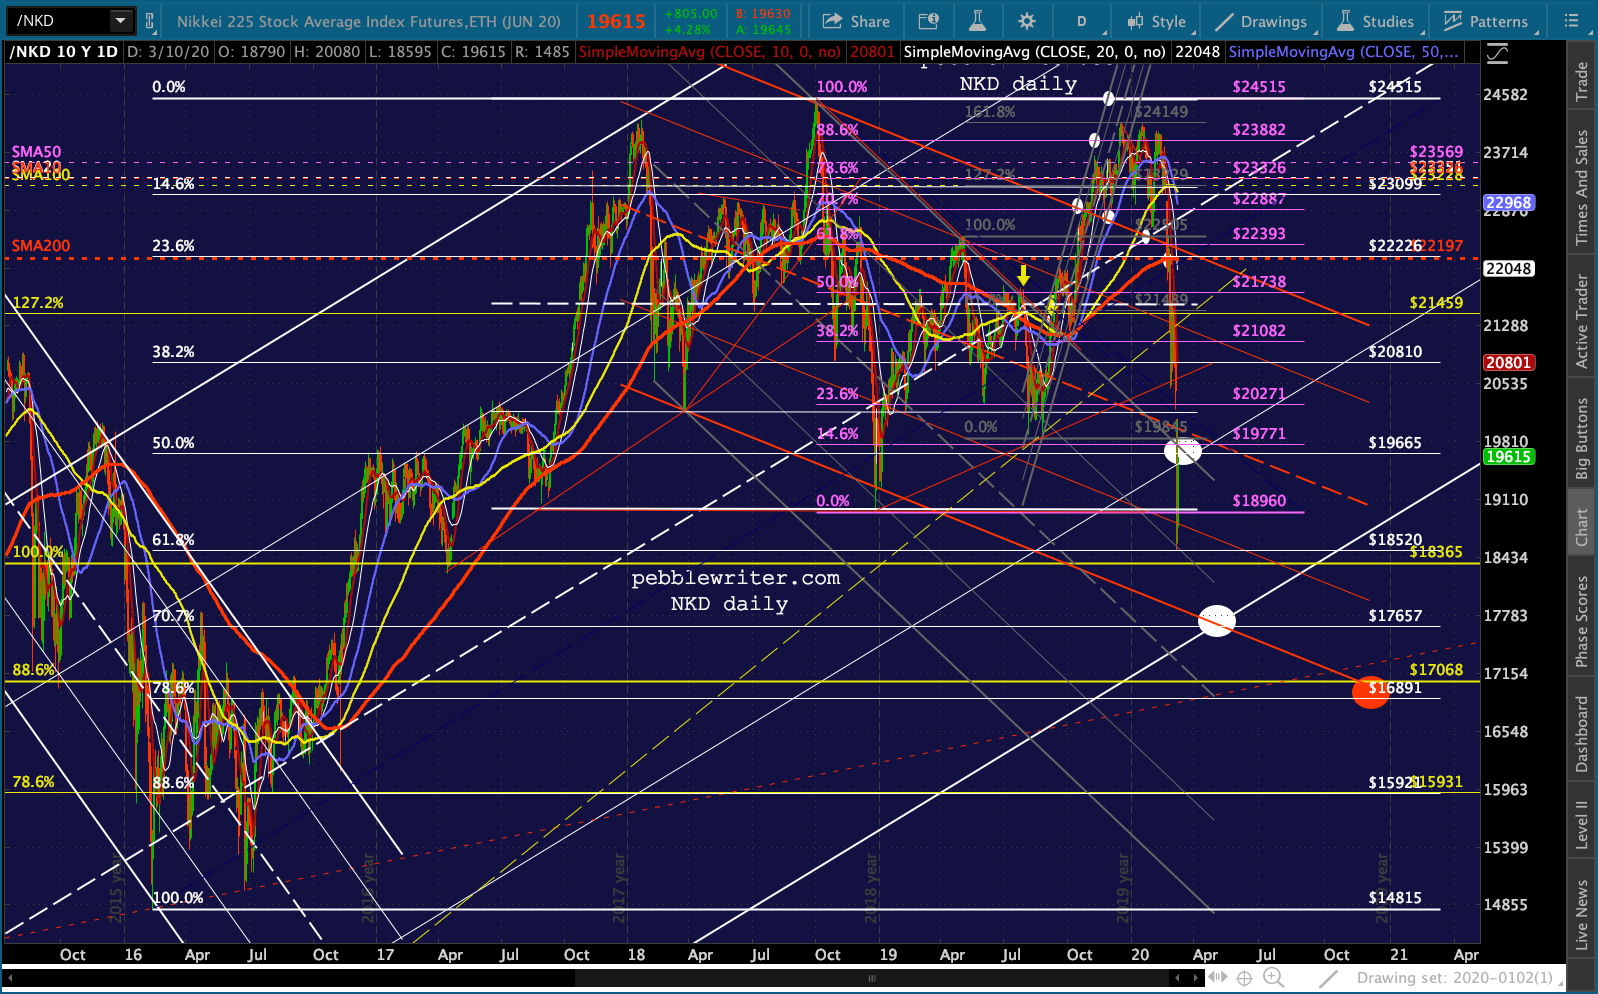 DXY has bounced, but is in the middle of nowhere…
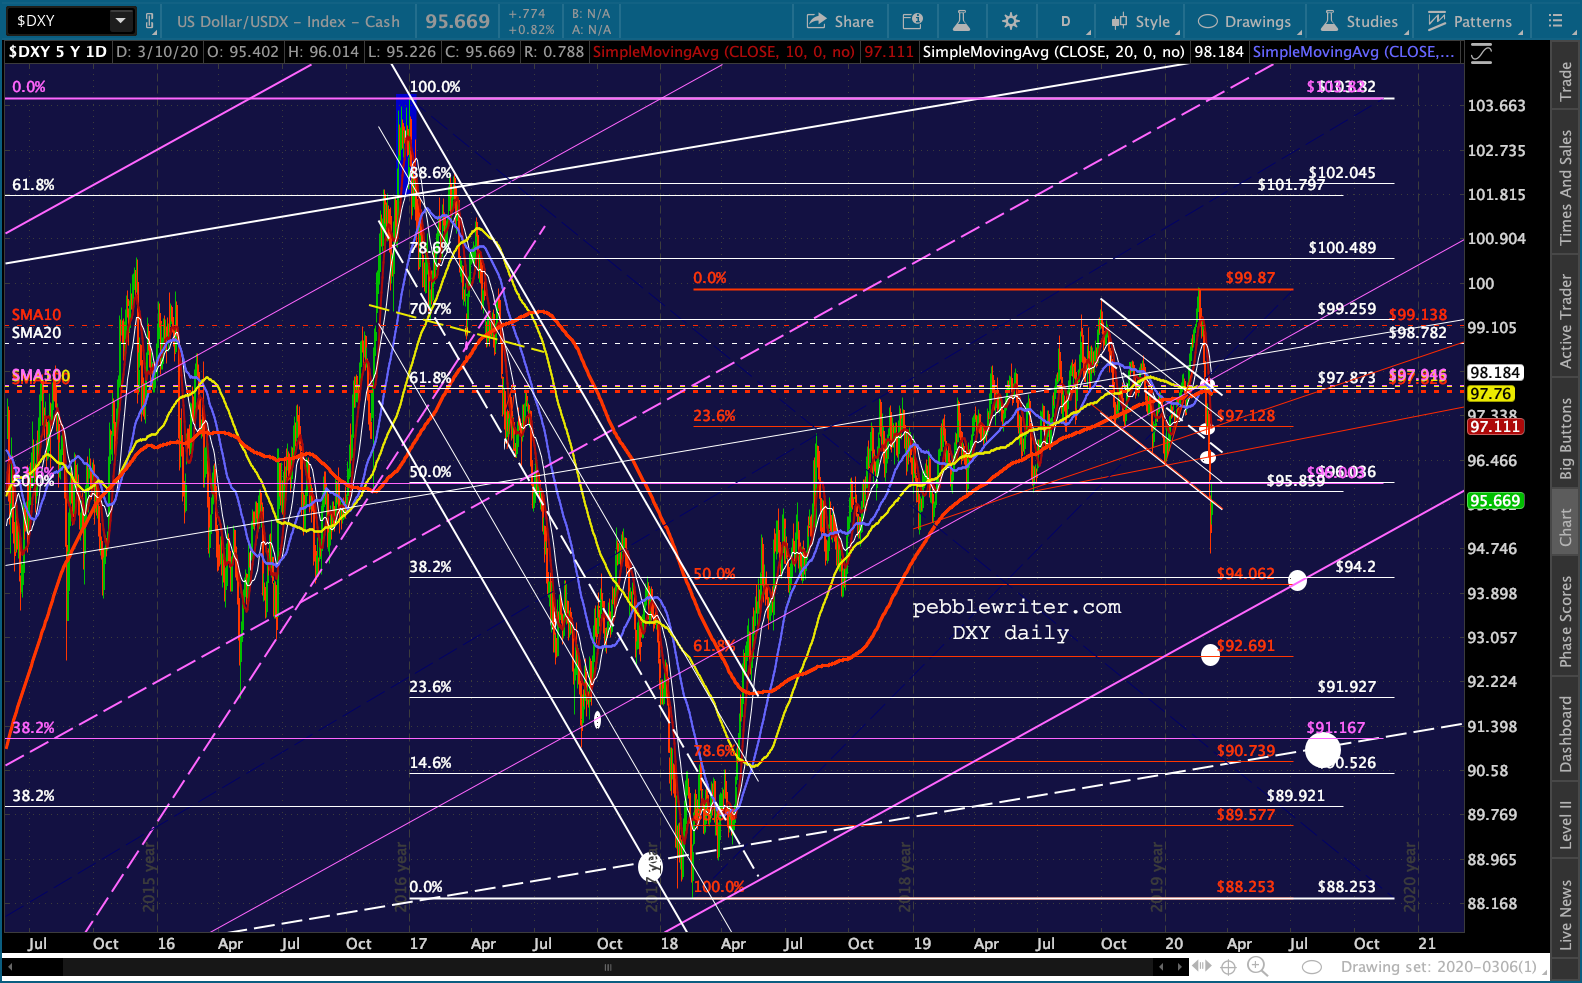 …largely because EURUSD pushed above strong overhead resistance.
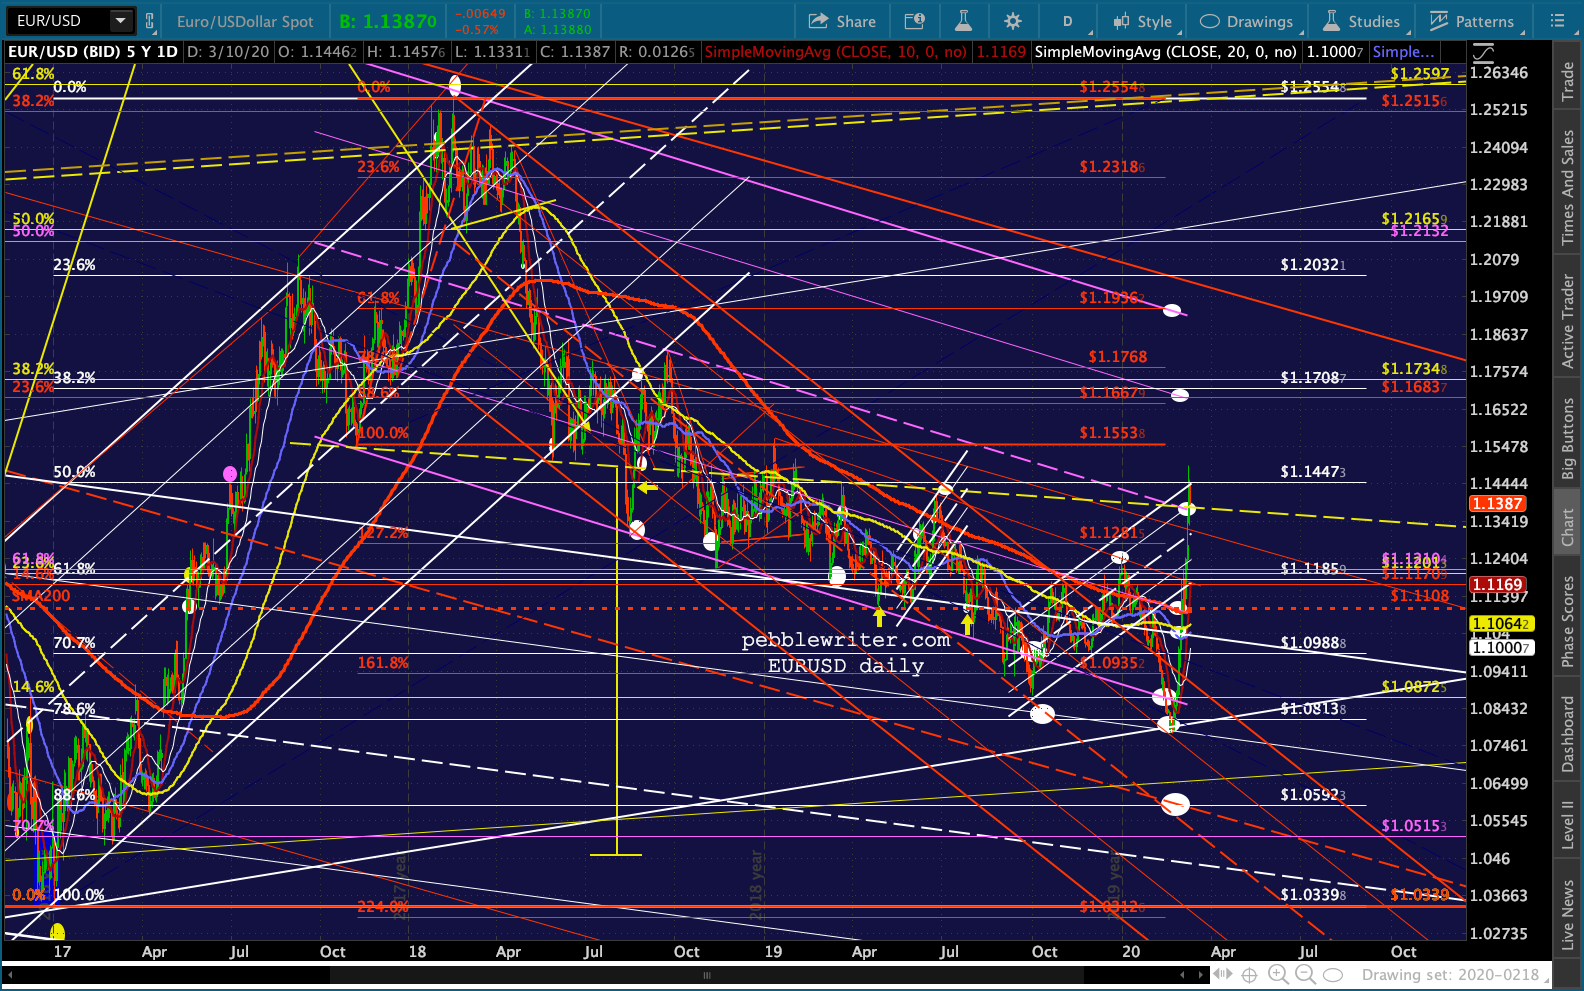 Although it has retreated, it has people wondering whether there’s more to come.
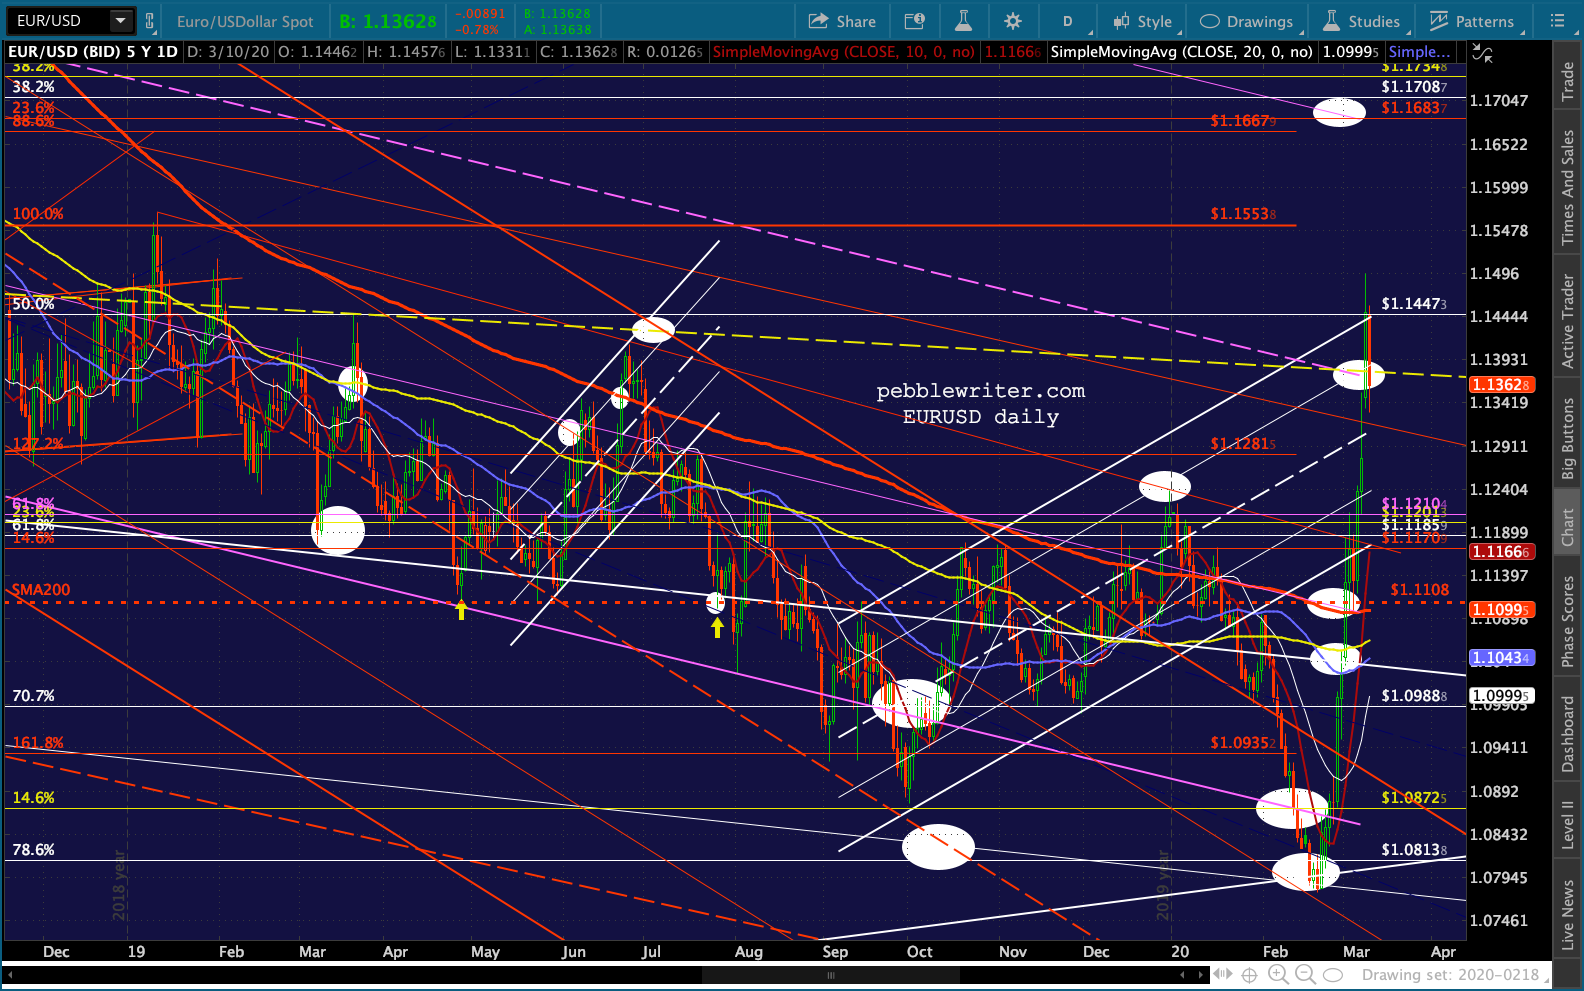 Gold is taking a hit today after coming within 4 of our IH&S target. But, it’s also true that it got ahead of its rising white channel and might just be biding its time.
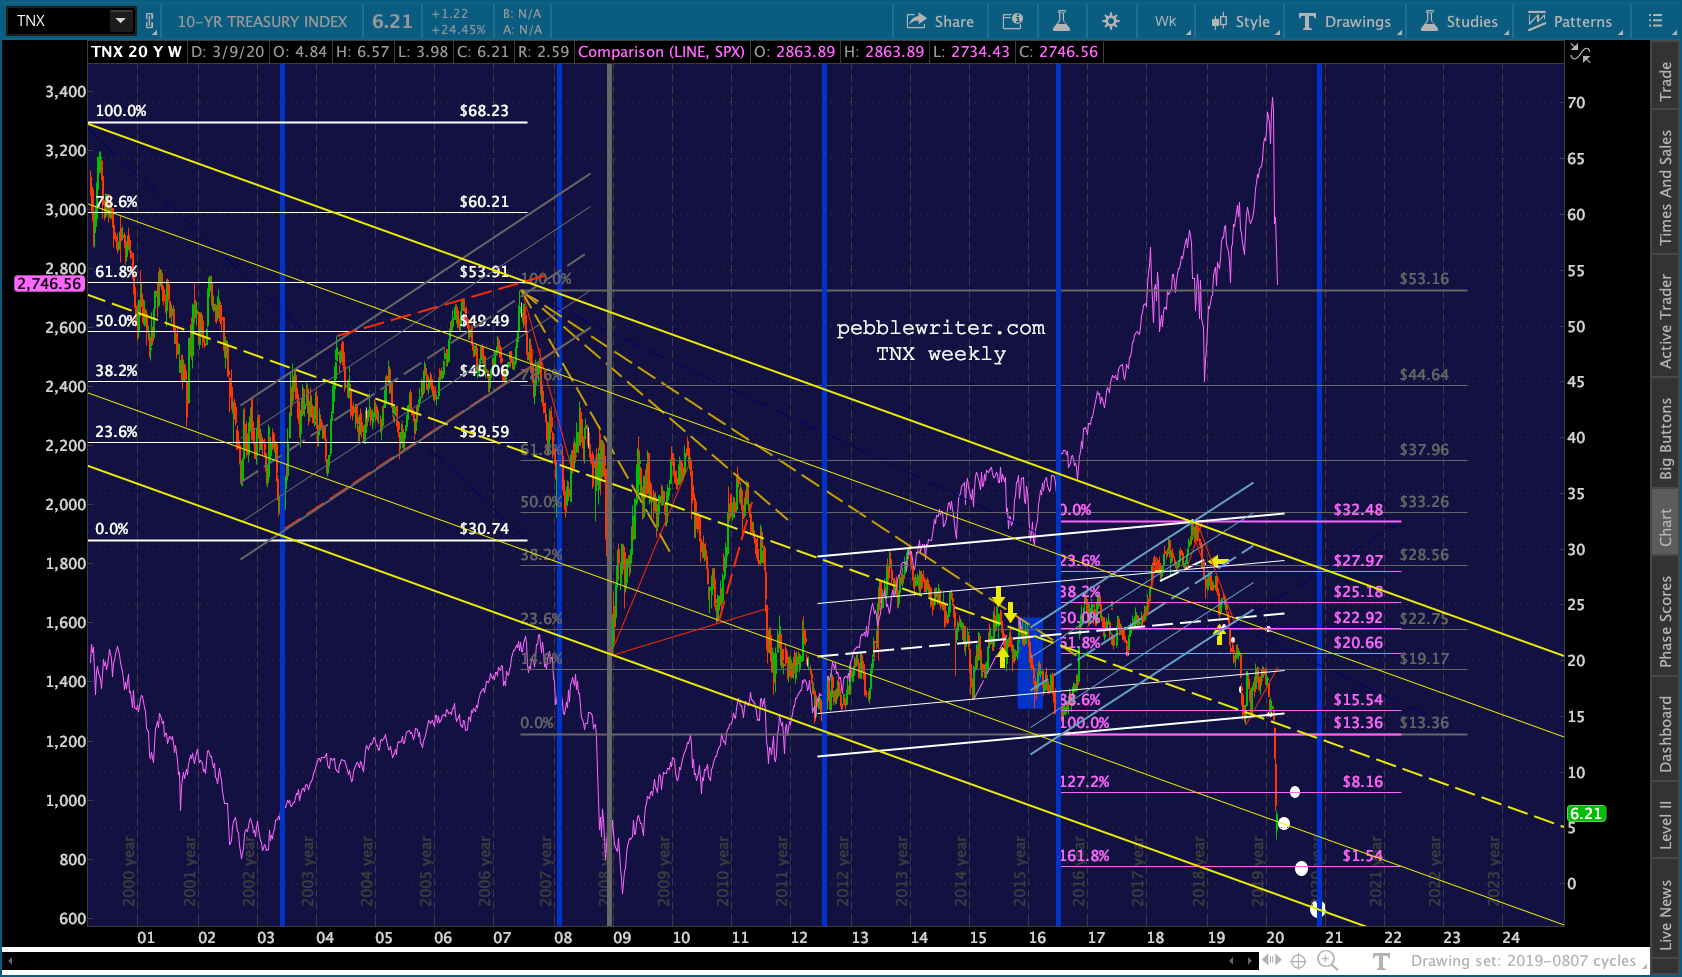
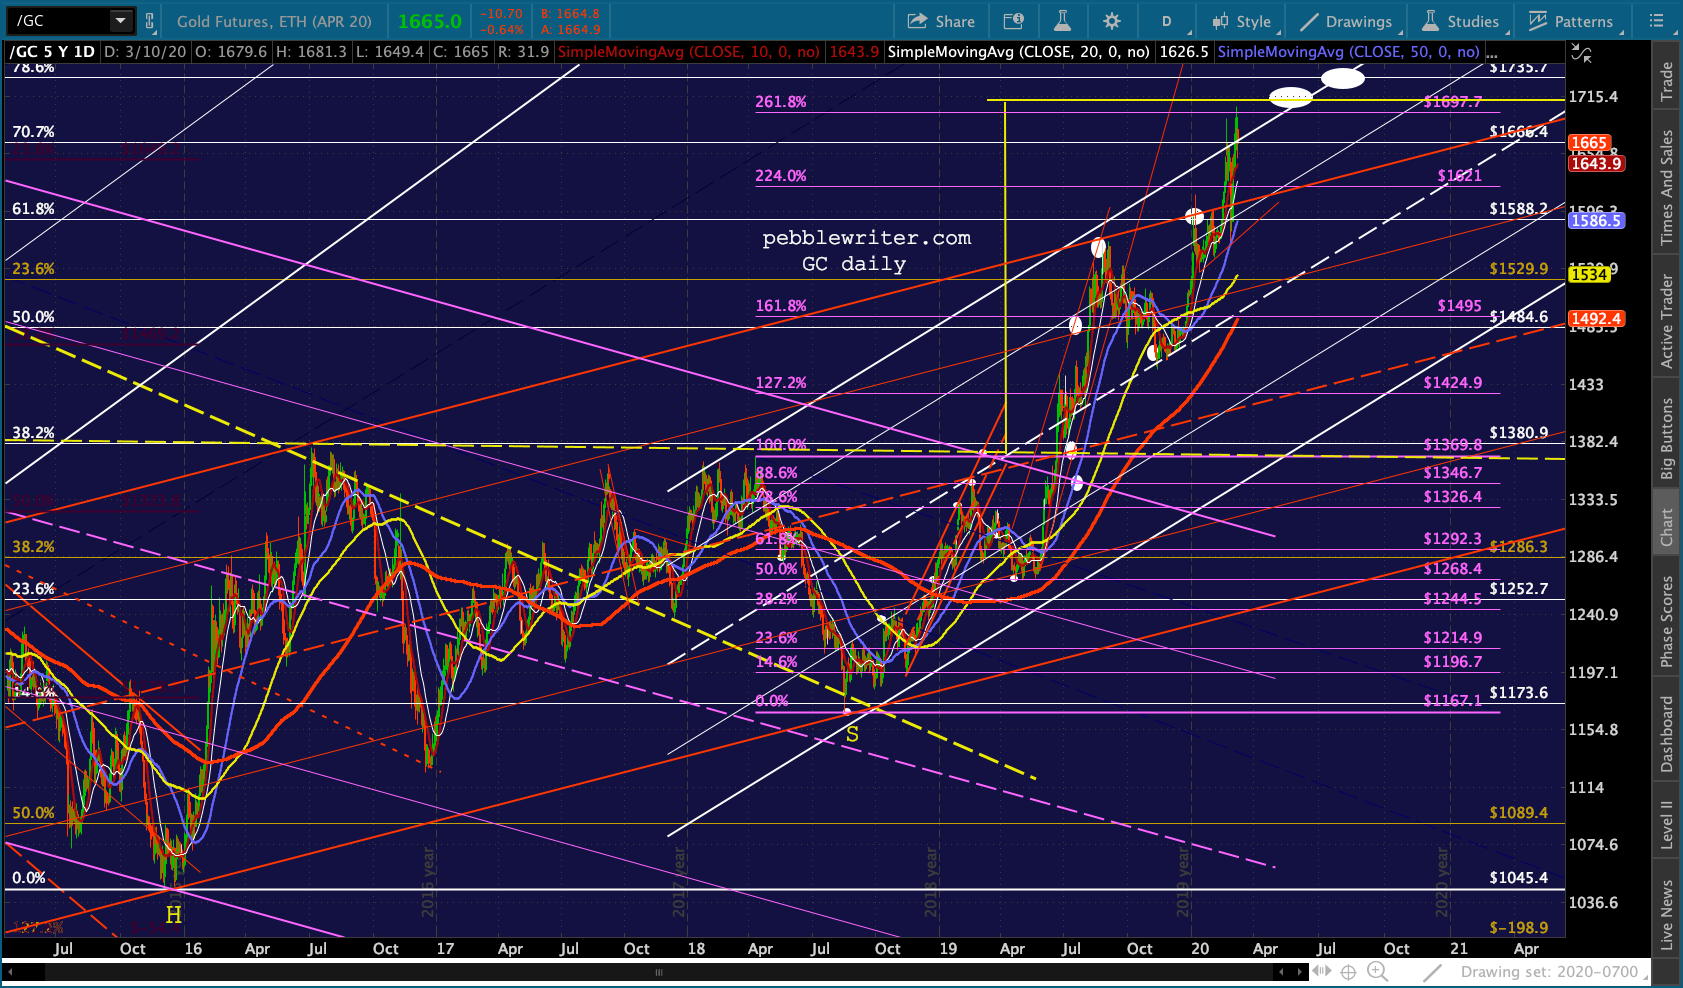 Bonds are ambivalent. Though there is more potential downside in yields for the 10Y, we’ve had big bounces off this .236 channel line before and should again.
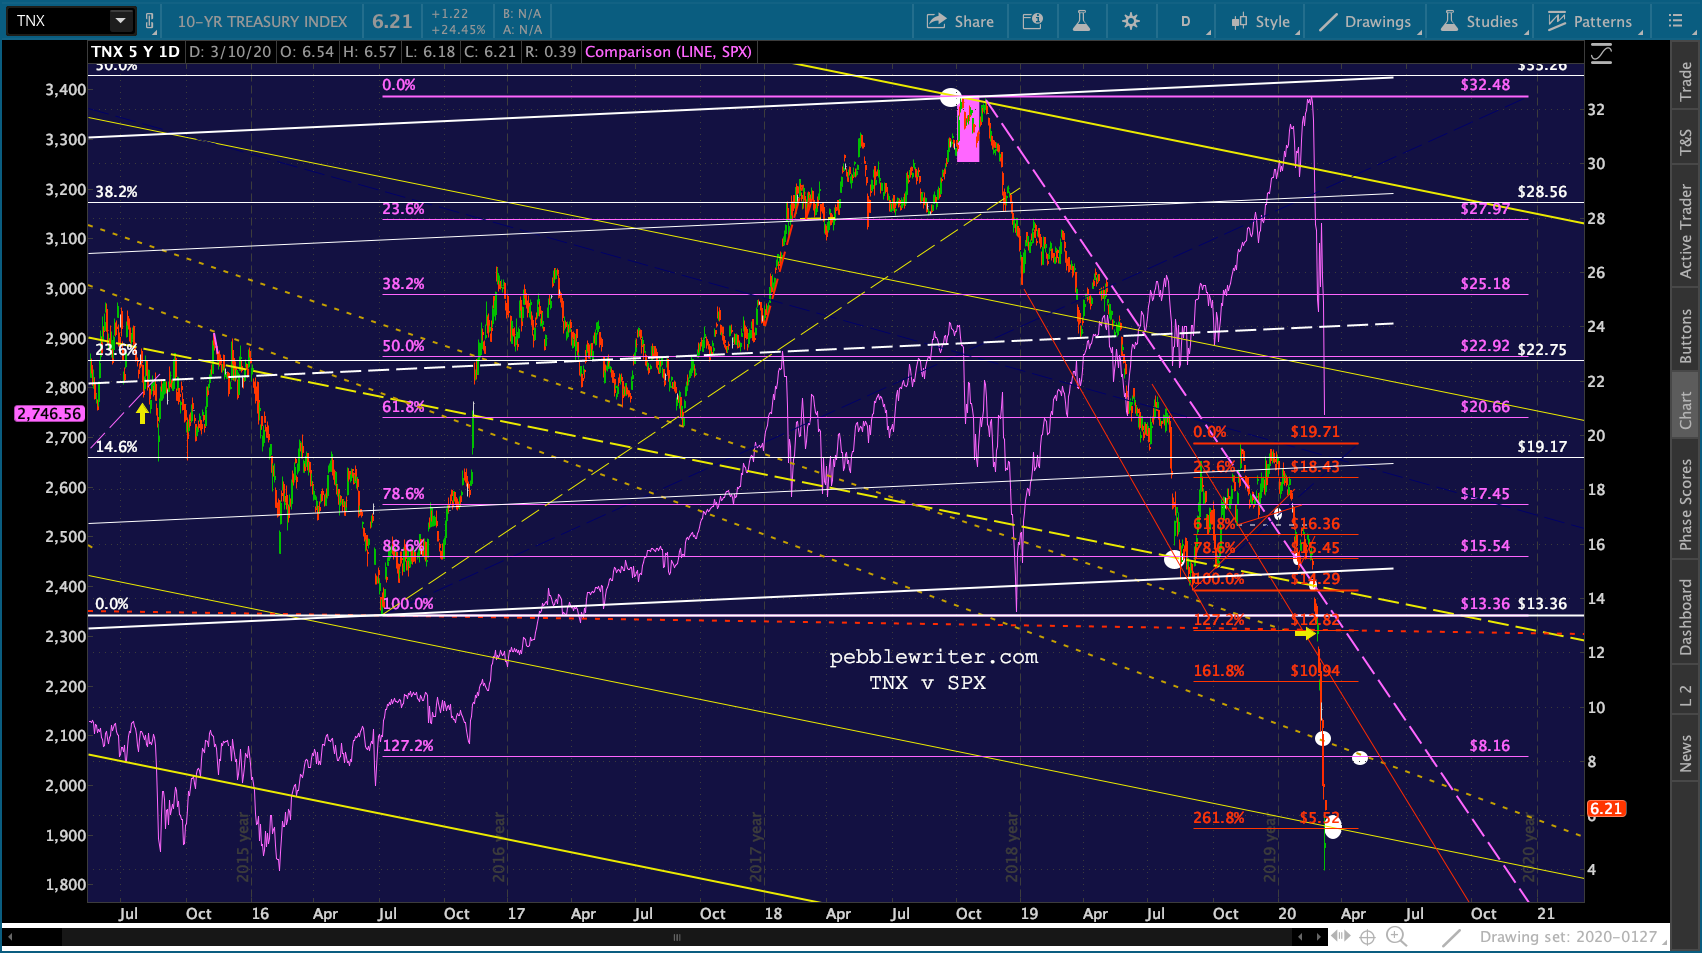
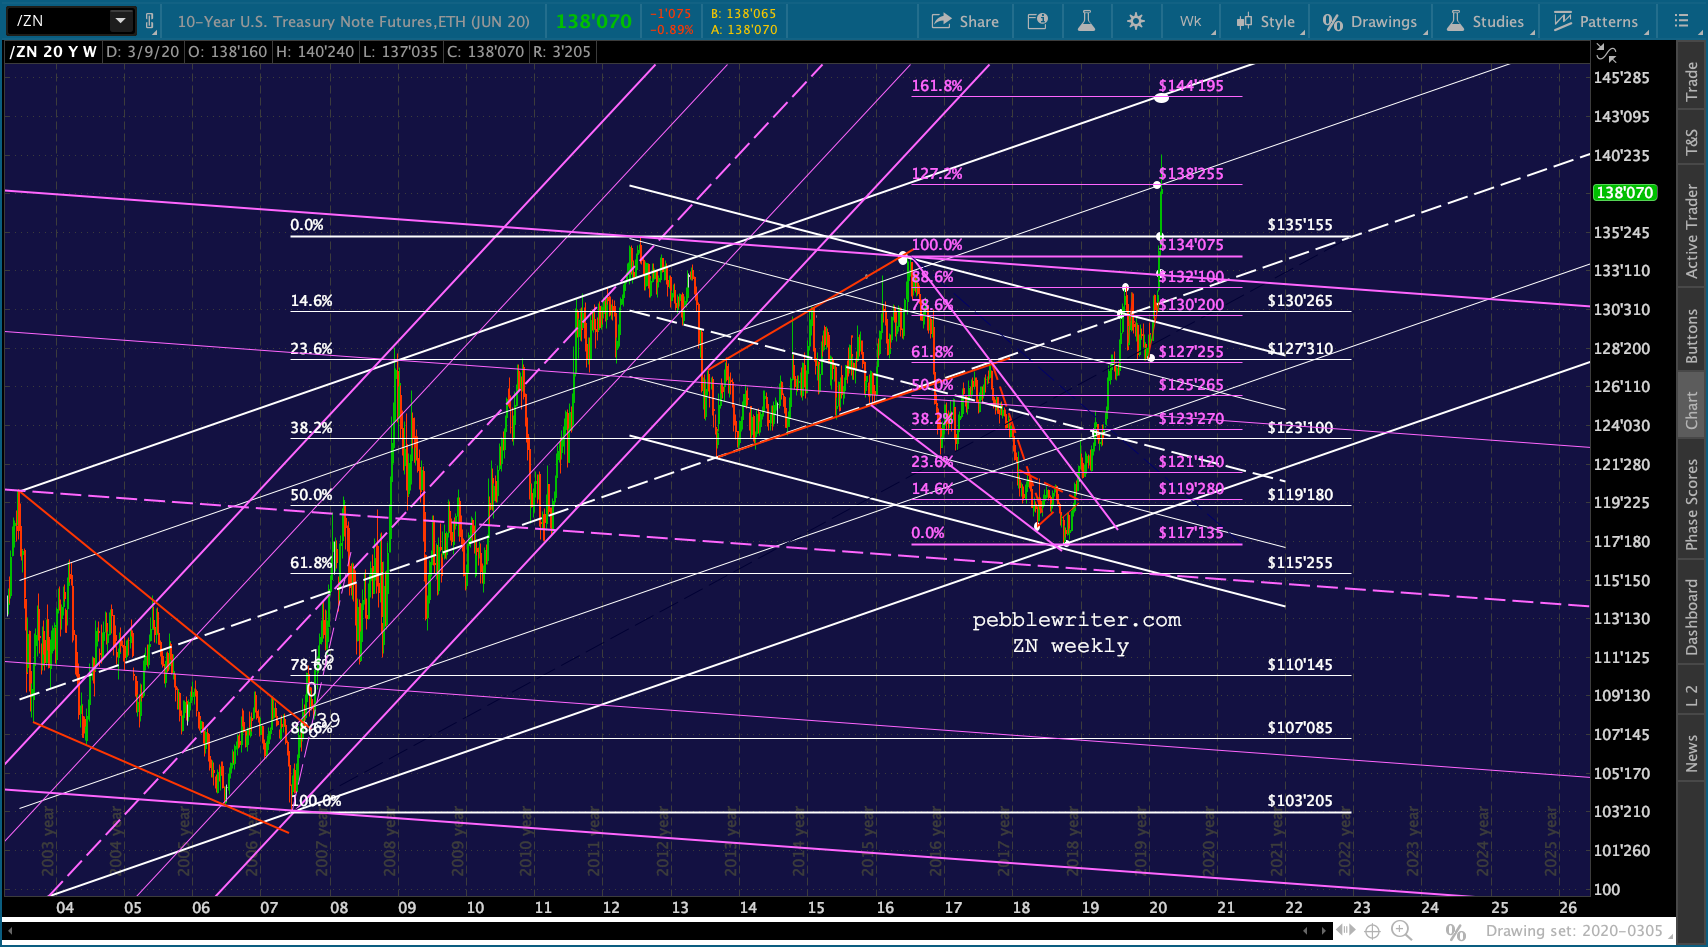
 ZN has pulled back from the 1.272 and channel line on the weekly chart, meaning it might need to consolidate some more before a potential push up to 144’195.
 The 2Y clearly has more downside potential…
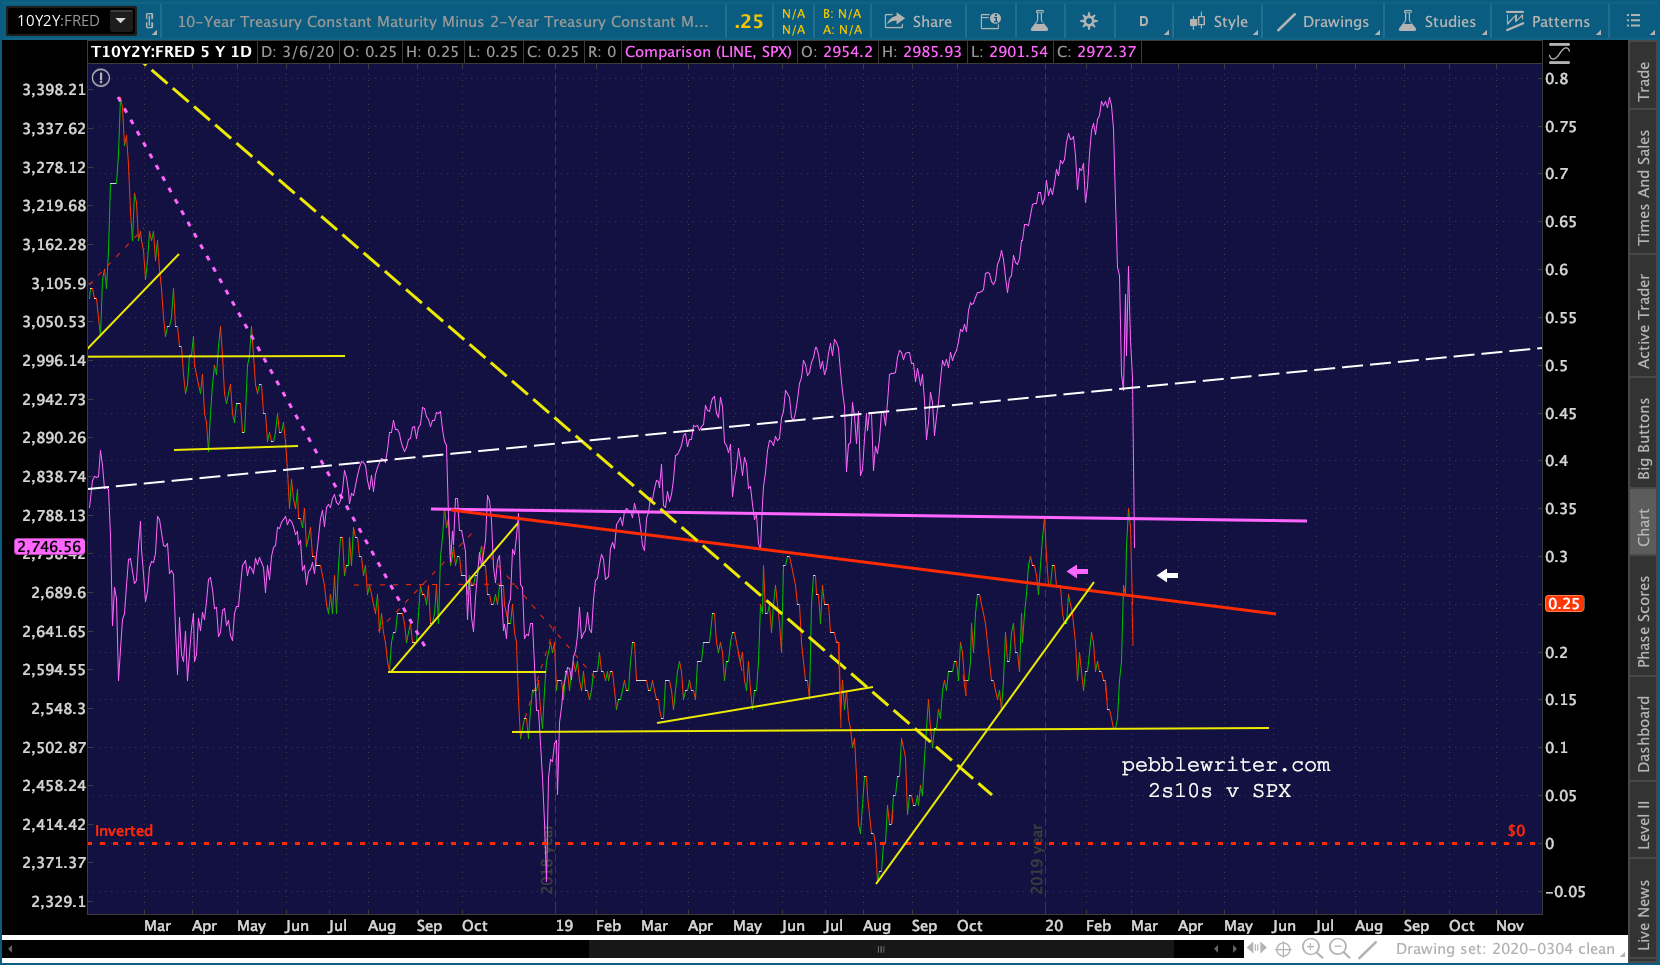
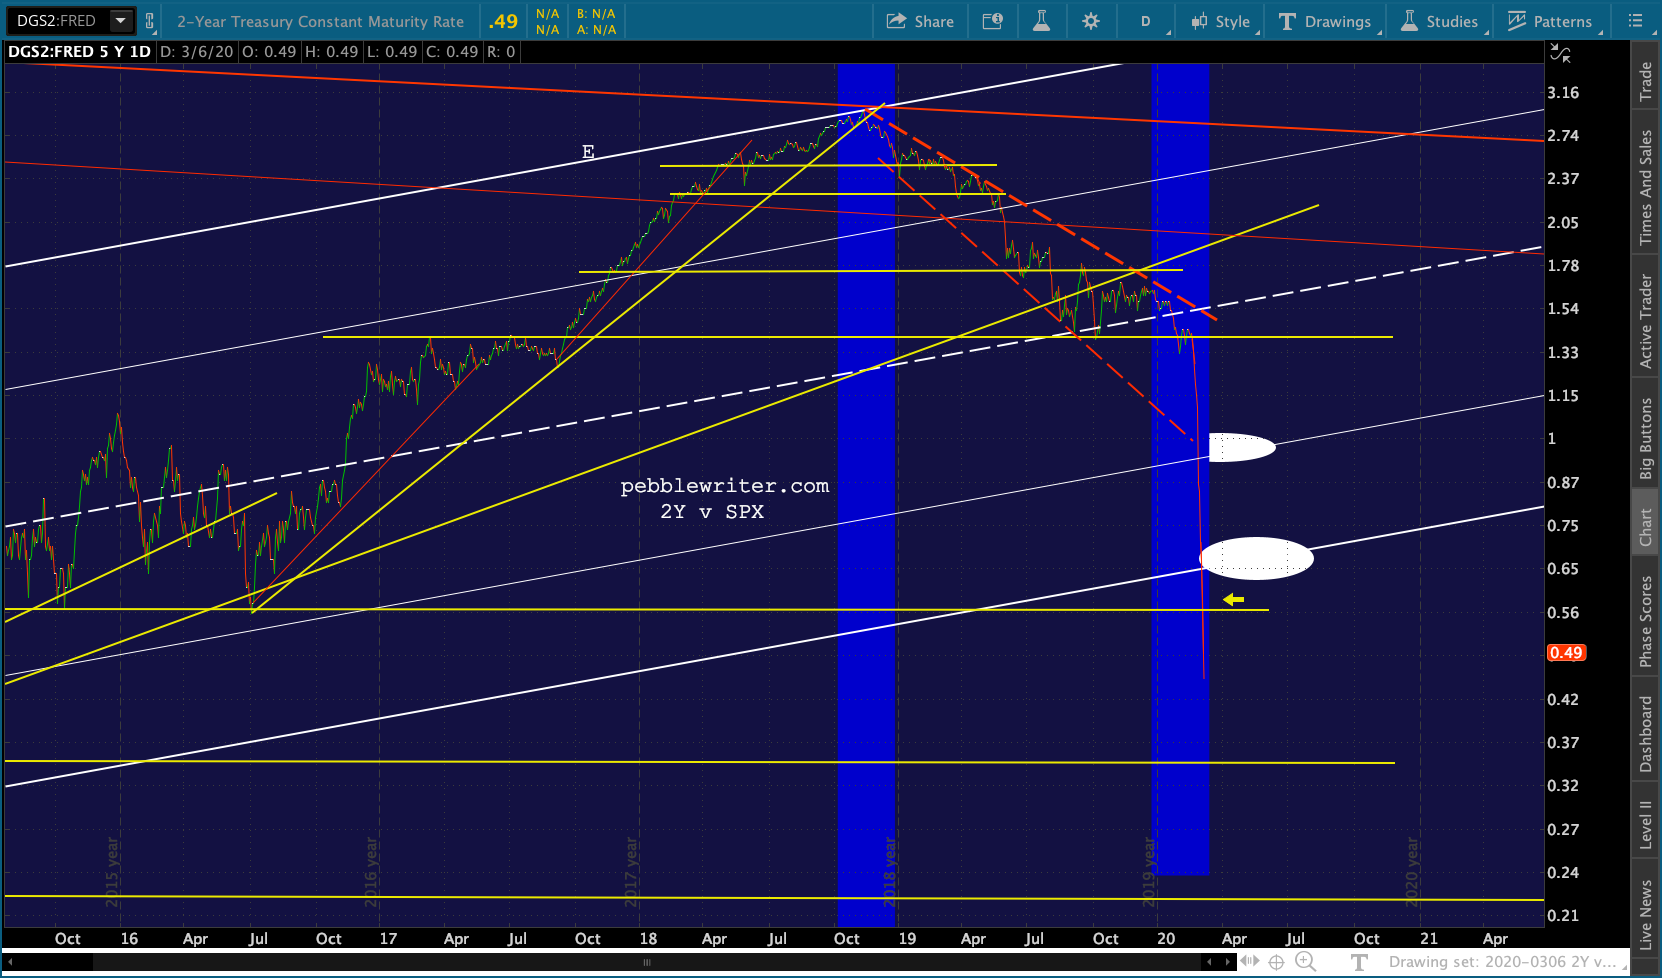 …but, the 2s10s is in the safety zone of not breaking out or down.
 UPDATE: 10:58 AM
Moment of truth for ES… 2699 ought to yield 2703.62 for SPX.