With the Greek vote coming back a resounding “no,” the burden is on The Powers That Be to prove to the rest of the financial world that a Grexit is a non-event. And, that’s exactly the way the “markets” are shaking out thus far.
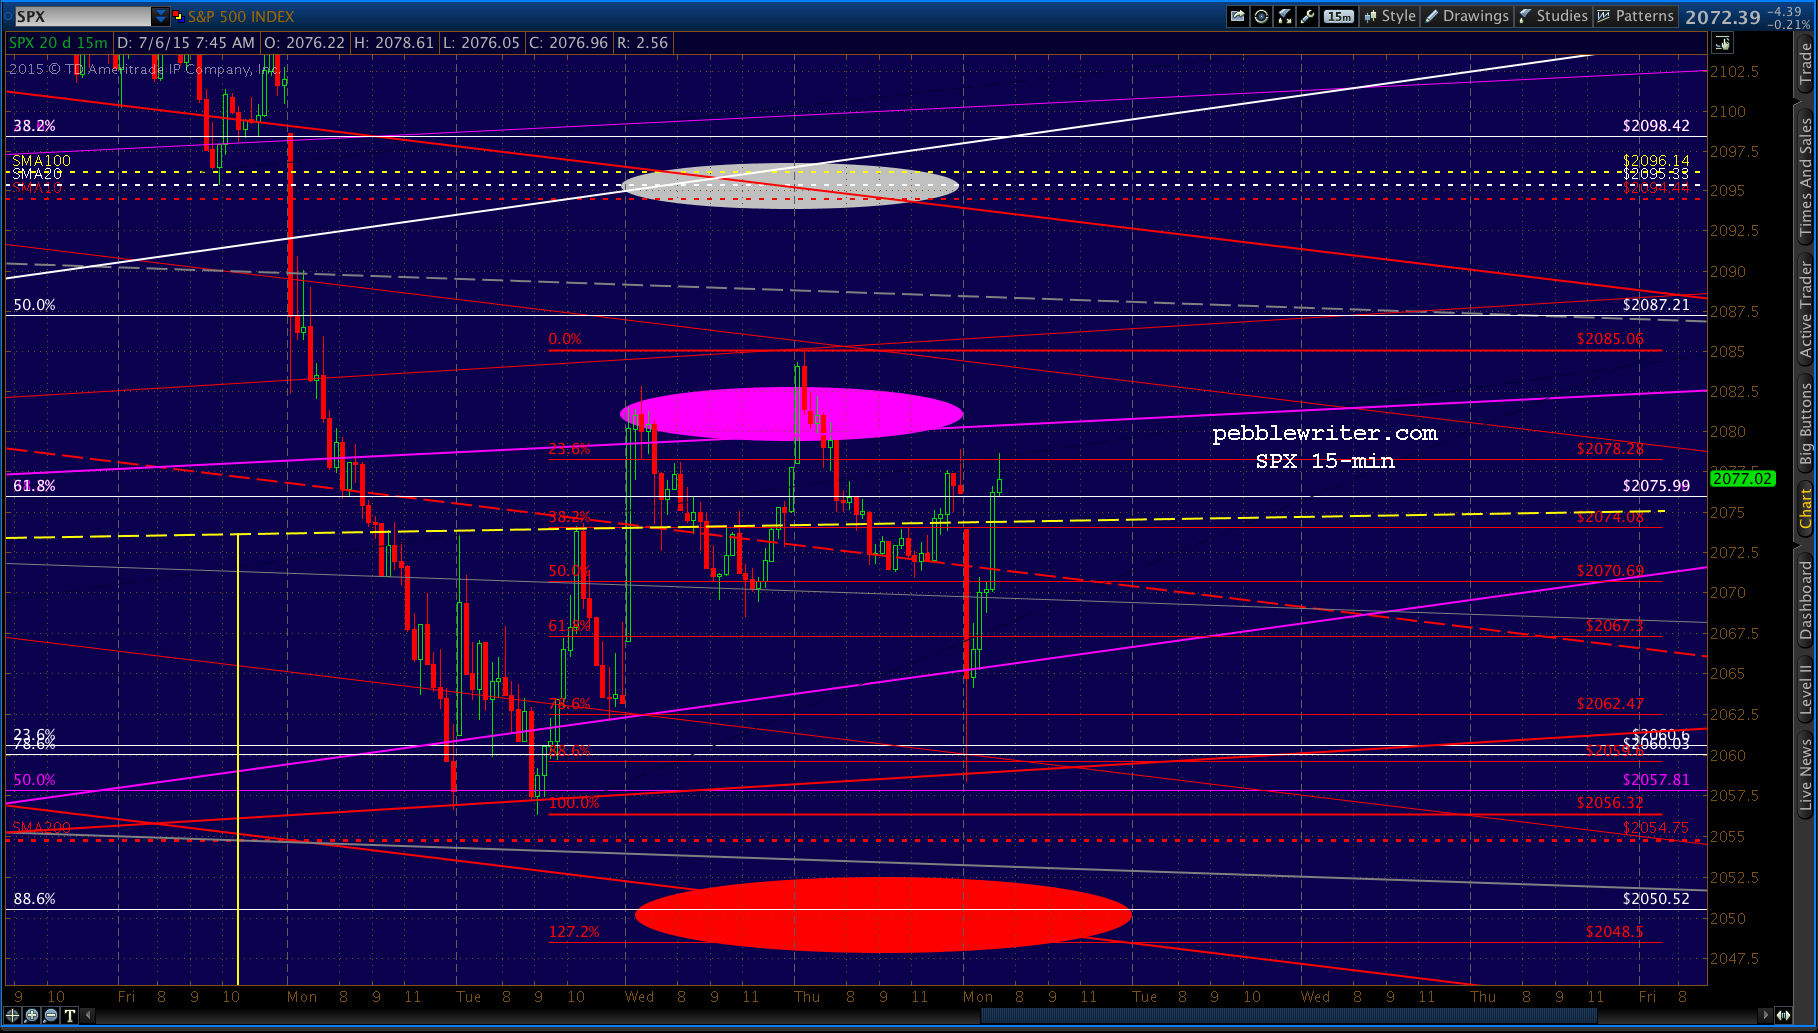
Thursday, SPX reached our bounce target from last Monday [see: All That Matters]…
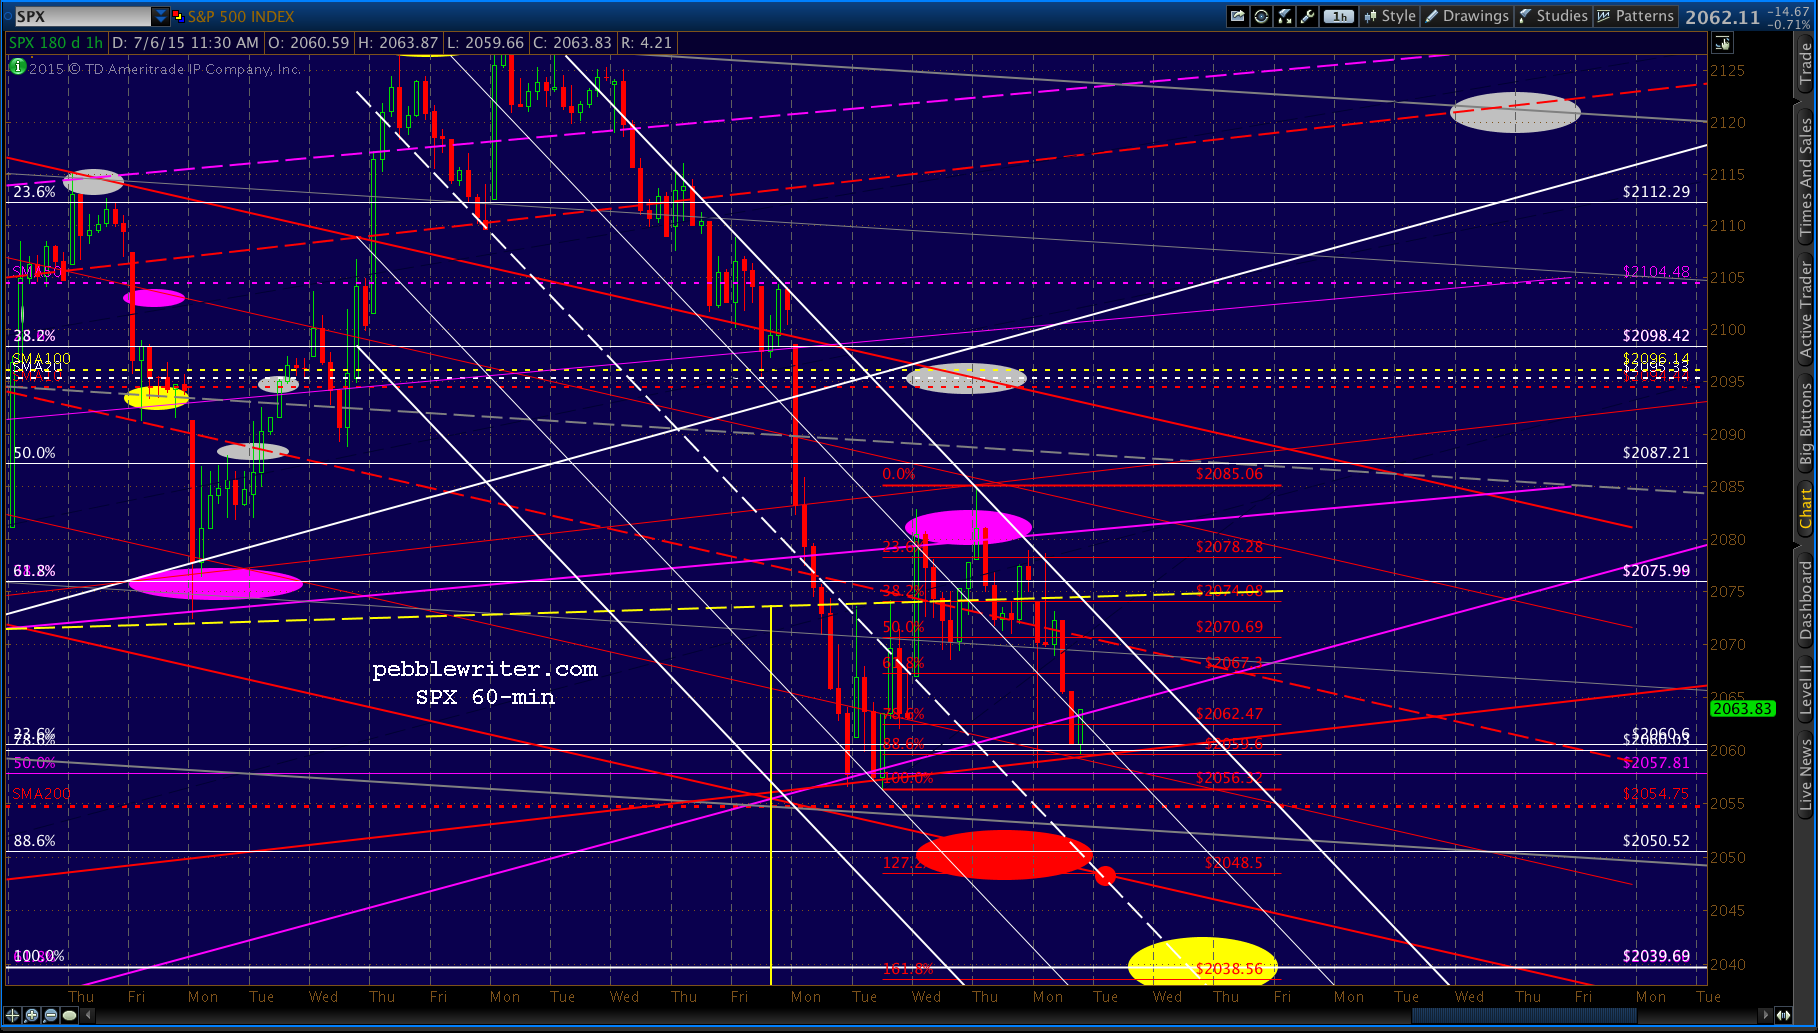
…the charts suggest that the bounce could easily reach 2072 (the red channel midline) or, with a little more effort, 2081 (a backtest of the broken purple channel bottom.)
…and, even managed to close below Thursday’s short call [see: Greece Fixed Yet Again] at 2081.51.
SPX just tagged the purple target, backtesting the purple channel at 2081.51. I’d look to be short here with reasonably tight stops to protect against headline risk from “you know who.”
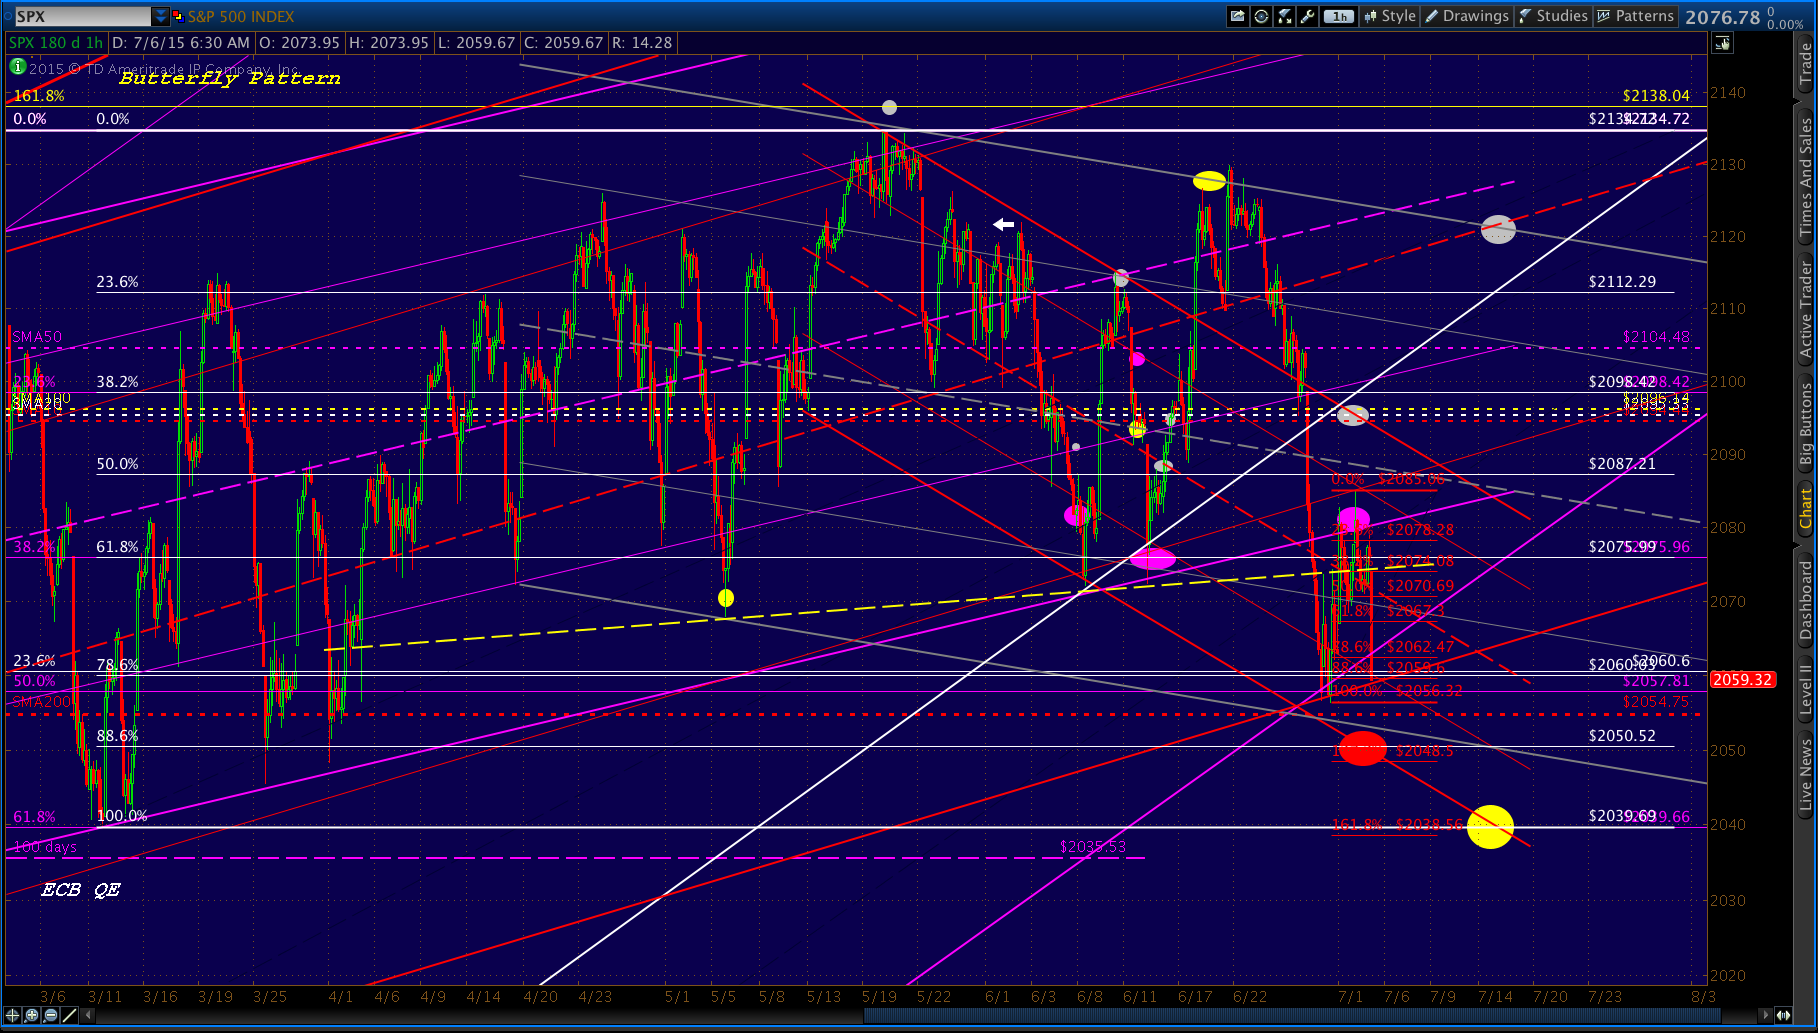
The S&P futures were permitted to drop to the SMA200 in the opening minutes of Sunday’s trading — nailing our downside target from last week. Note the gap has almost been closed already.
 Likewise, the currency pairs all dropped to a fairly sturdy support point and promptly rebounded.
continued for members…
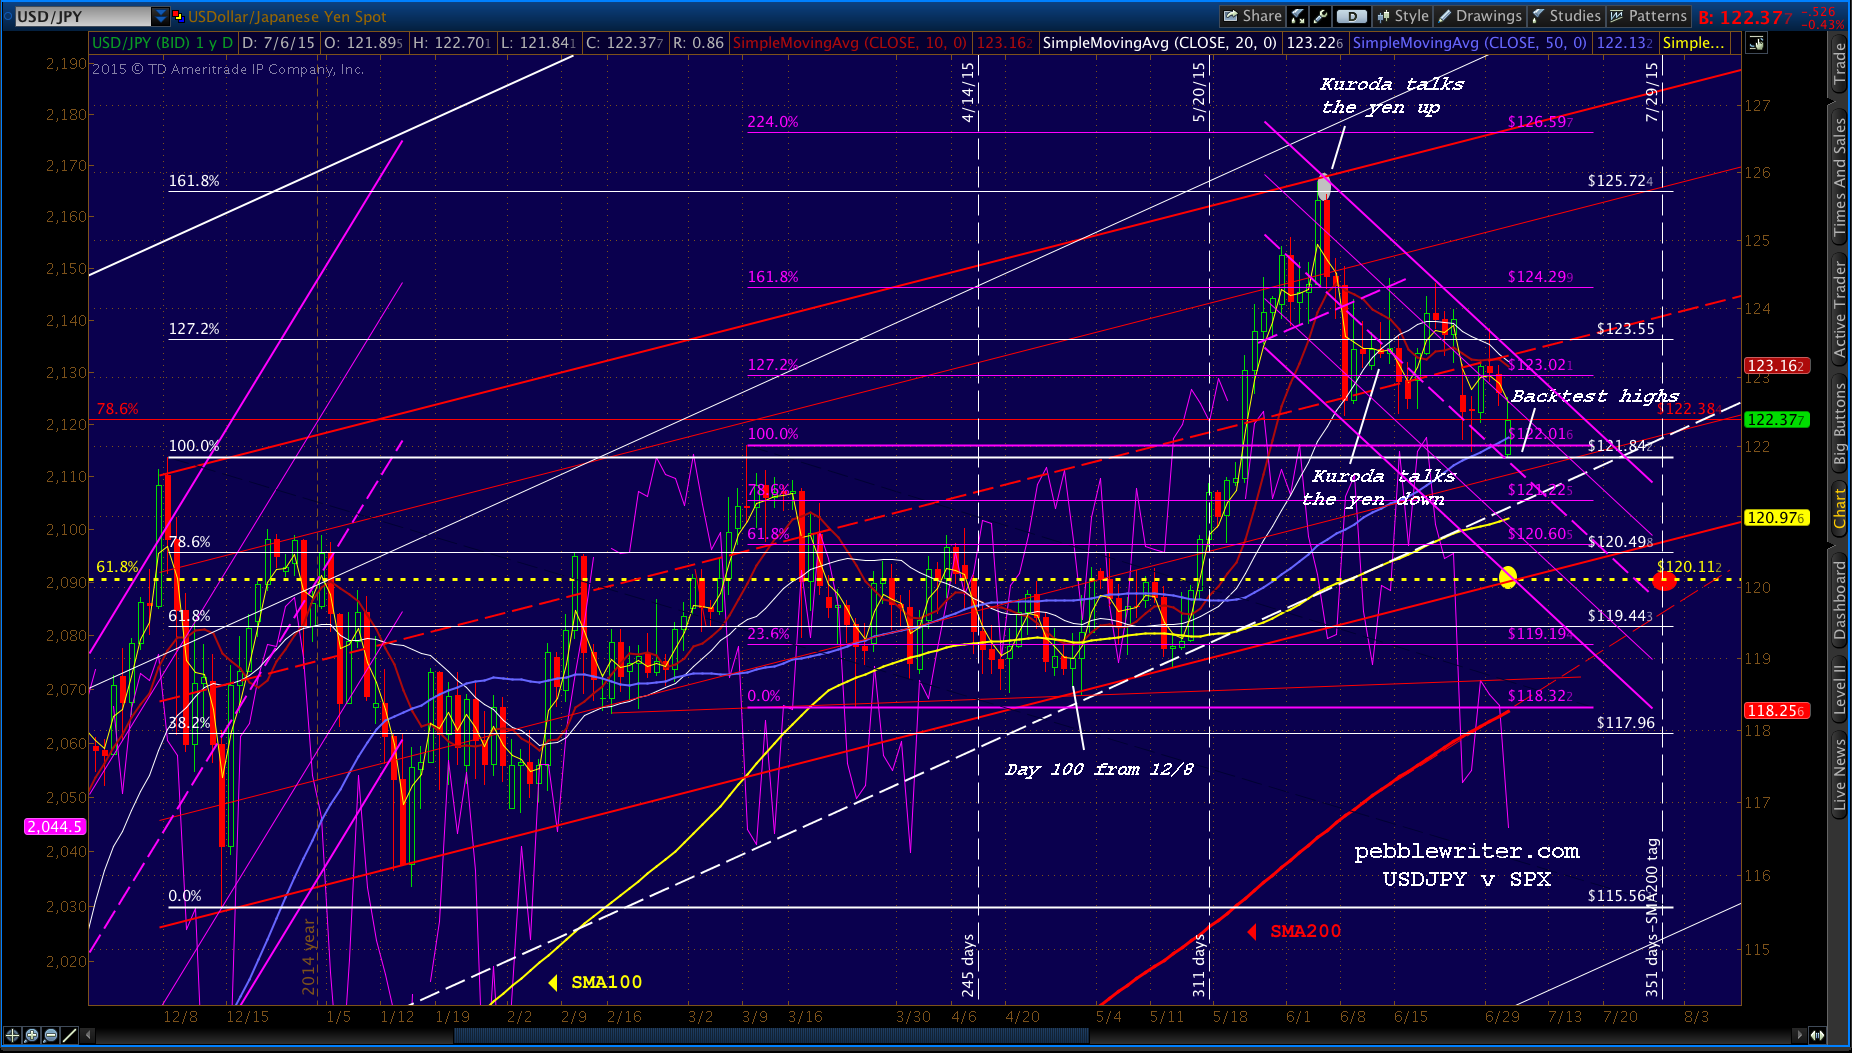
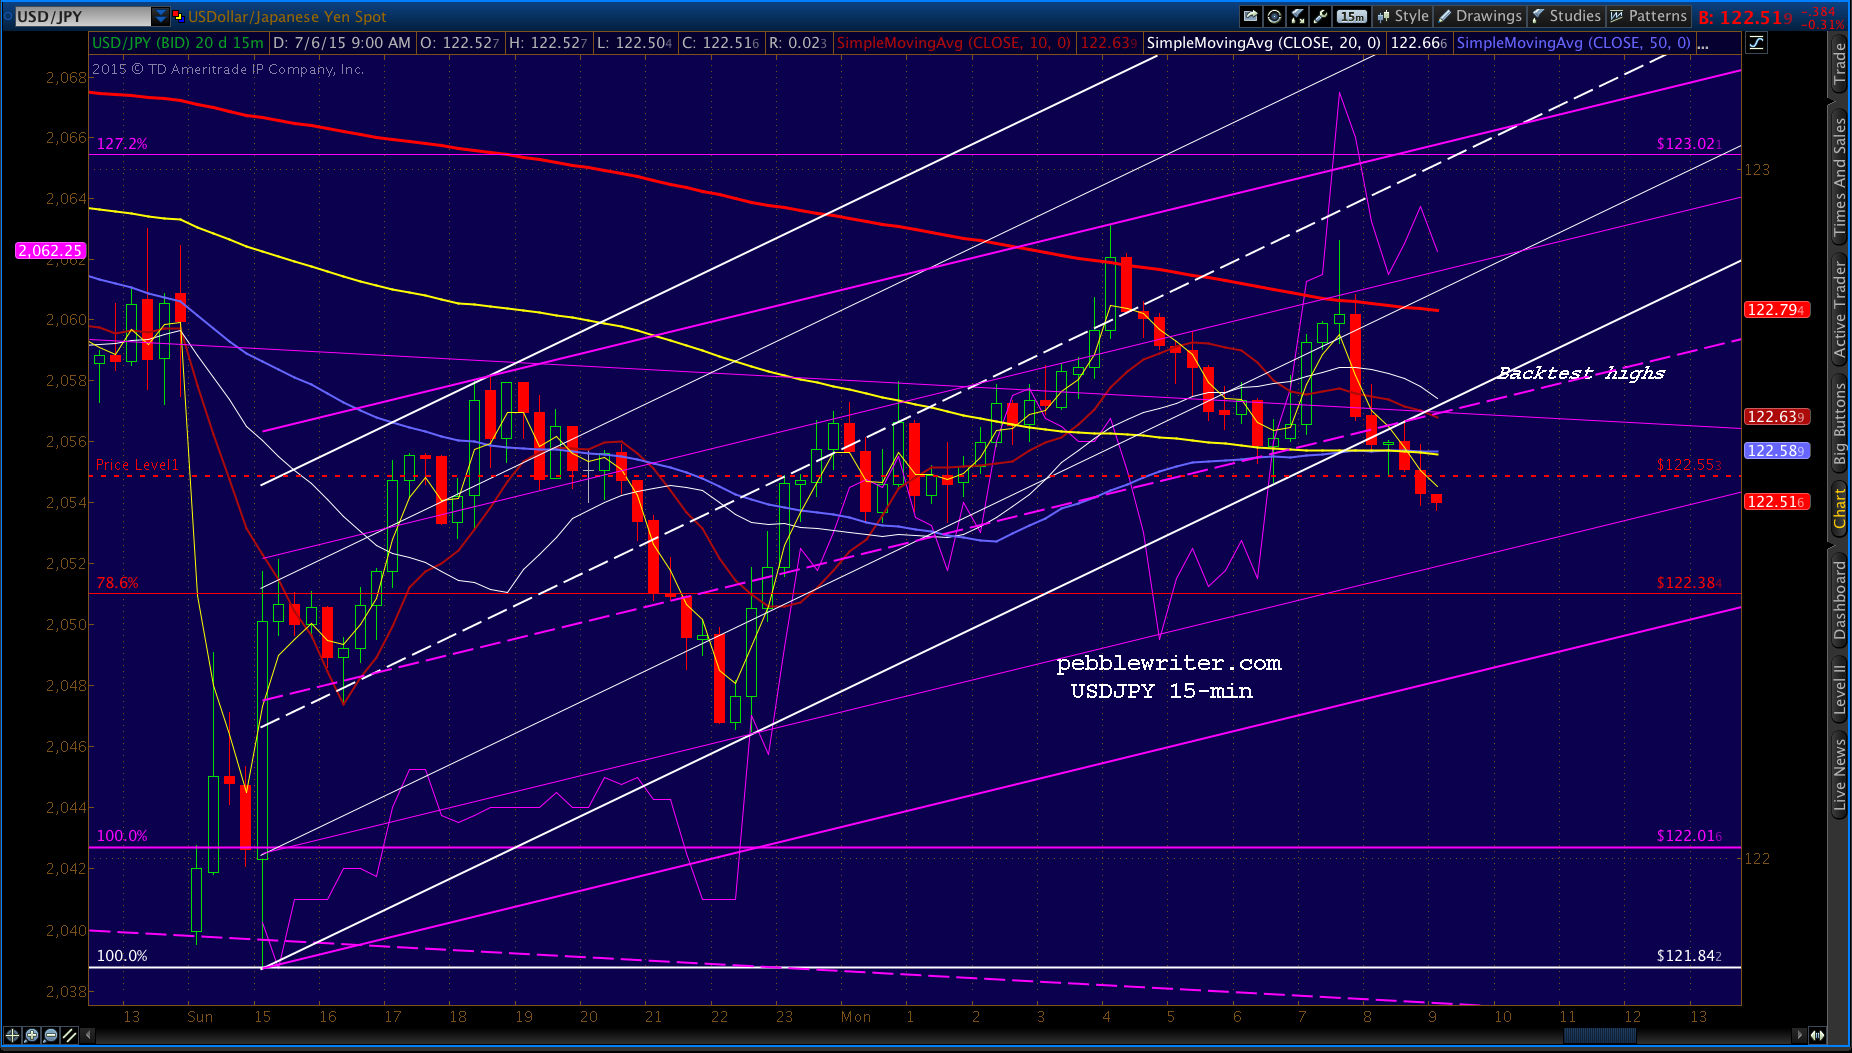
The EURUSD backtested the rising purple channel .236 line…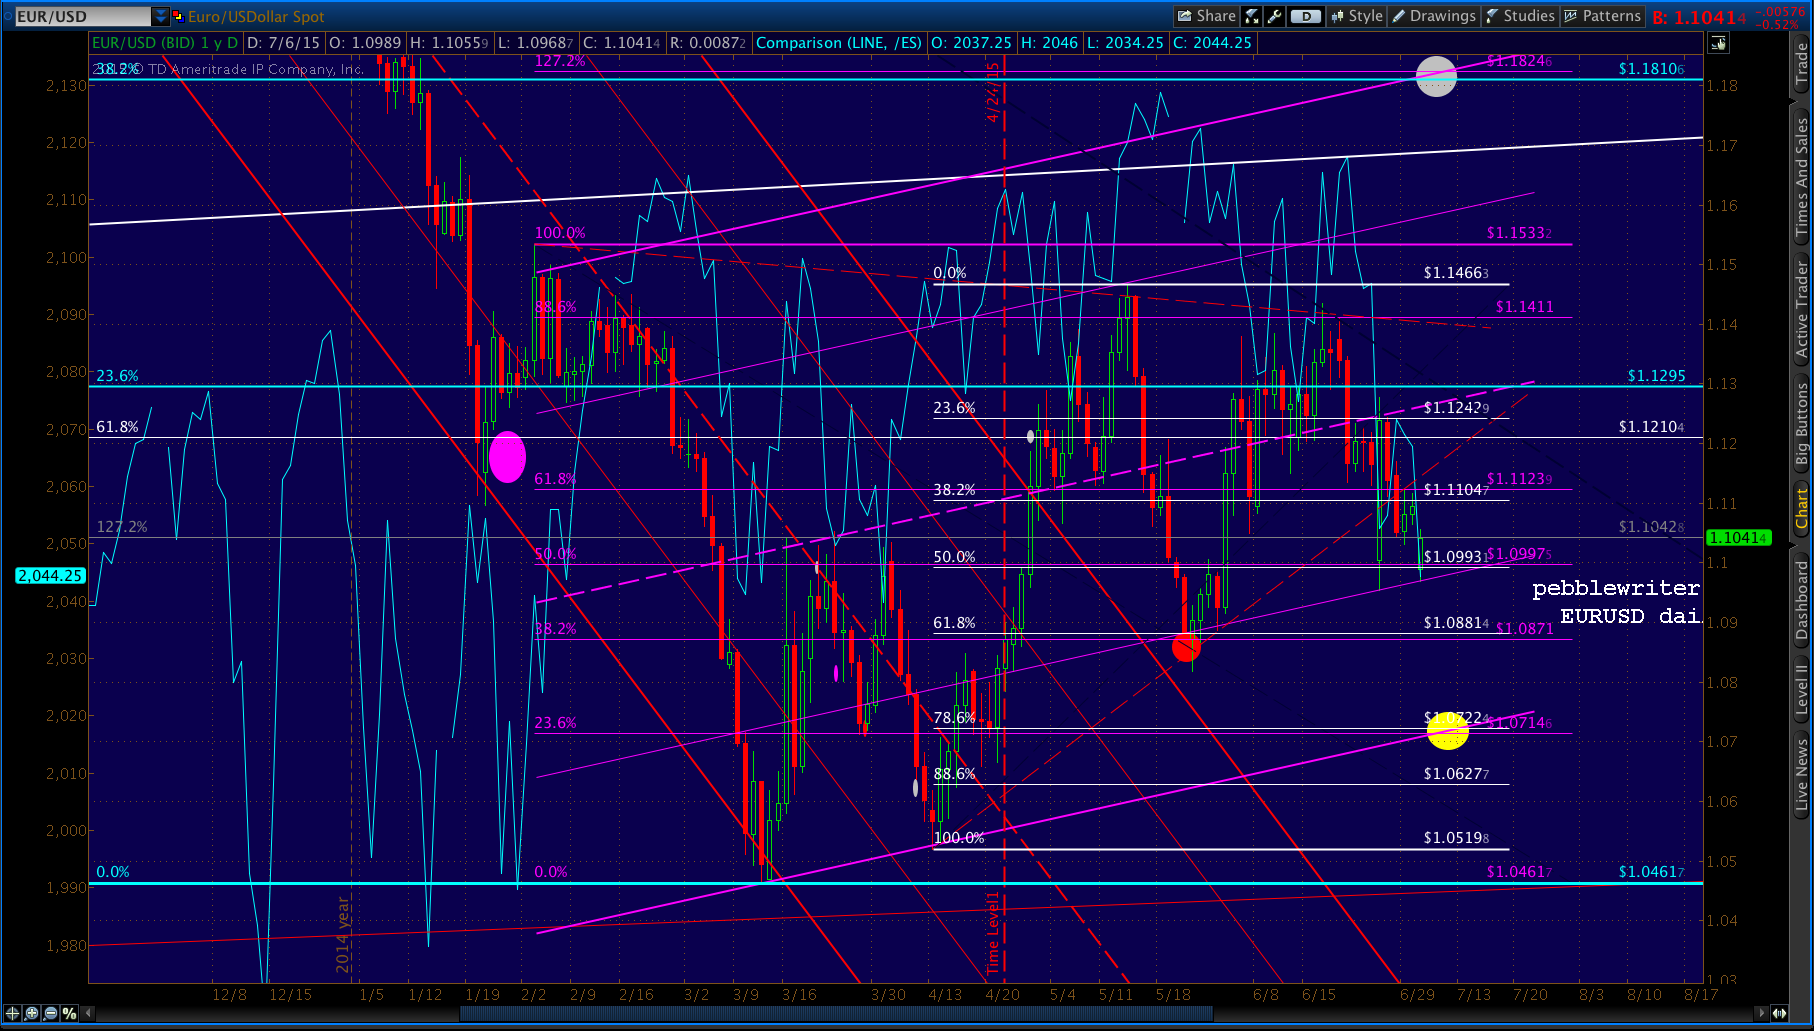 …while the USDJPY backtested its previous highs.
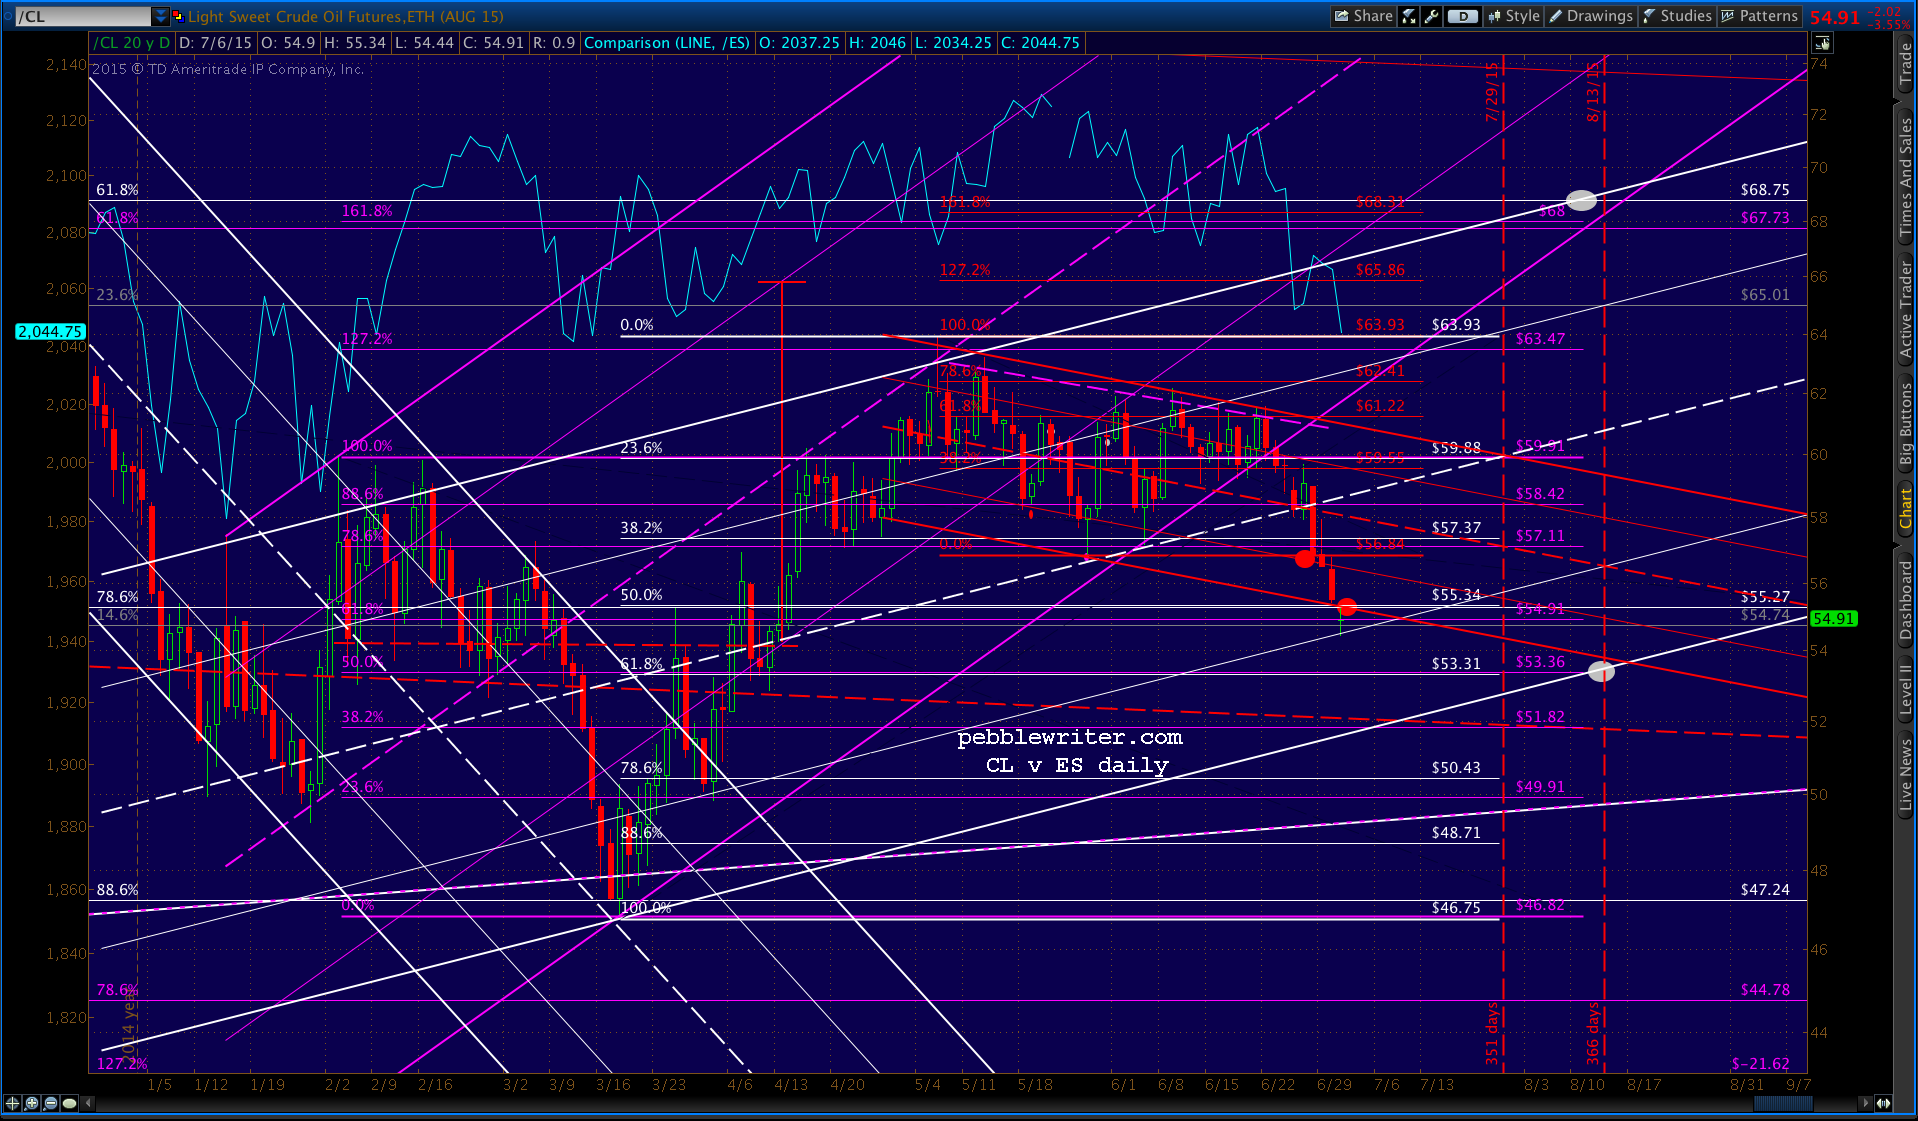
 And, CL has almost reached the .618 retrace of its rise from March — reinforcing the rising white channel.
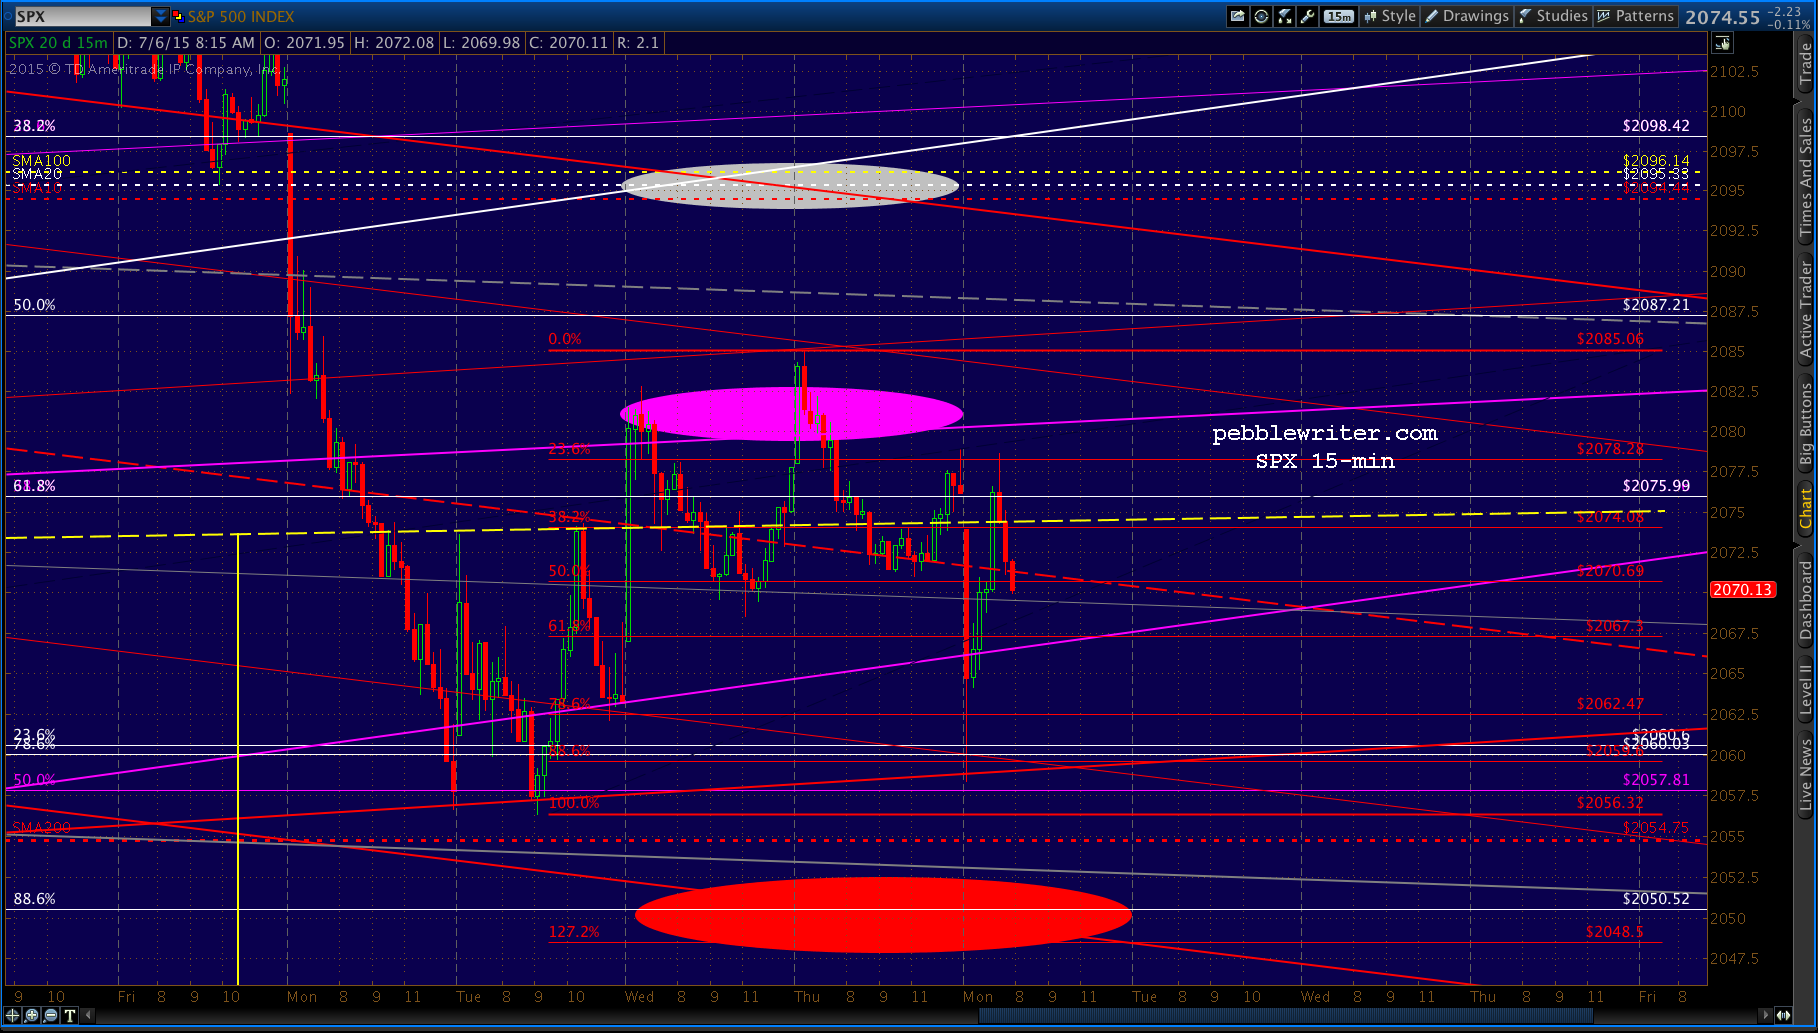
 SPX was fairly well-behaved last week, with the backtest of the purple channel bottom a little more exuberant than expected. So, the door remains open to more downside.
I have been expecting SPX to sell off enough to finally tag its own SMA200 — now at 2054.75 — for quite some time. But, with the eminis having rebounded 25 points, we have to remain open to the possibility that TPTB won’t risk a 20-pt drop at this point.
For now, I’ve left the red target at the white .886 just below the SMA200 at 2050.52 and the yellow target at the purple .618 of 2039.69.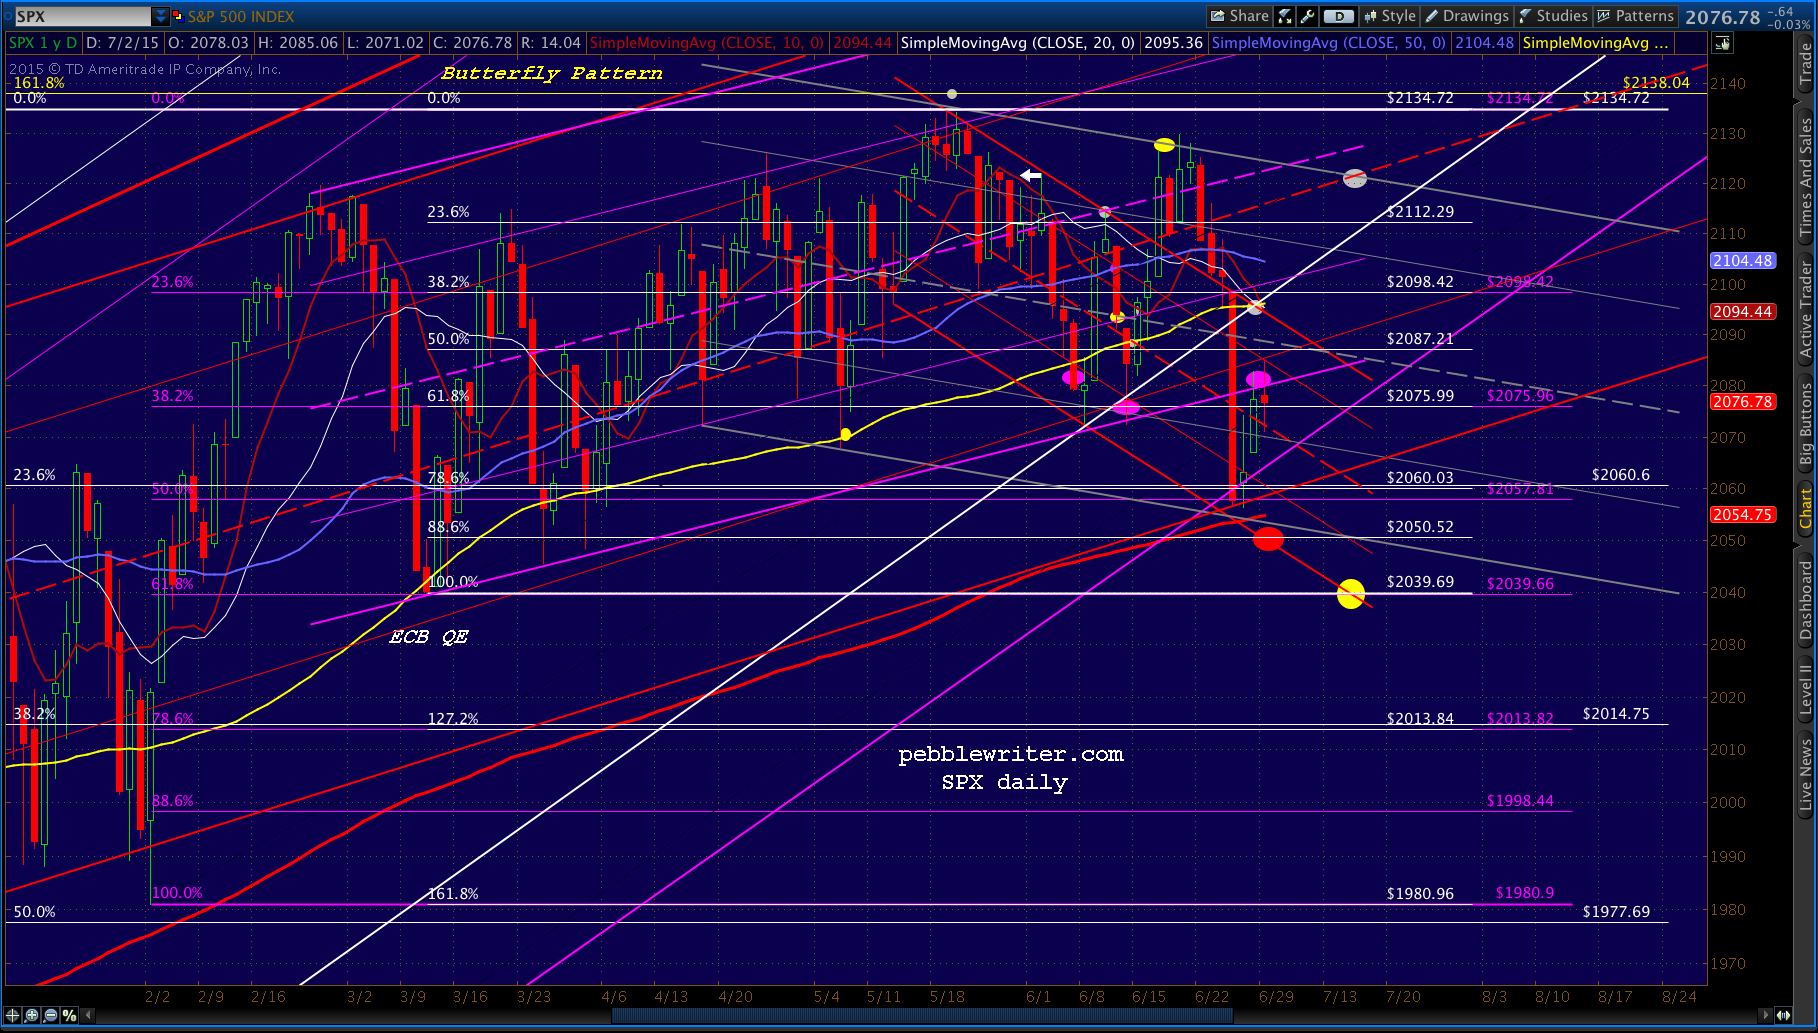
UPDATE: 9:34 AM
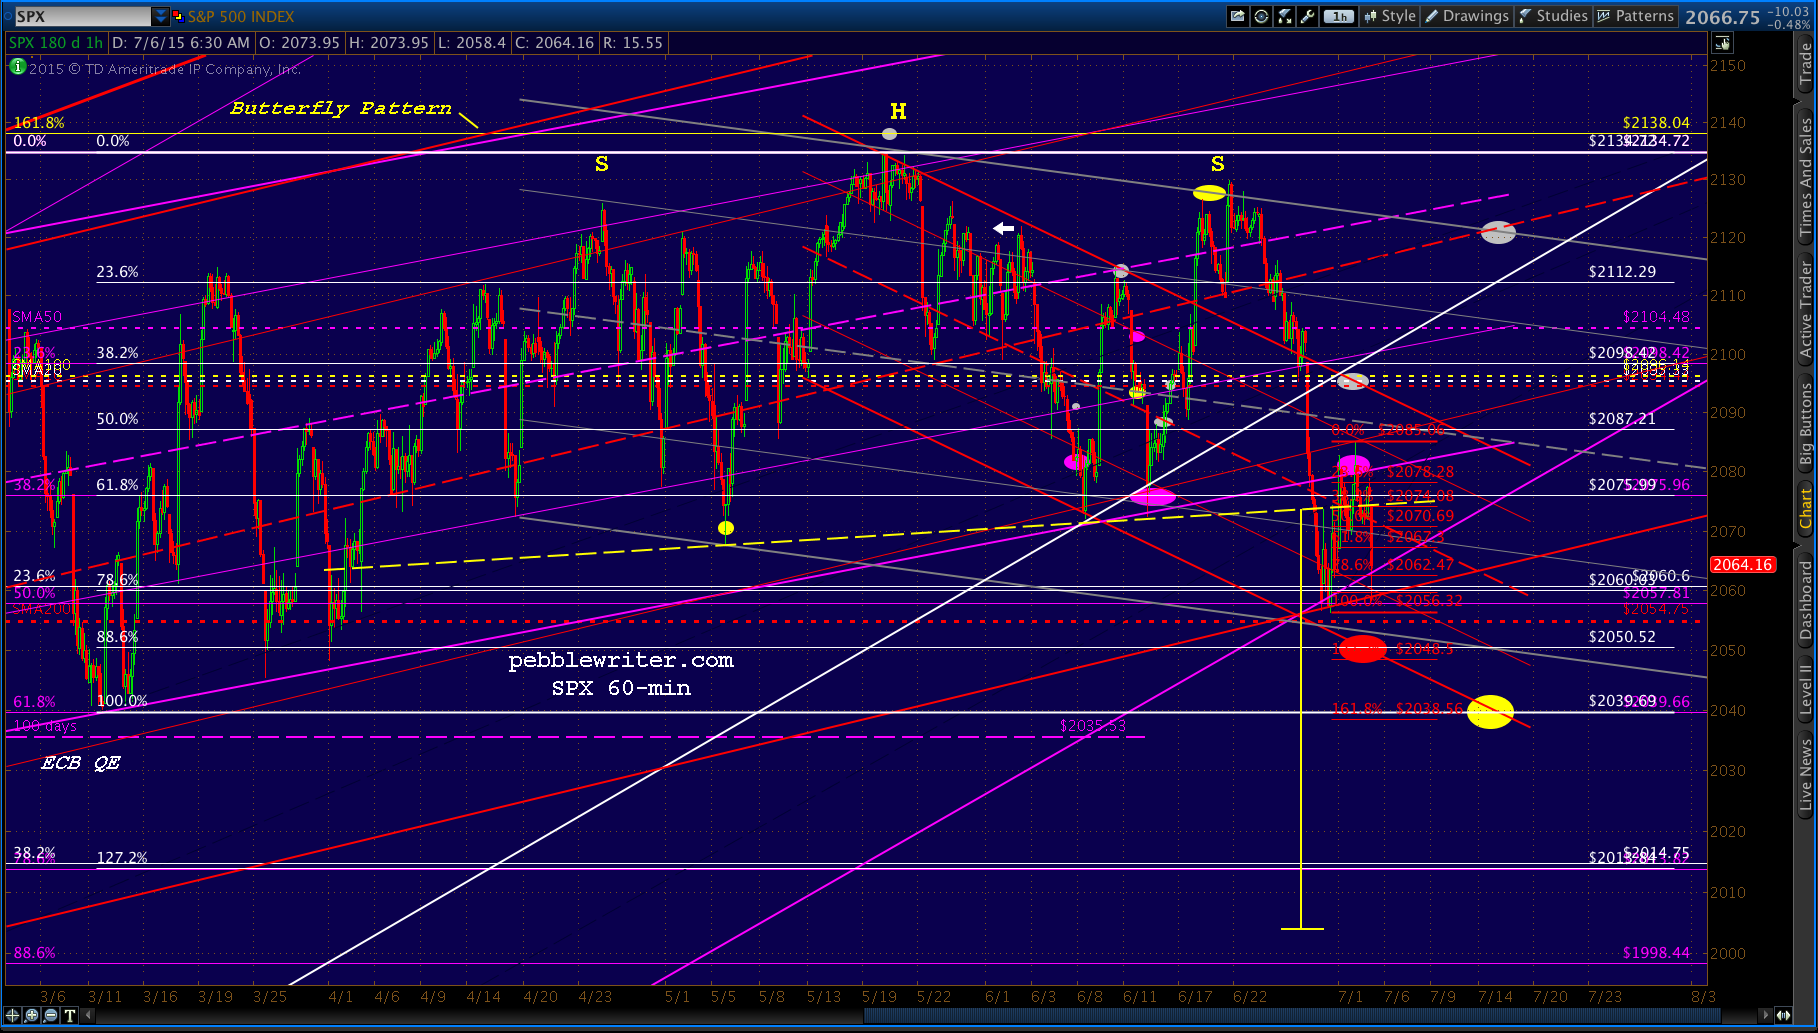
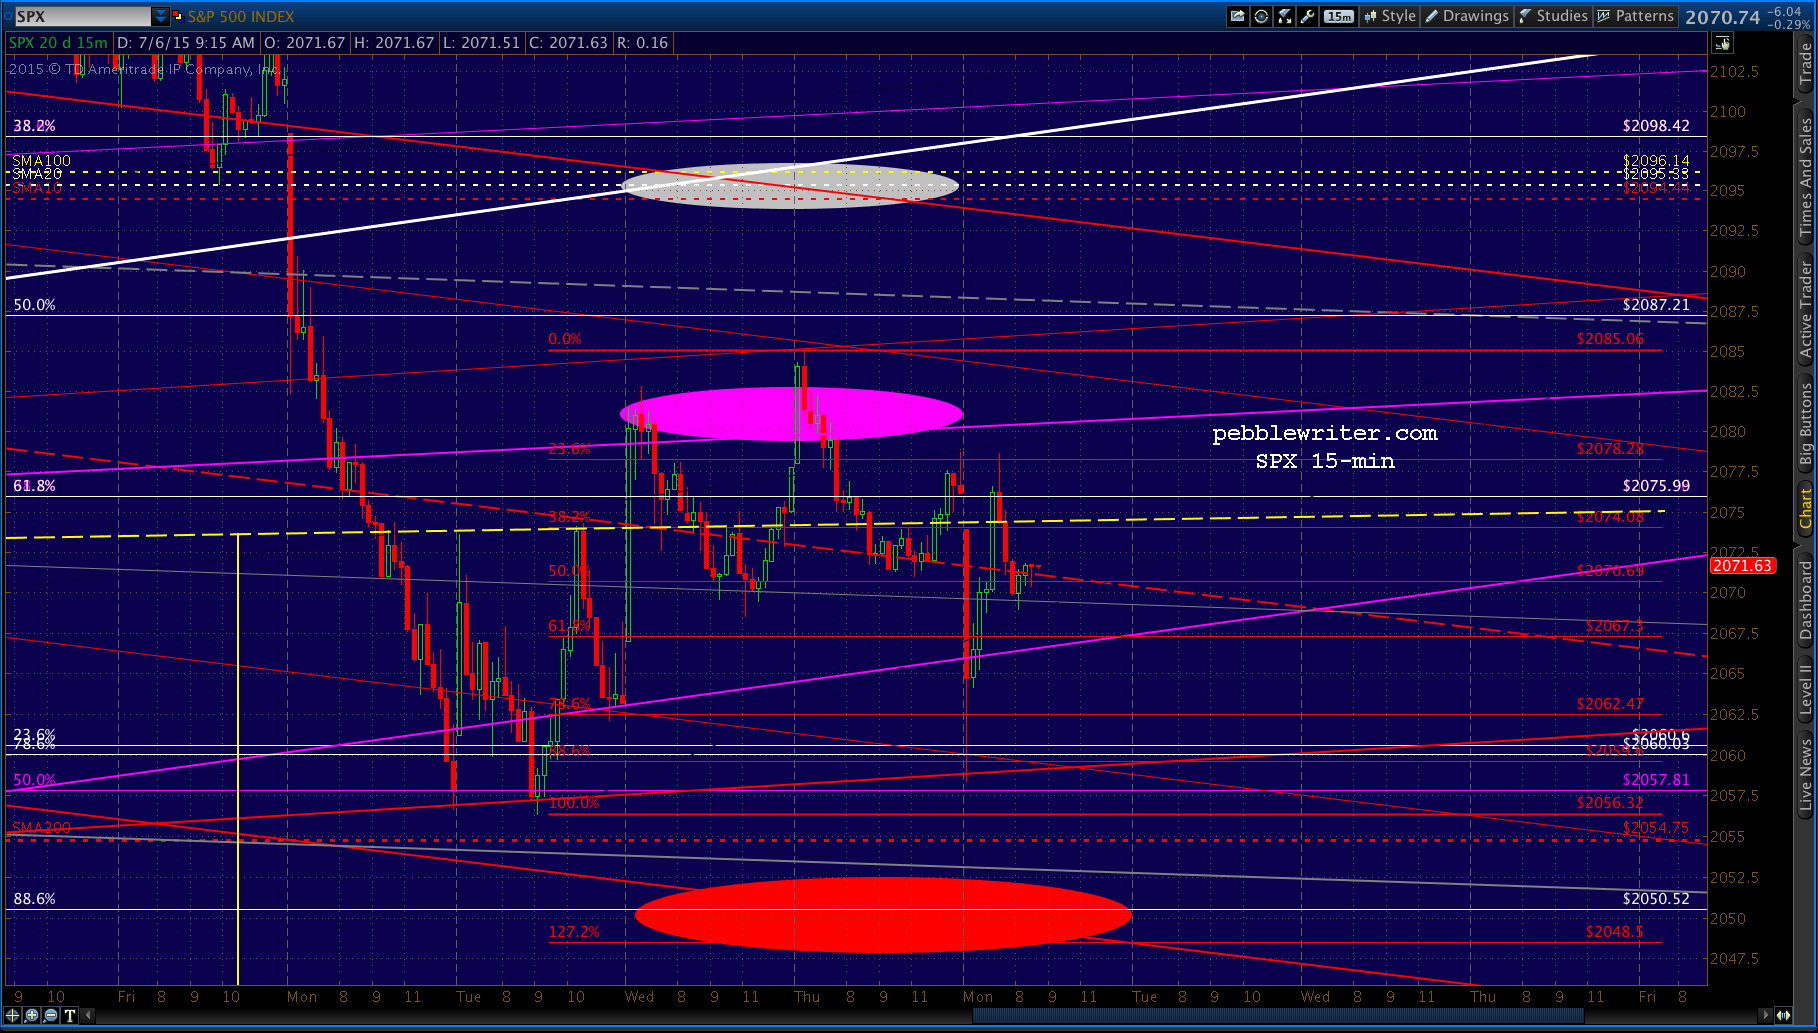
SPX just reached 2060. Should it occur, a bounce here should at least retest the red channel midline at 2071 and possibly the H&S neckline at around 2074. While I would categorize it as a corrective bounce at this time, watch out for “news” that could extend it up past resistance. This morning’s gap would be closed at 2076.18.
 Revised charts in a moment.
Here’s the revised 60-min chart reflecting the H&S pattern targeting 2004. Note this would represent a .786-.886 retrace of the Feb lows, but only a .382 retrace of the Oct 2014 lows.
 UPDATE: 10:15 AM
 UPDATE: 10:47 AM
 UPDATE: 11:15 AM
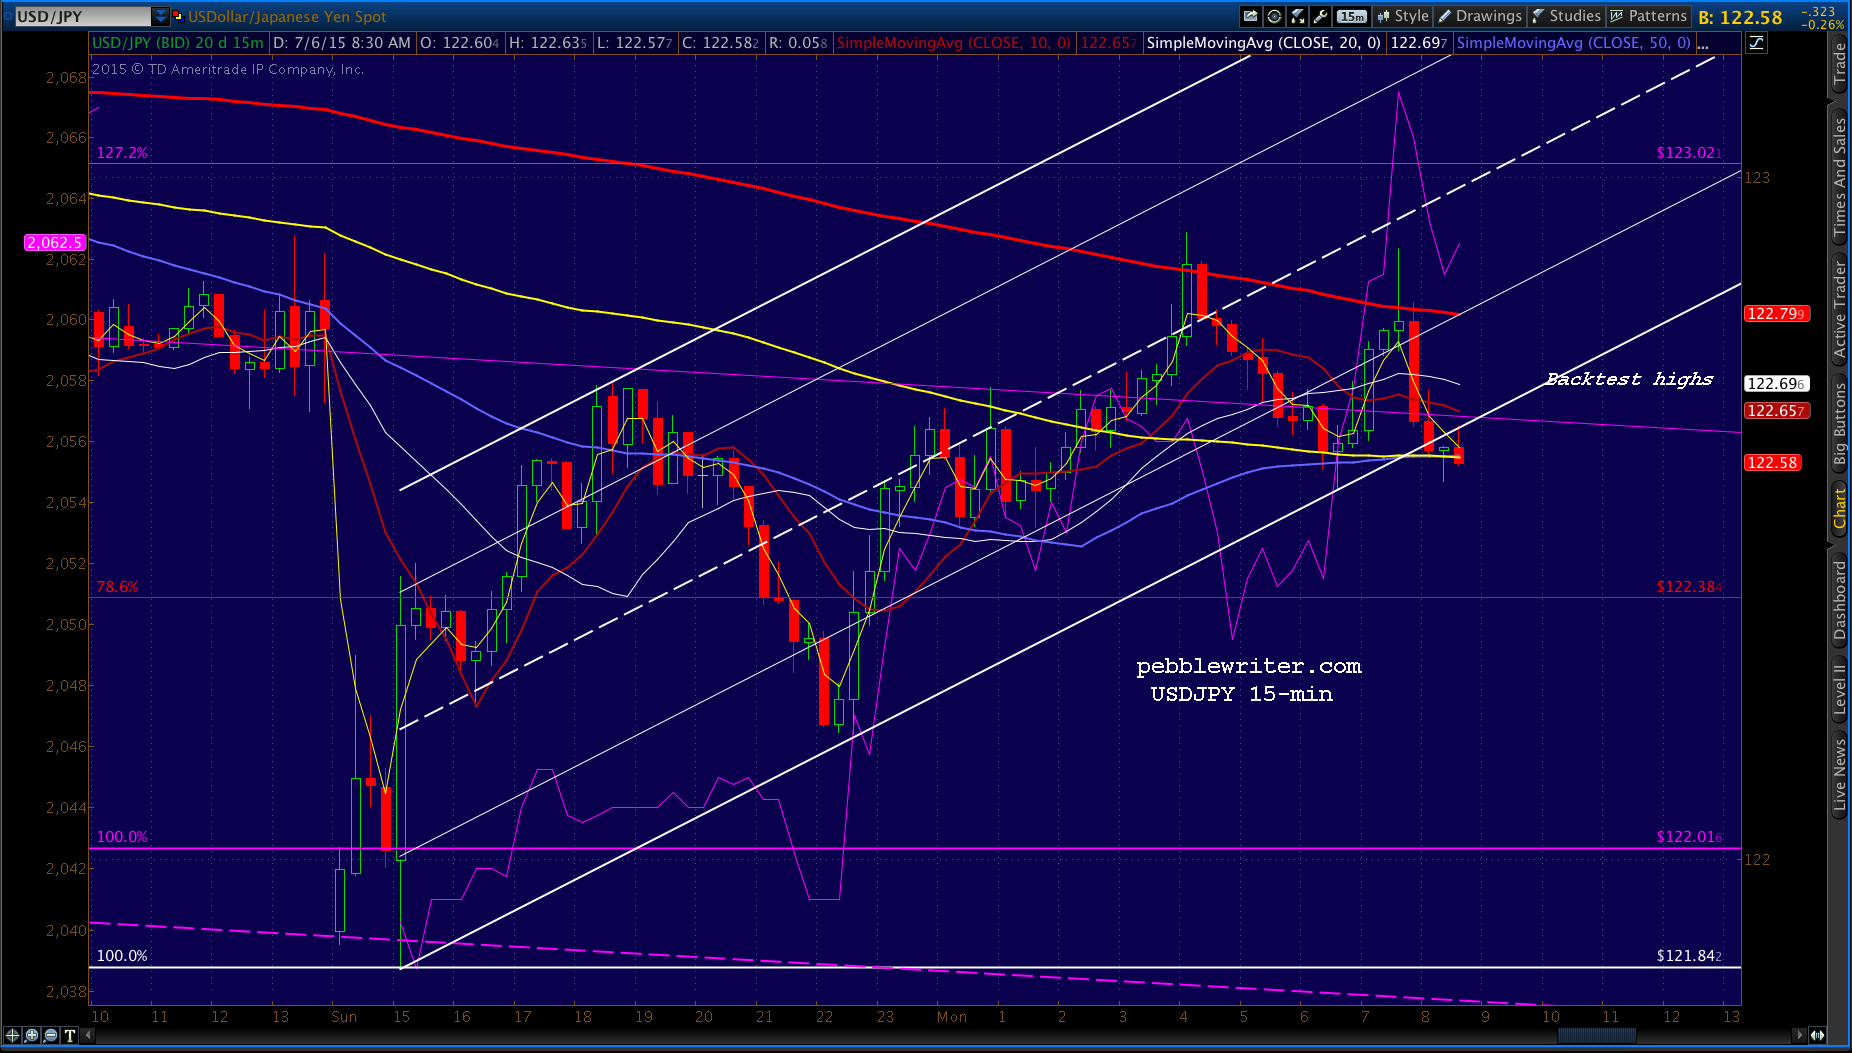
USDJPY in danger of breaking down here. A loss of the rising white channel would likely mean lower lows for SPX. 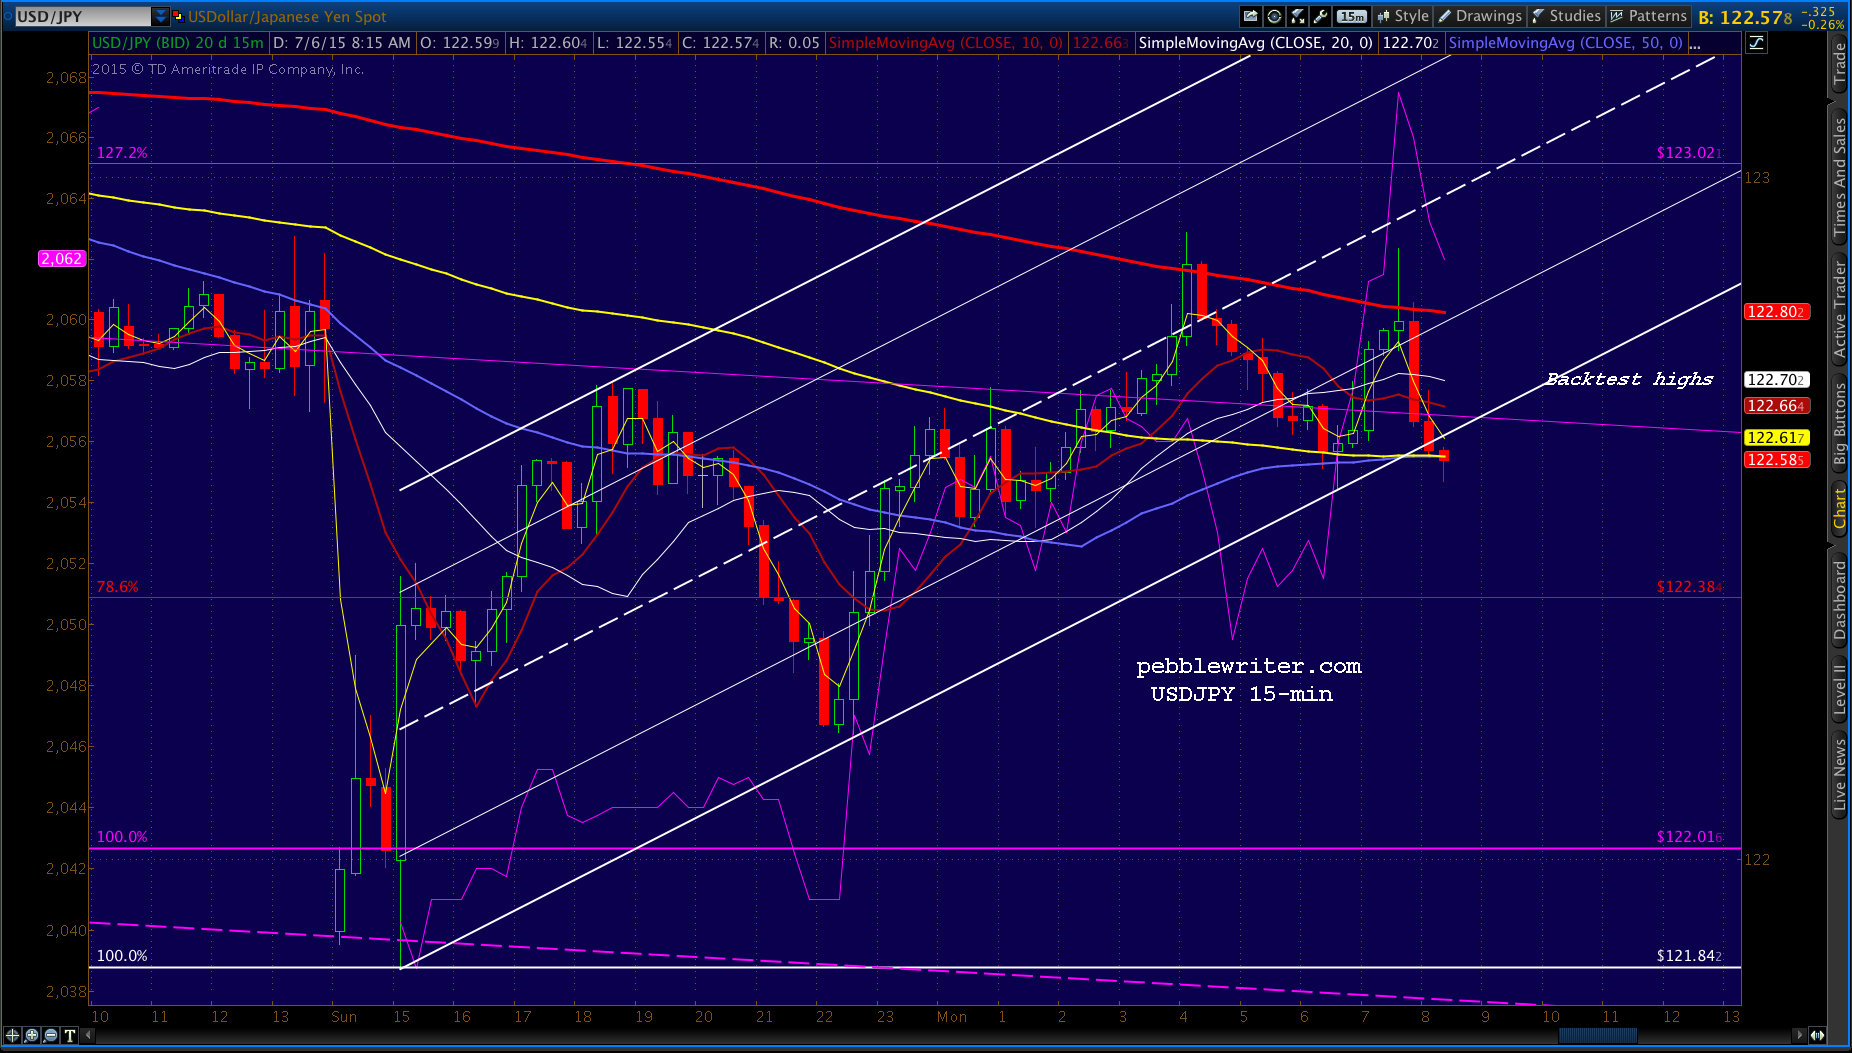 A good bounce here, on the other hand, would take SPX north of 2082.
 UPDATE: 11:45 AM
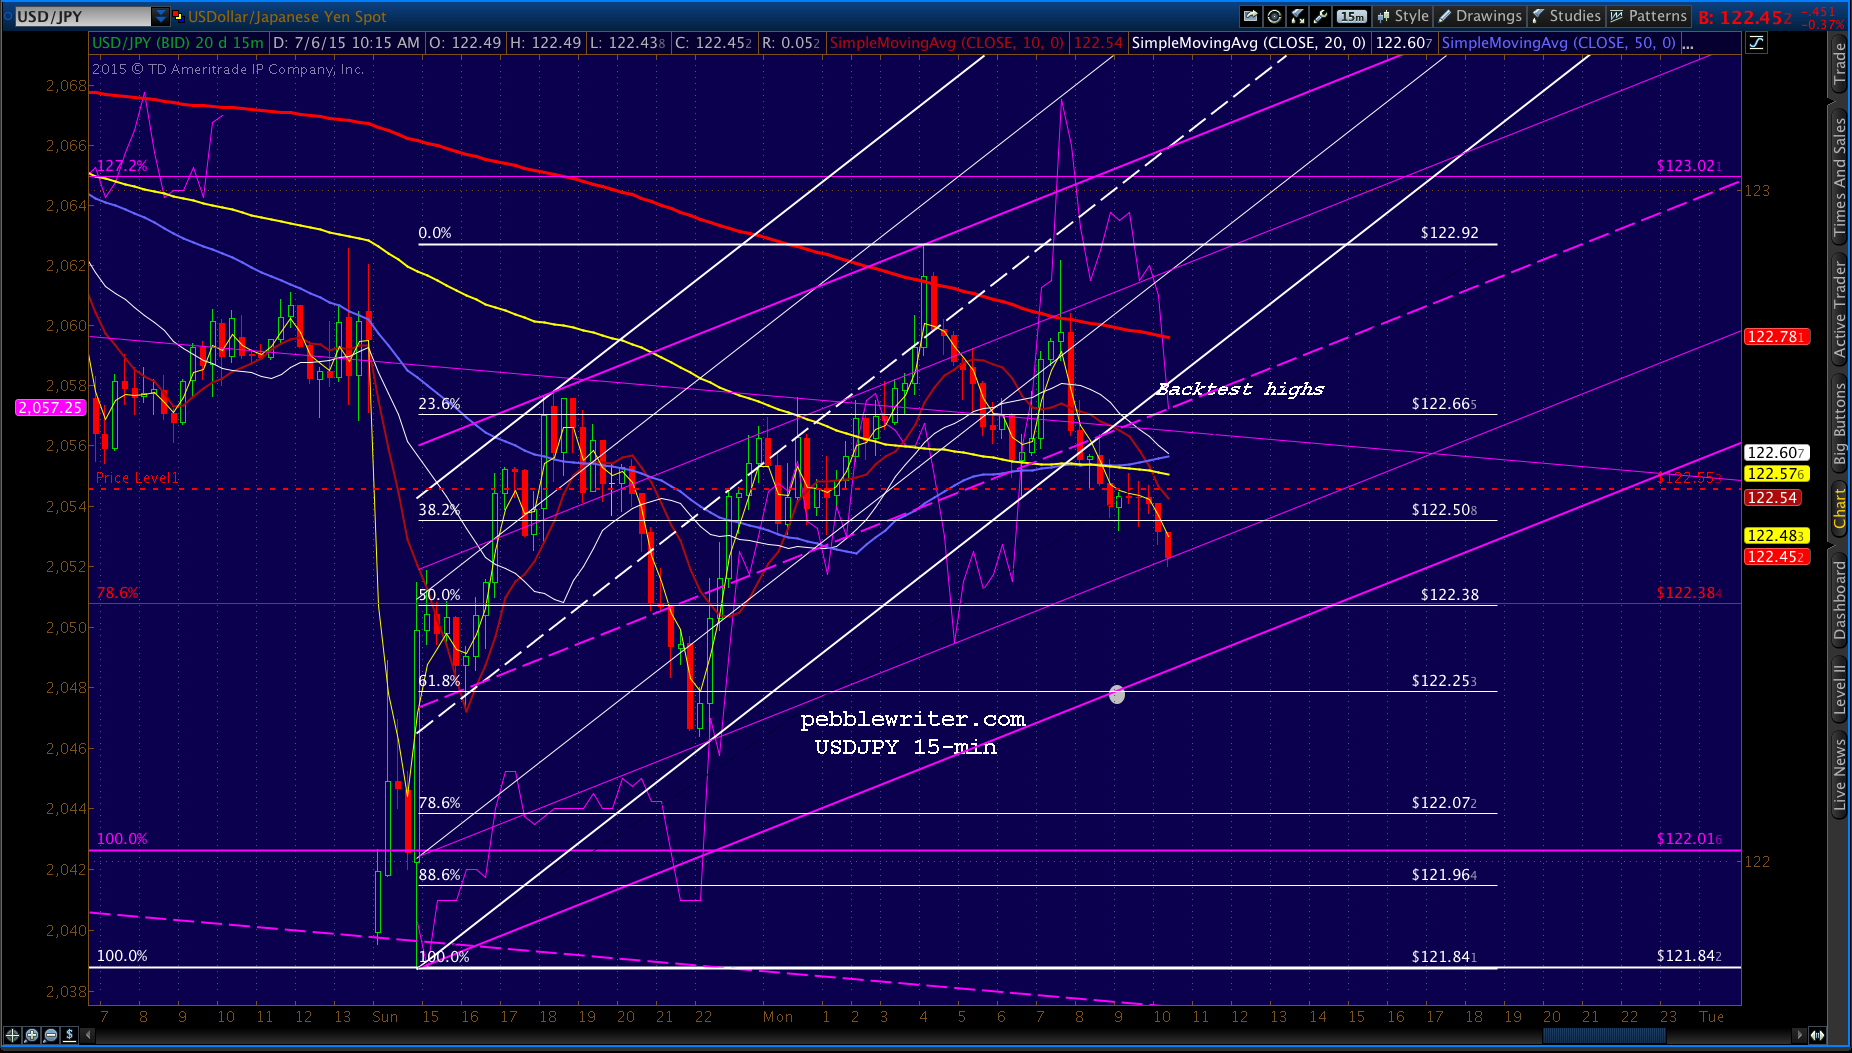
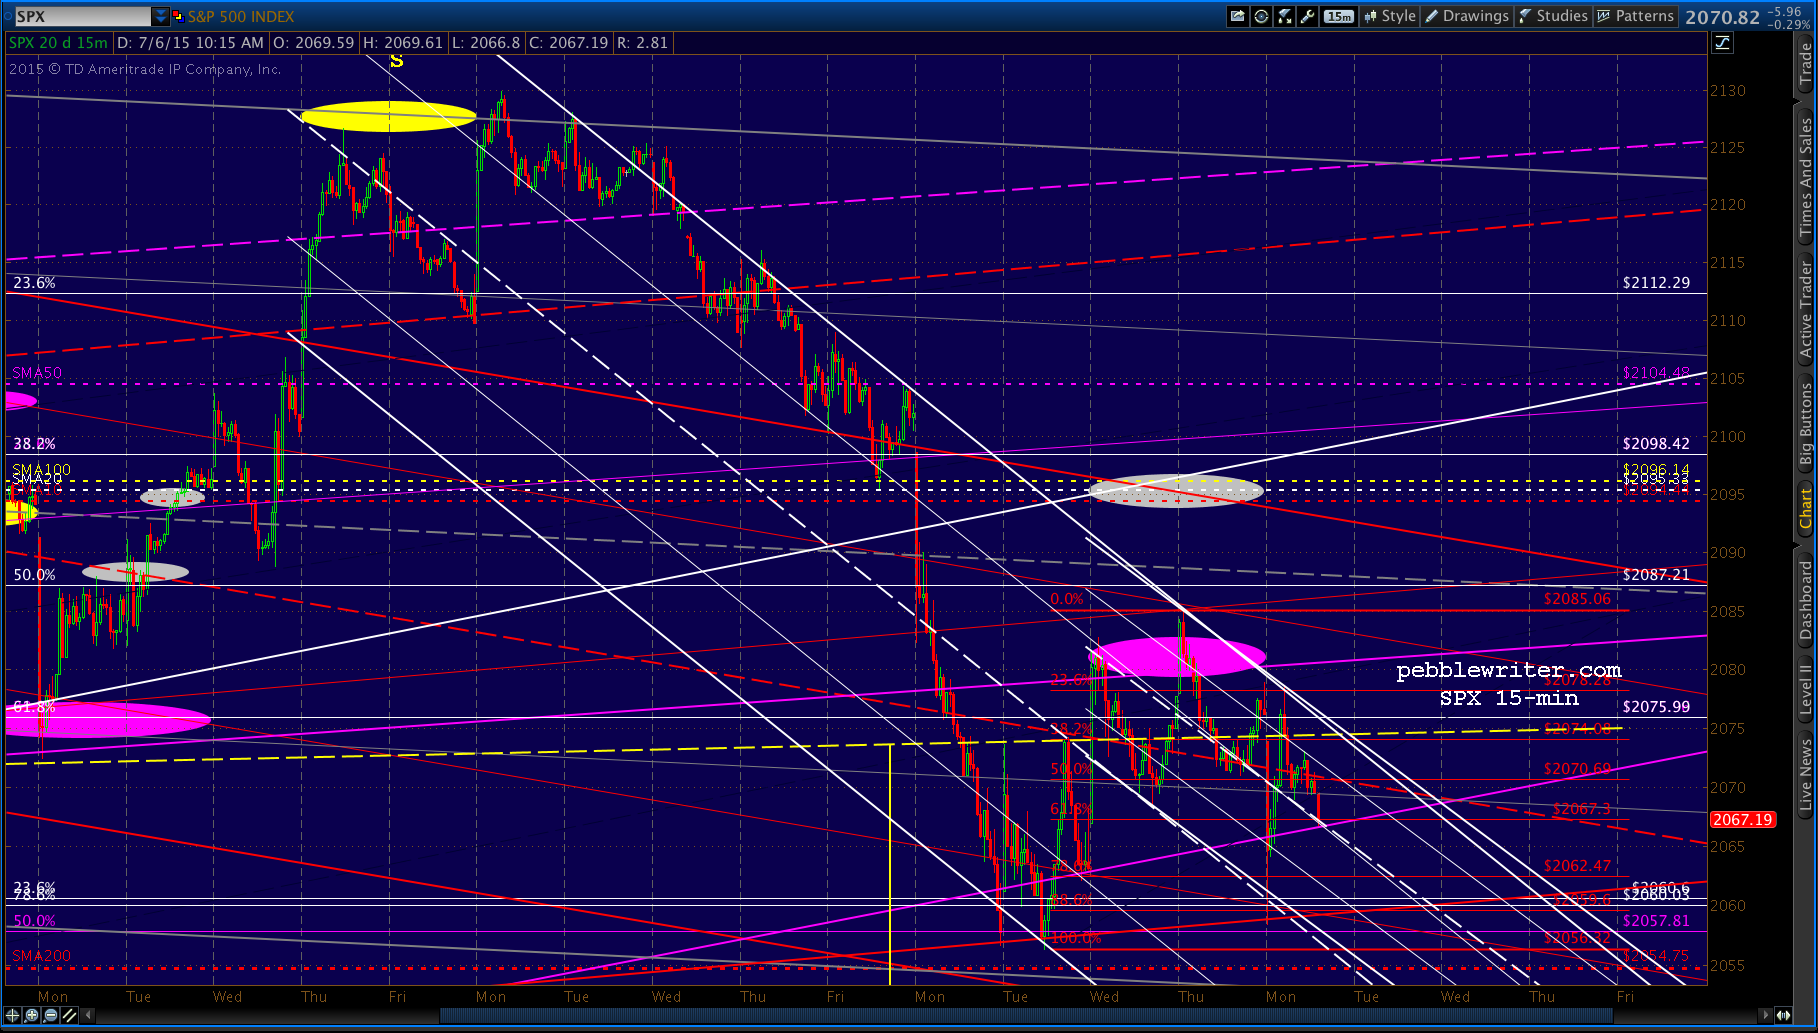
USDJPY backtested the rising white channel as SPX backtesting the red midline. No cards being shown yet, but the “market” appears to be back under the Fed’s algo control. I’d let USDJPY at 122.54 be the line in the sand for shorting again.

 UPDATE: 12:00 PM
USDJPY slipping, so I’d short again here at 2071.70, see if we can’t get that SMA200 tag. Keep an eye on the USDJPY moving averages, with an objective at 122.253. Tight stops still a great idea.

 UPDATE: 12:17 PM
 UPDATE: 1:15 PM
 UPDATE: 14:33
USDJPY just tagged the bottom of the purple channel. Would prefer the .618 at 122.253, but not sure it’ll get there during market hours. 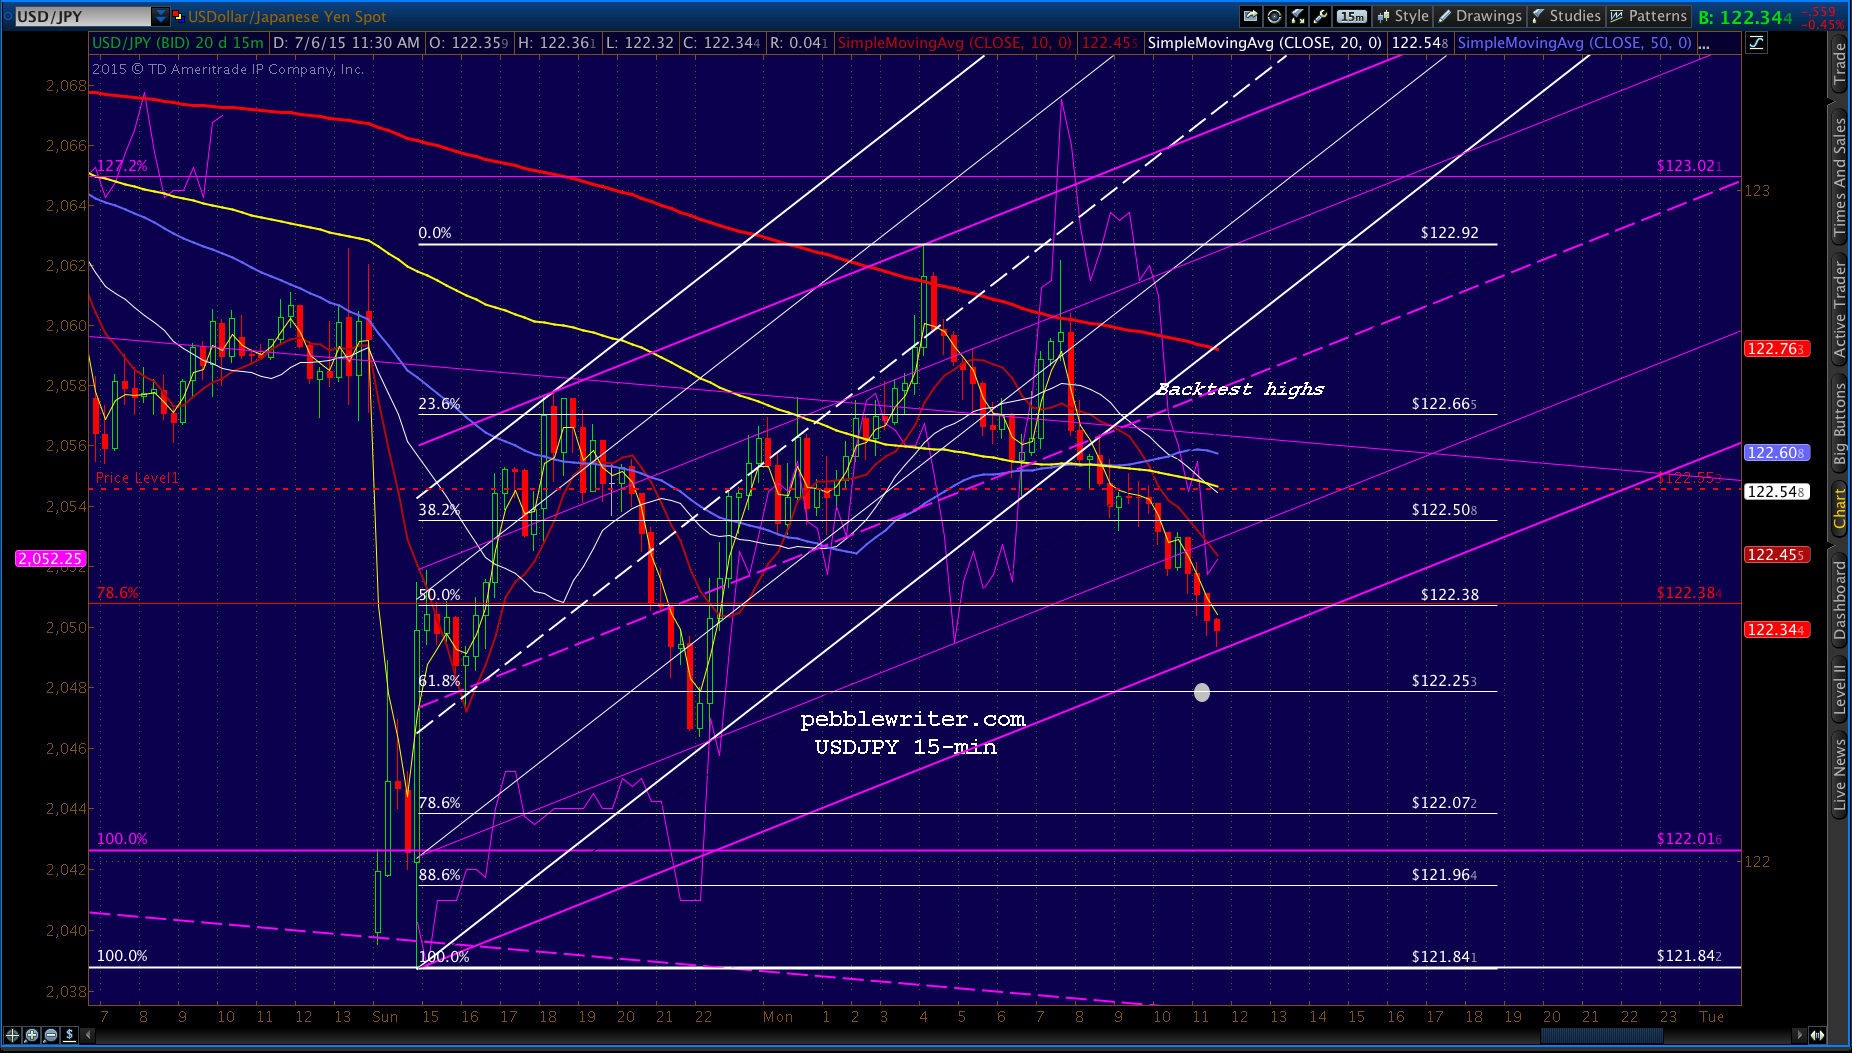
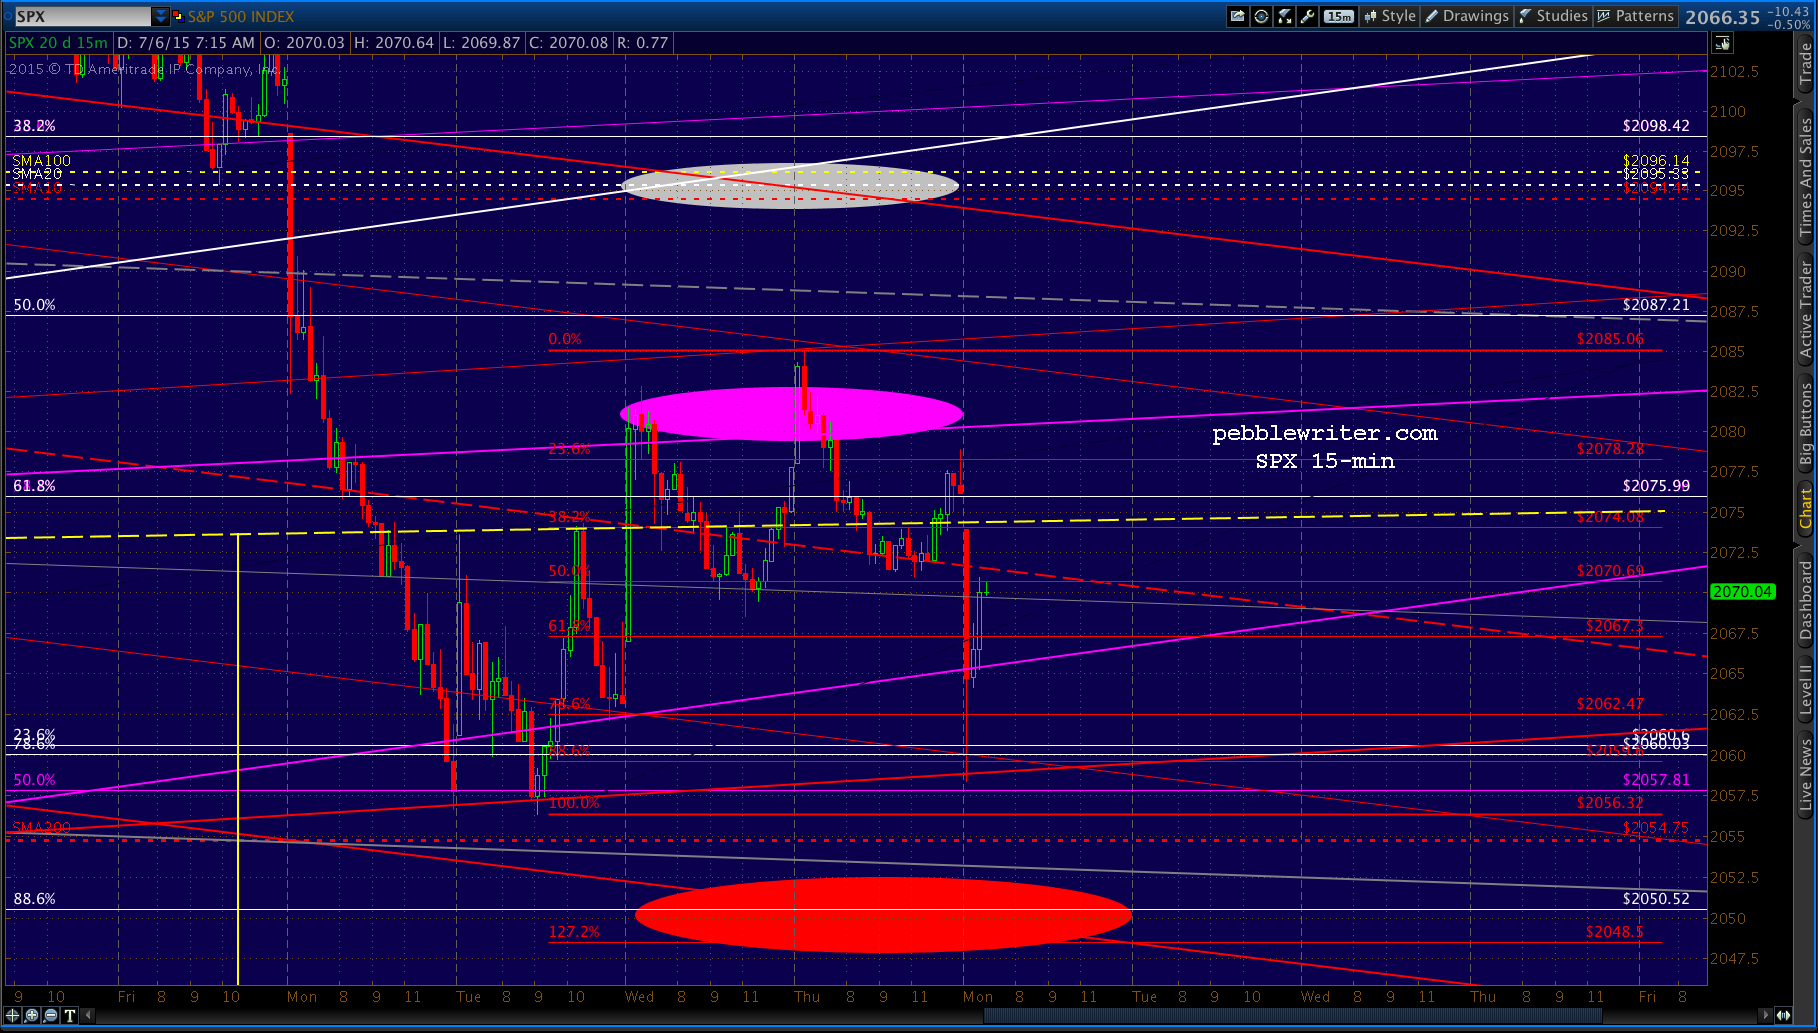
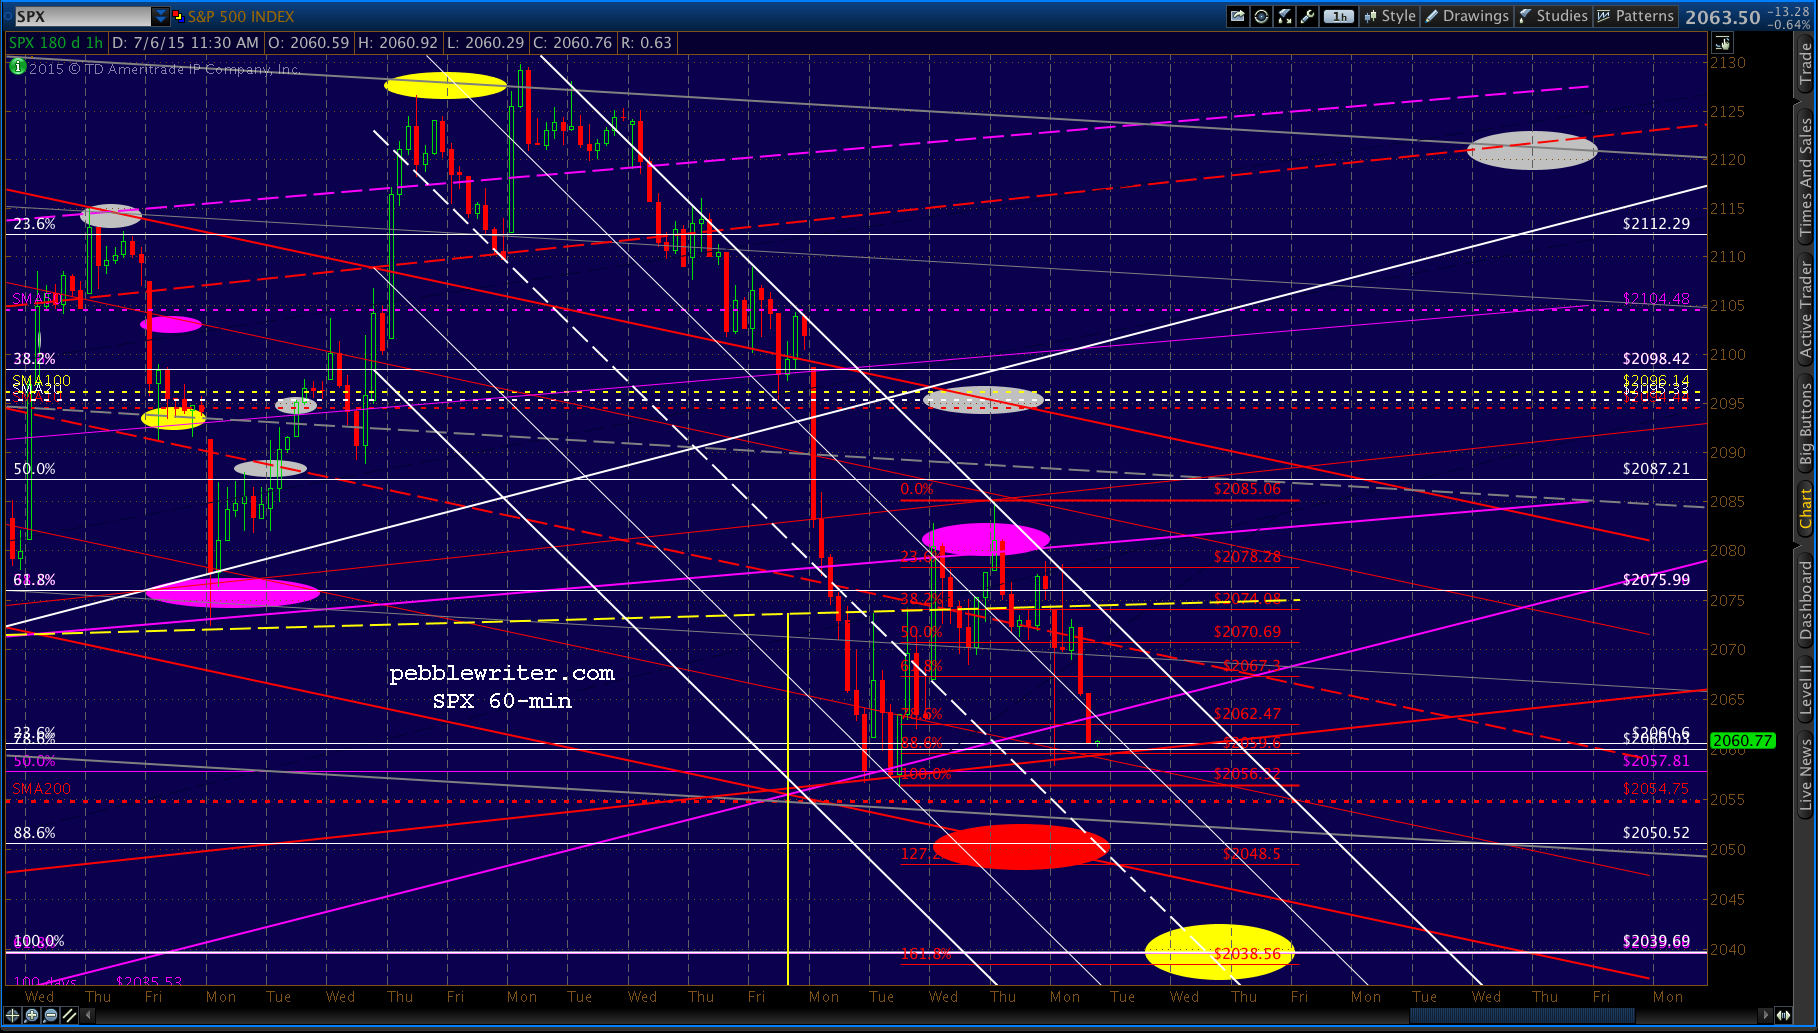 It would make the most sense for SPX to close at or above the purple channel bottom at 2063.50ish, then dip down to tag the actual bottom (2048.50?) intraday tomorrow.
That way, support is tagged without the trend being broken. Remember, that purple channel line dates back to Mar 2009.
UPDATE: 3:18 PM