

 Technical analysis and chart patterns are sometimes regarded as akin to witchcraft. Yet, fairly often, they prove incredibly accurate in forecasting reversal points and targets.
In honor of the latest such eerily accurate forecast, and since tomorrow is Halloween, we’ll take a fresh look at whether something wicked this way comes.
And, since many investors are very nervous at the moment, we’re offering a wicked smaht membership promotion. Through Nov 3, we’ll knock $60 off the initial month of a monthly subscription and $100 off the initial quarter of a quarterly subscription. To sign up, CLICK HERE.
* * *
Back on Oct 12 [see: A Cure?] as the market’s daily meltups inspired the tongue-in-cheek observation that central bankers might have found a cure for market corrections, we noted that the latest rally might have finally run its course:
ES just reached its .886 retracement, meaning we are very likely to see a reversal here. My favorite target remains the yellow channel midline, currently at 3218ish.

This morning, ES backtested that yellow channel midline (now at 3226) for a garden variety 8.9% correction. [Note: we adjusted the price target to 3225 and the timing to Oct 30 the next day.] While the charts have been good to us, the question remains: is a garden variety correction all we’ll get, or is something more wicked coming our way?
continued for members…
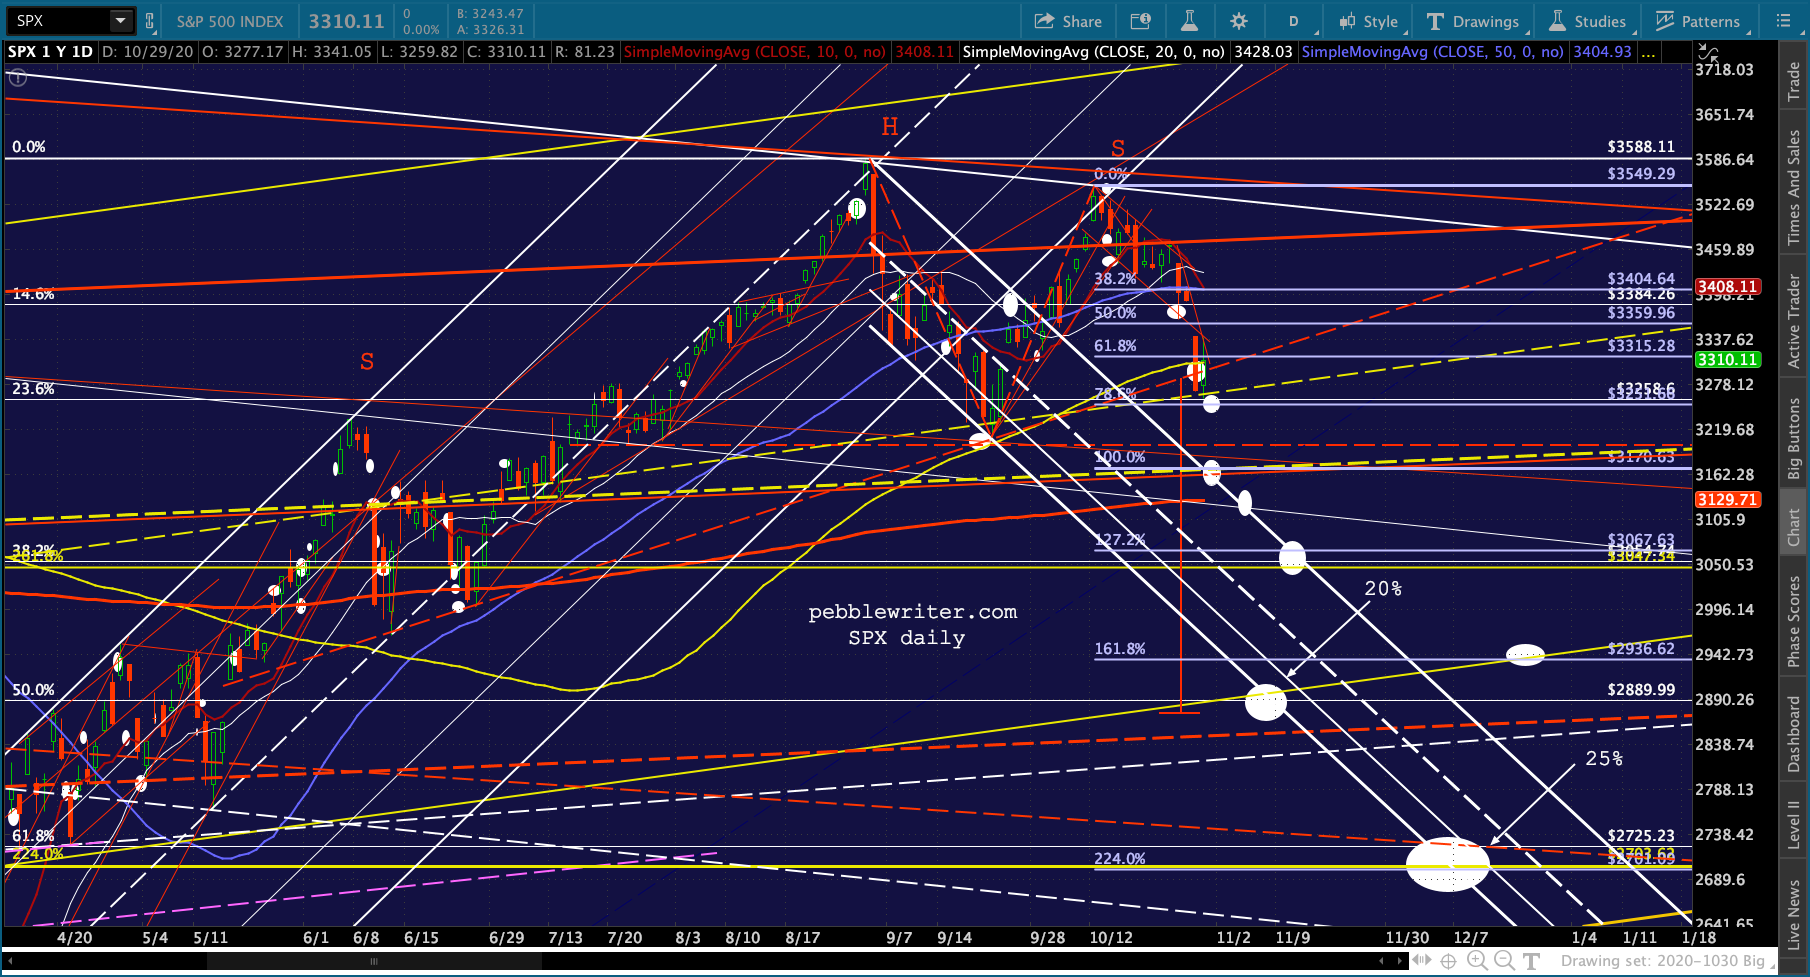
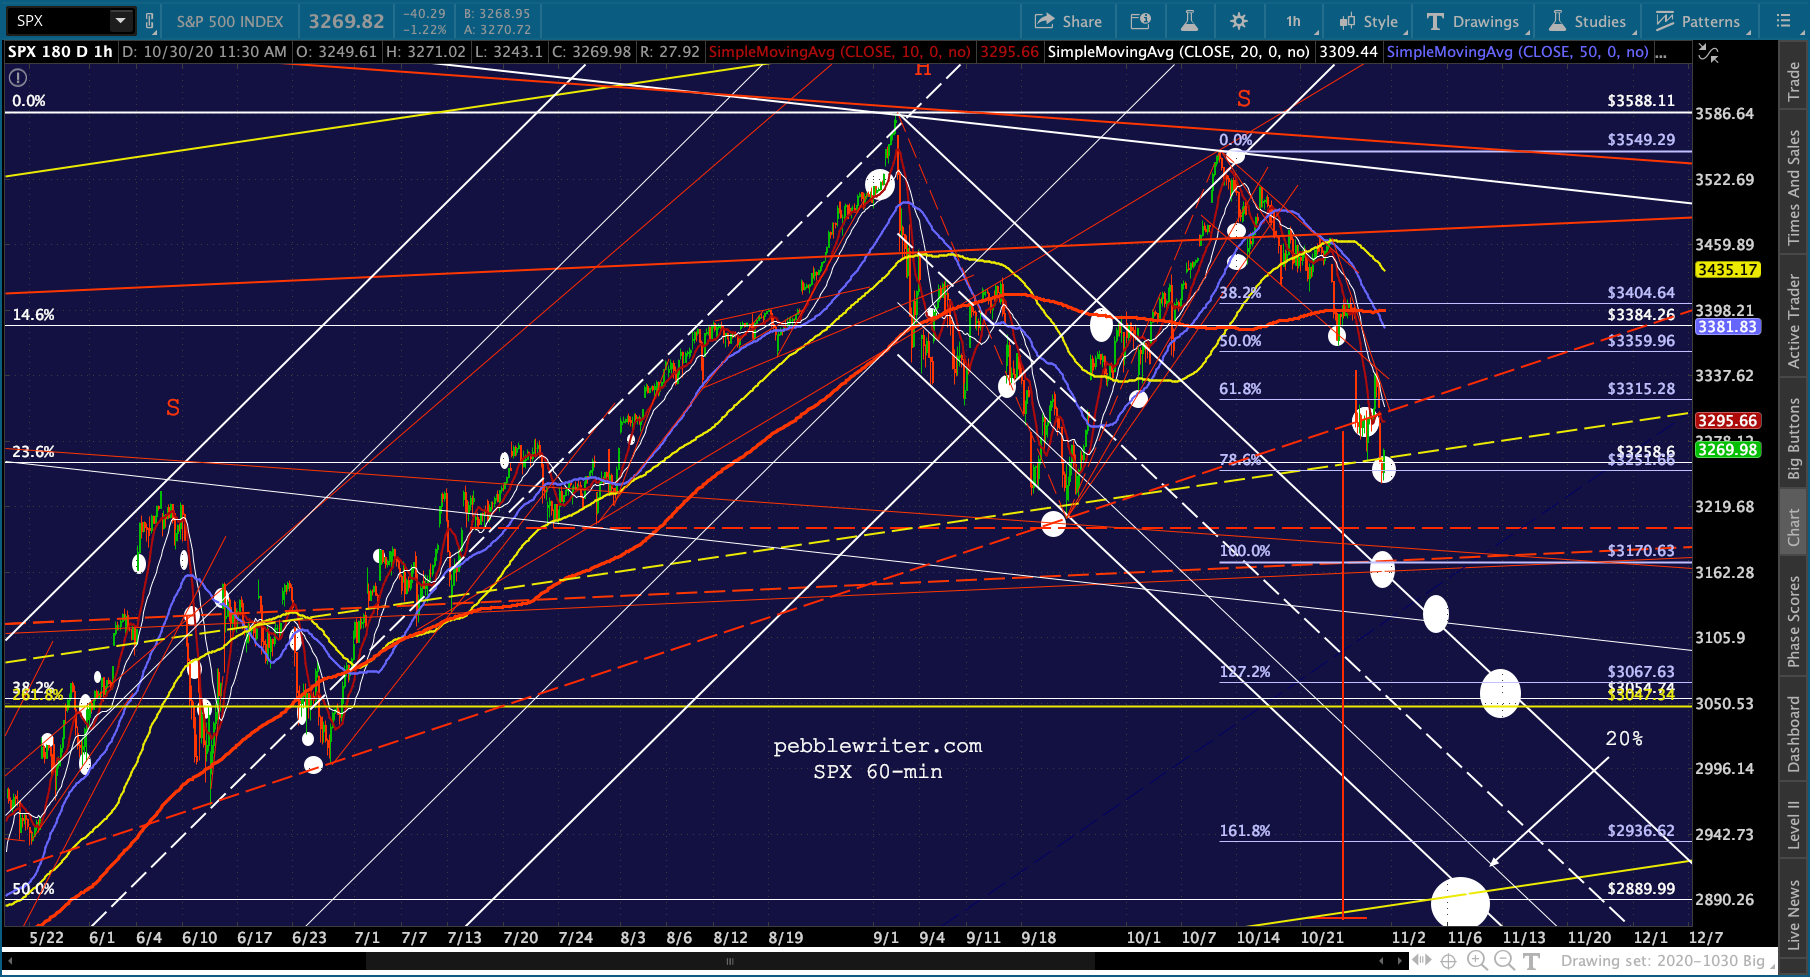
ES has again backtested its broken white channel. But, this time, it has also reached the midline of the rising yellow channel from 2009.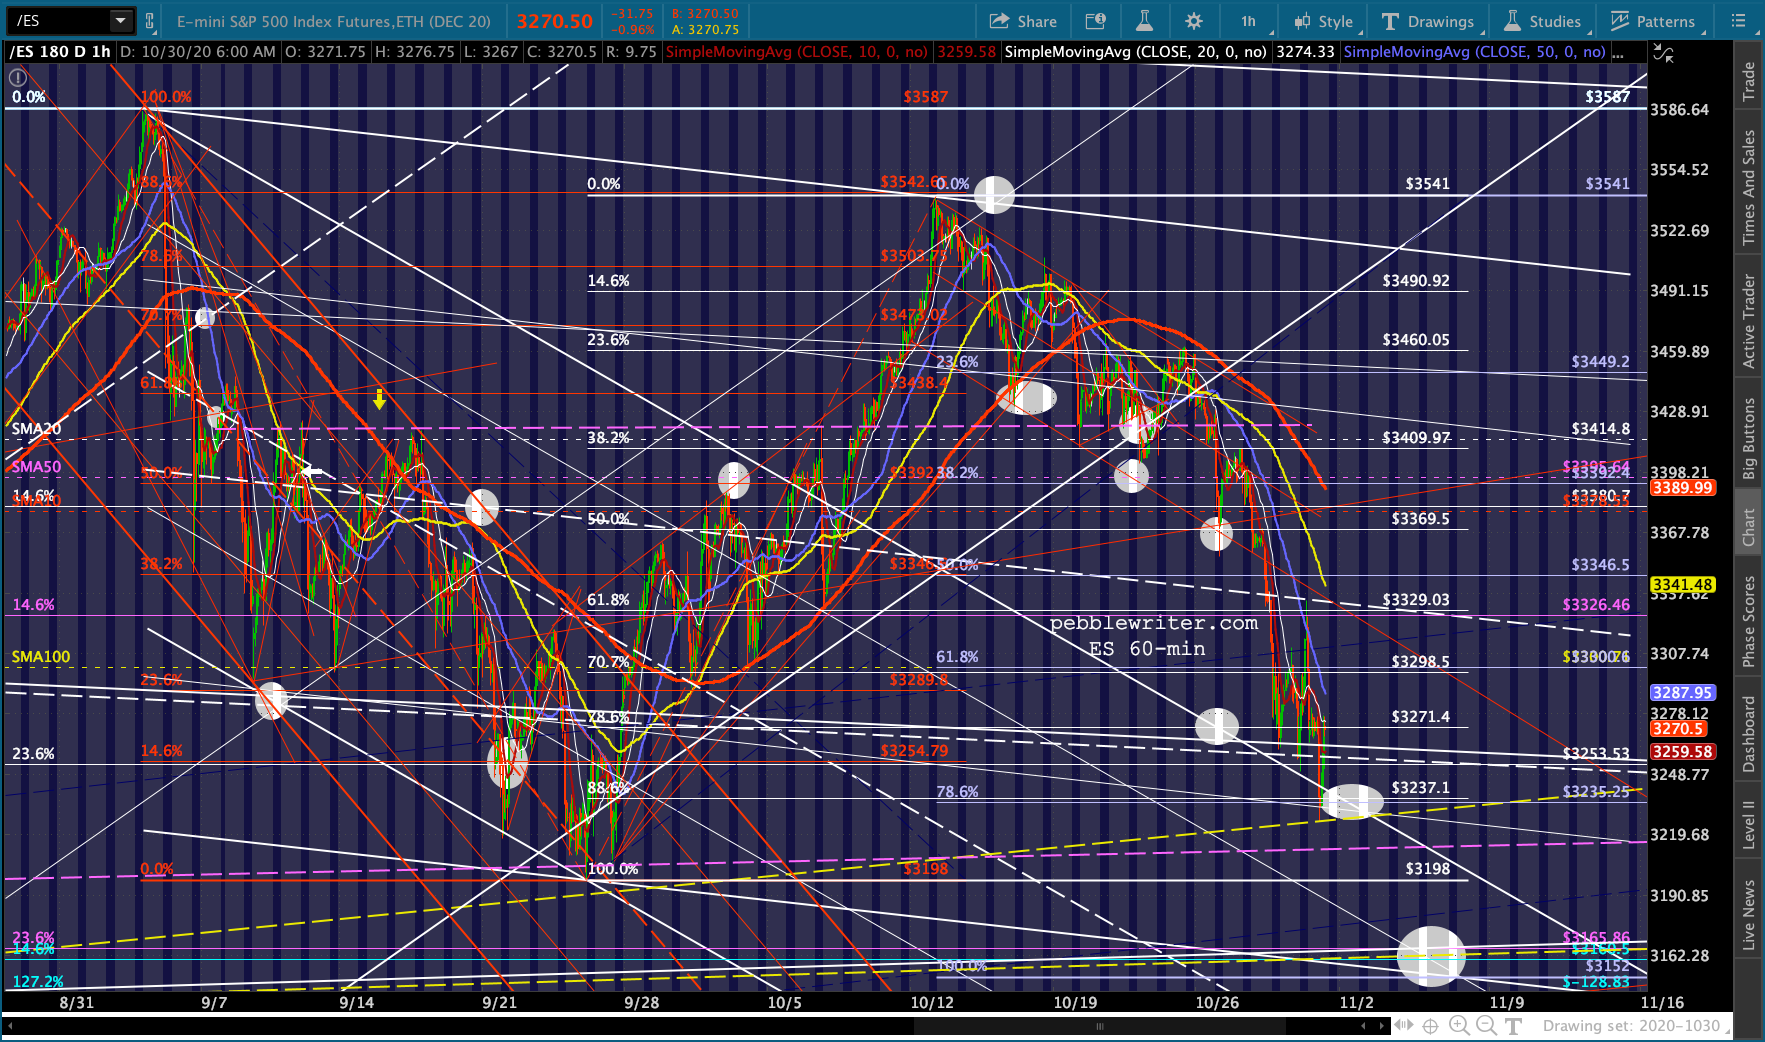 While SPX has also tagged its yellow midline, it has yet to backtest its broken falling white channel.
 As we noted yesterday, a drop through the midline would open up all sorts of downside targets – with the most interesting being the red channel line connecting the 2018 and 2019 tops which intersects with the C=A Fib extension at 3170. This target, if it’s tagged no later than today or Monday, would also effect a backtest of the broken falling white channel.
 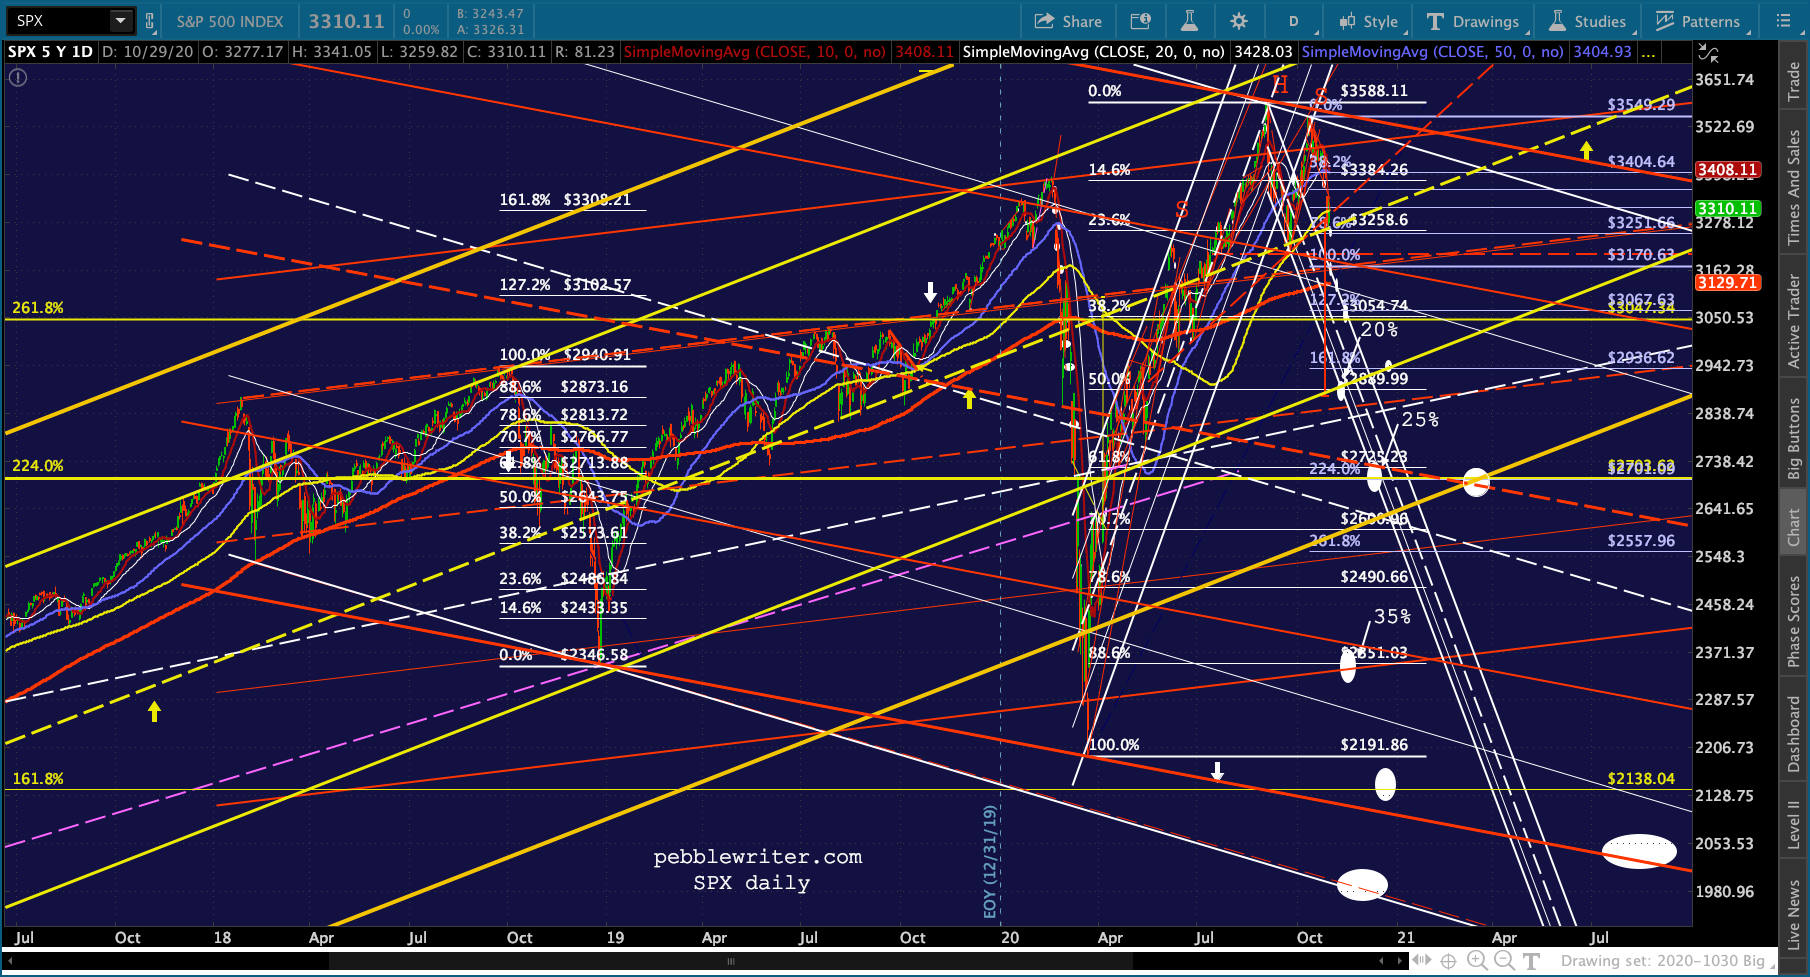 If that support fails, then we’re looking at the 2.618 at 3047, followed by the rising yellow channel .236 line and H&S target at 2875ish (a 20% correction.) Should that support fail, the next most significant support comes at the 2.24 Fib at 2703 – either in December or, if it waits for the bottom of the rising yellow channel to arrive, around Mar 19, 2021.
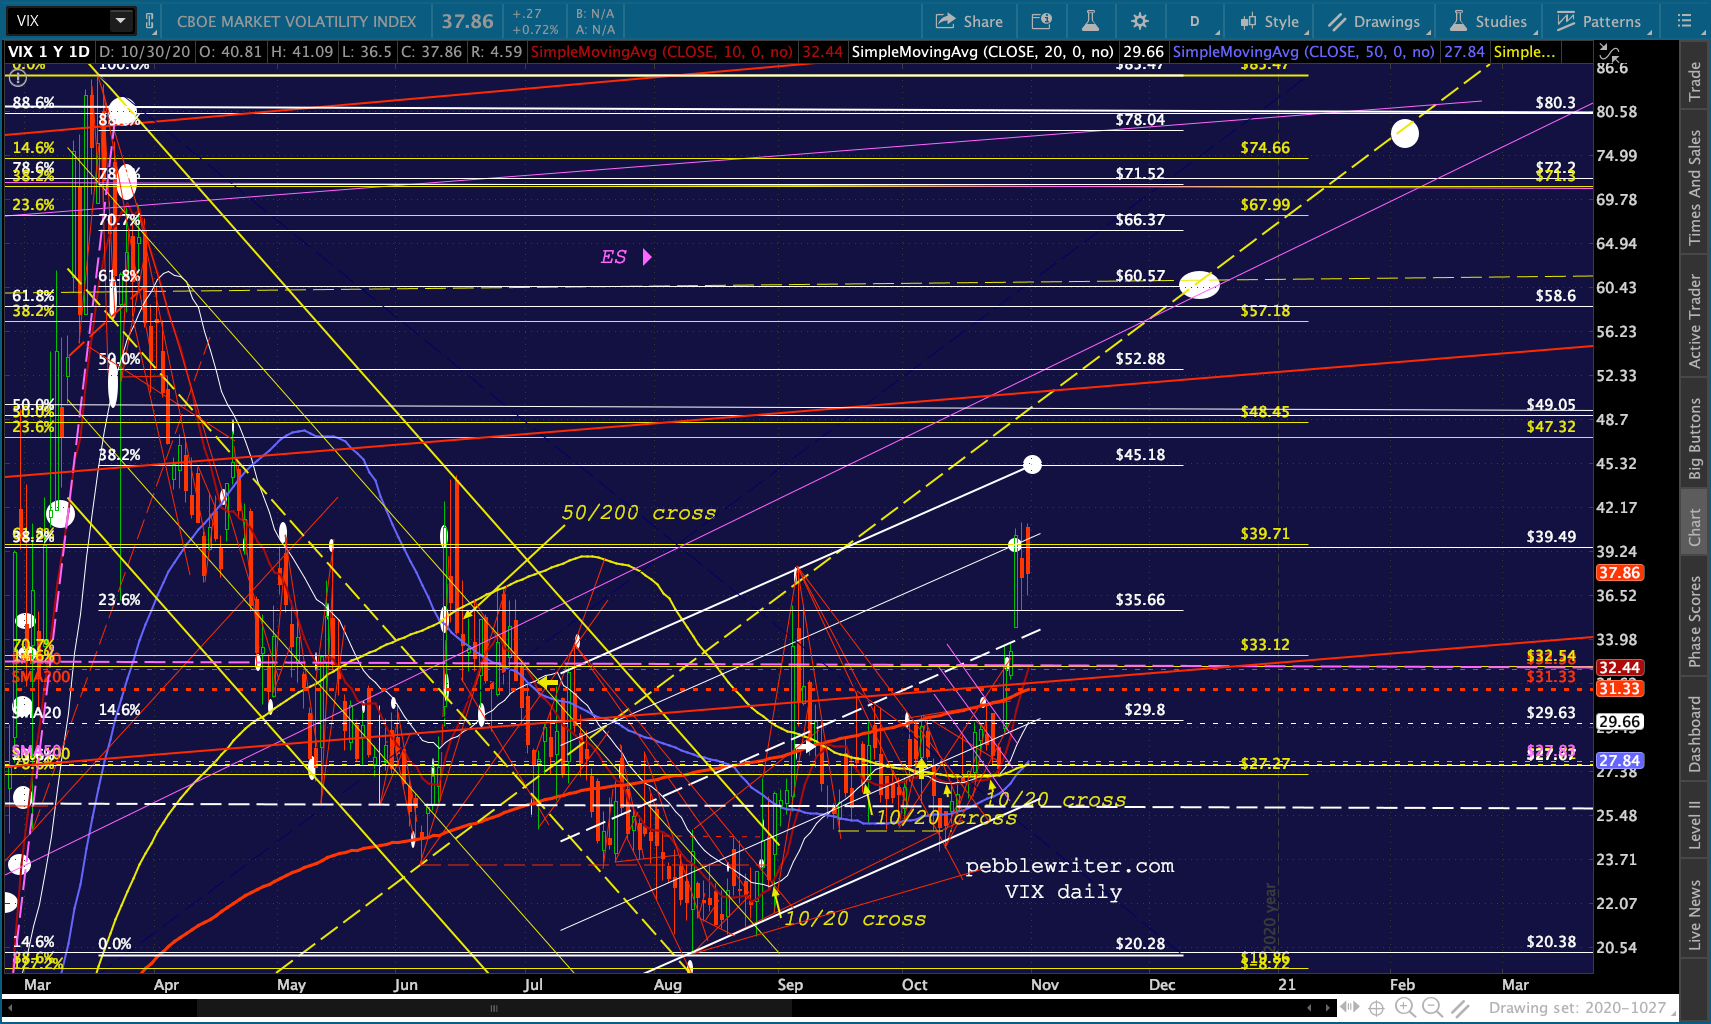
VIX seems to indicate we are likely to see those lower lows. It had no trouble reaching our 39.49 target, and has a clear path to 45.18.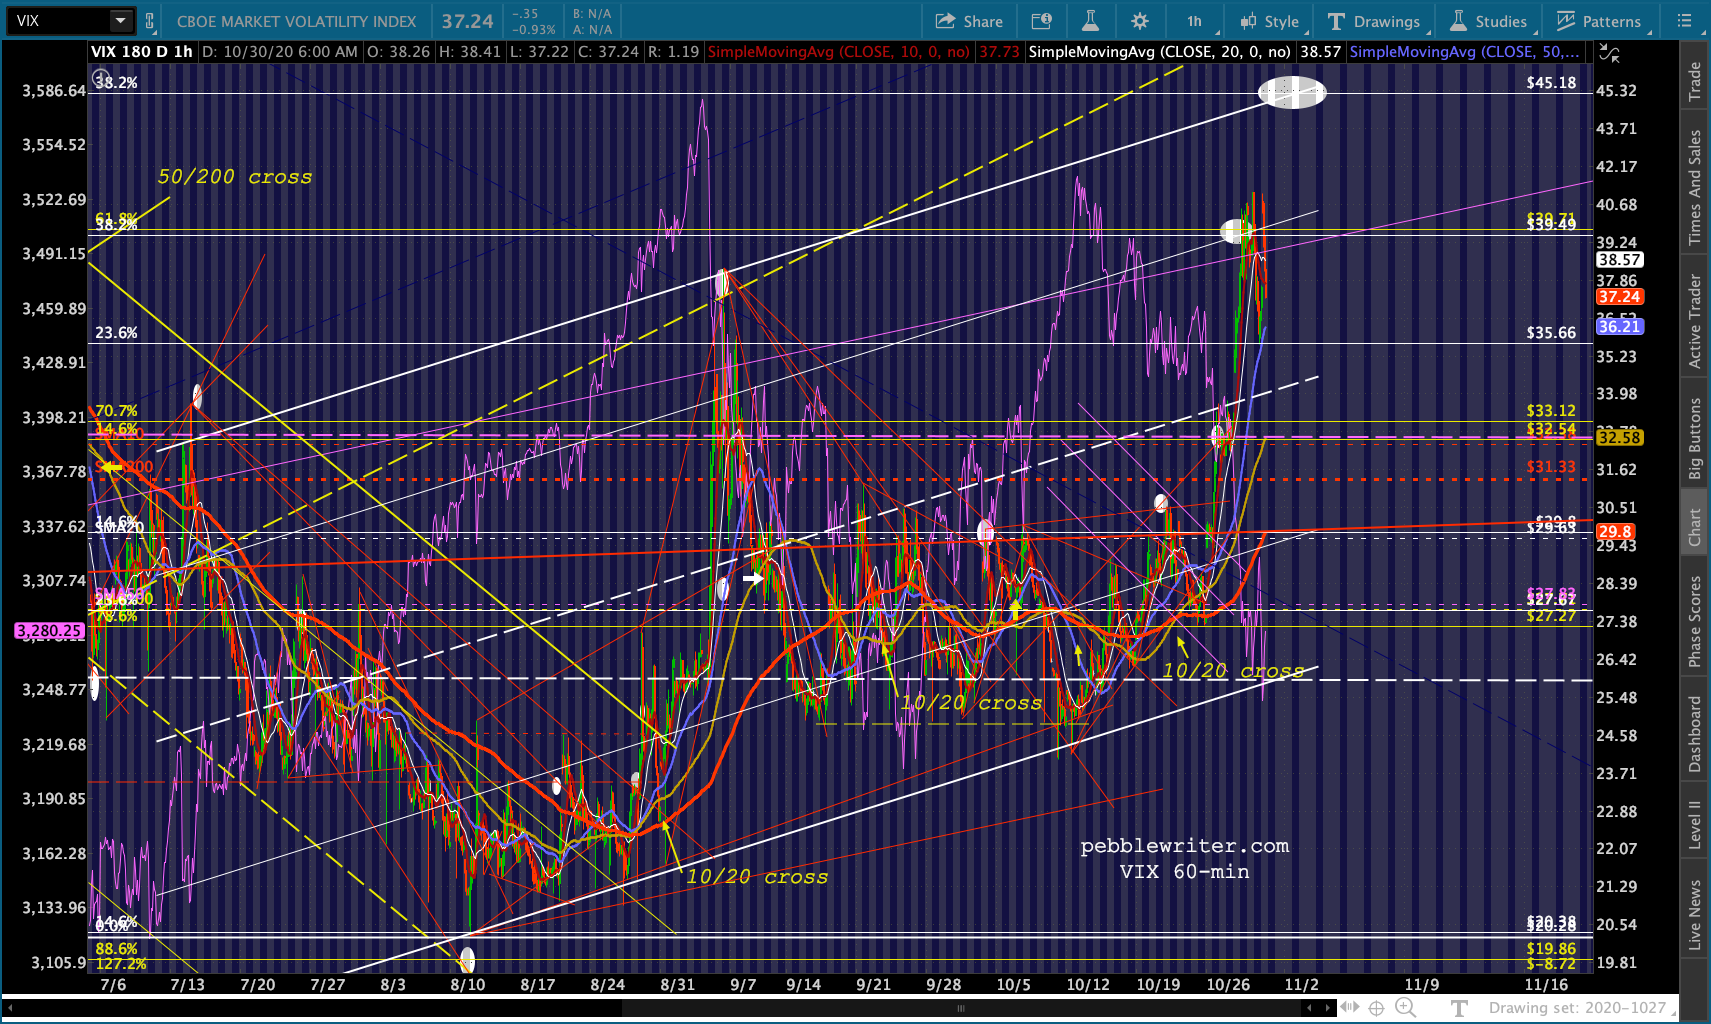
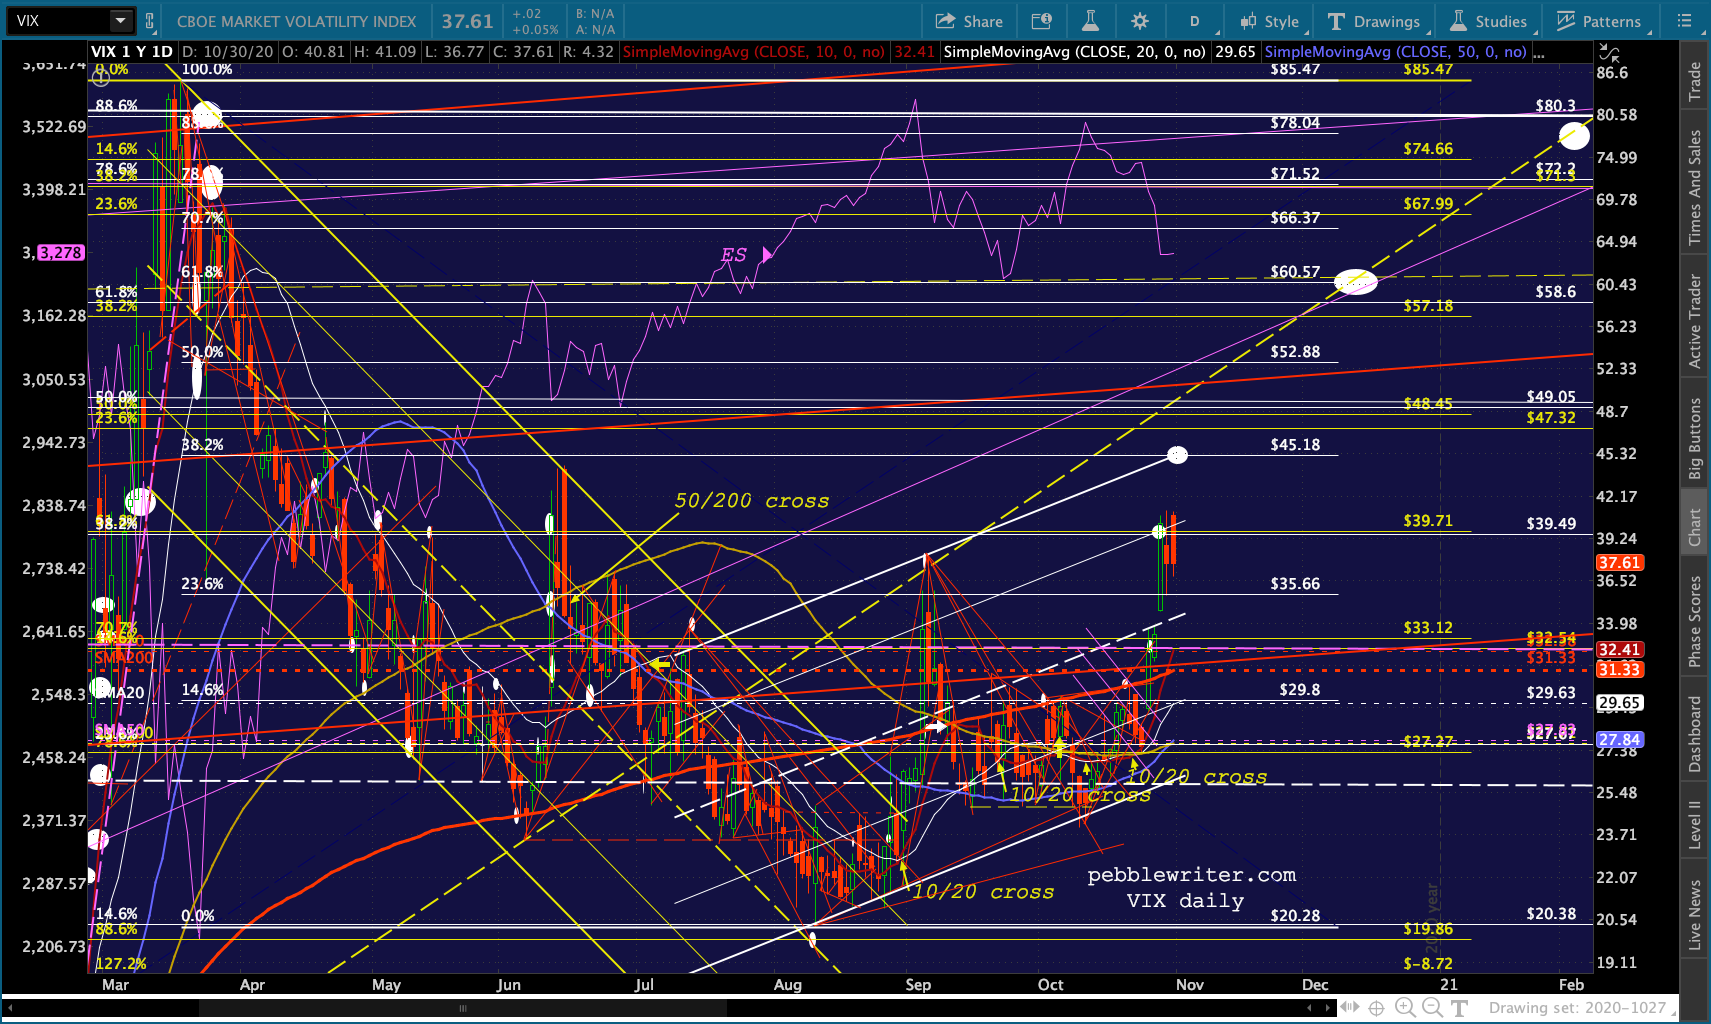 RSI would seem to indicate it might have already topped out. But, previous peaks in VIX daily RSI have preceded the price top by a day or so. In other words, there’s at least a 50:50 chance it’ll reach 45.18 in the next session or two. And, the .618 and higher Fib retracements await a tag starting around Dec 9-11.
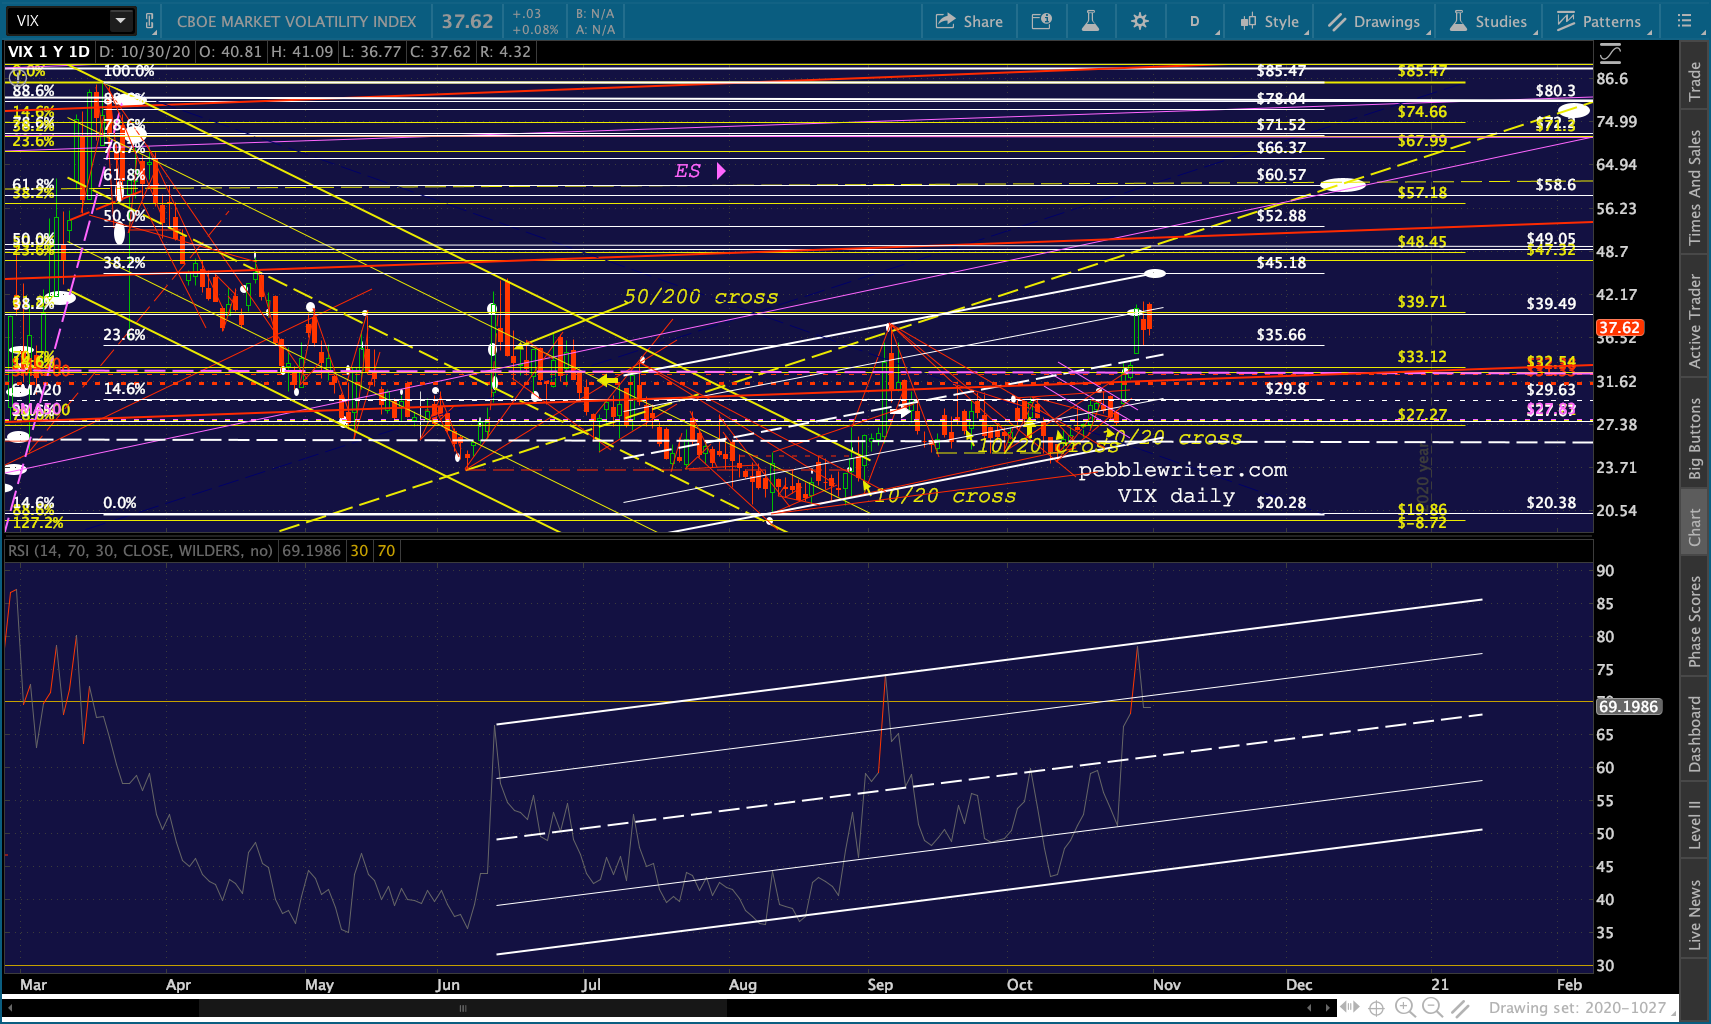 Remember, DJIA never did tag its falling SMA200, now at 26,214.48.
 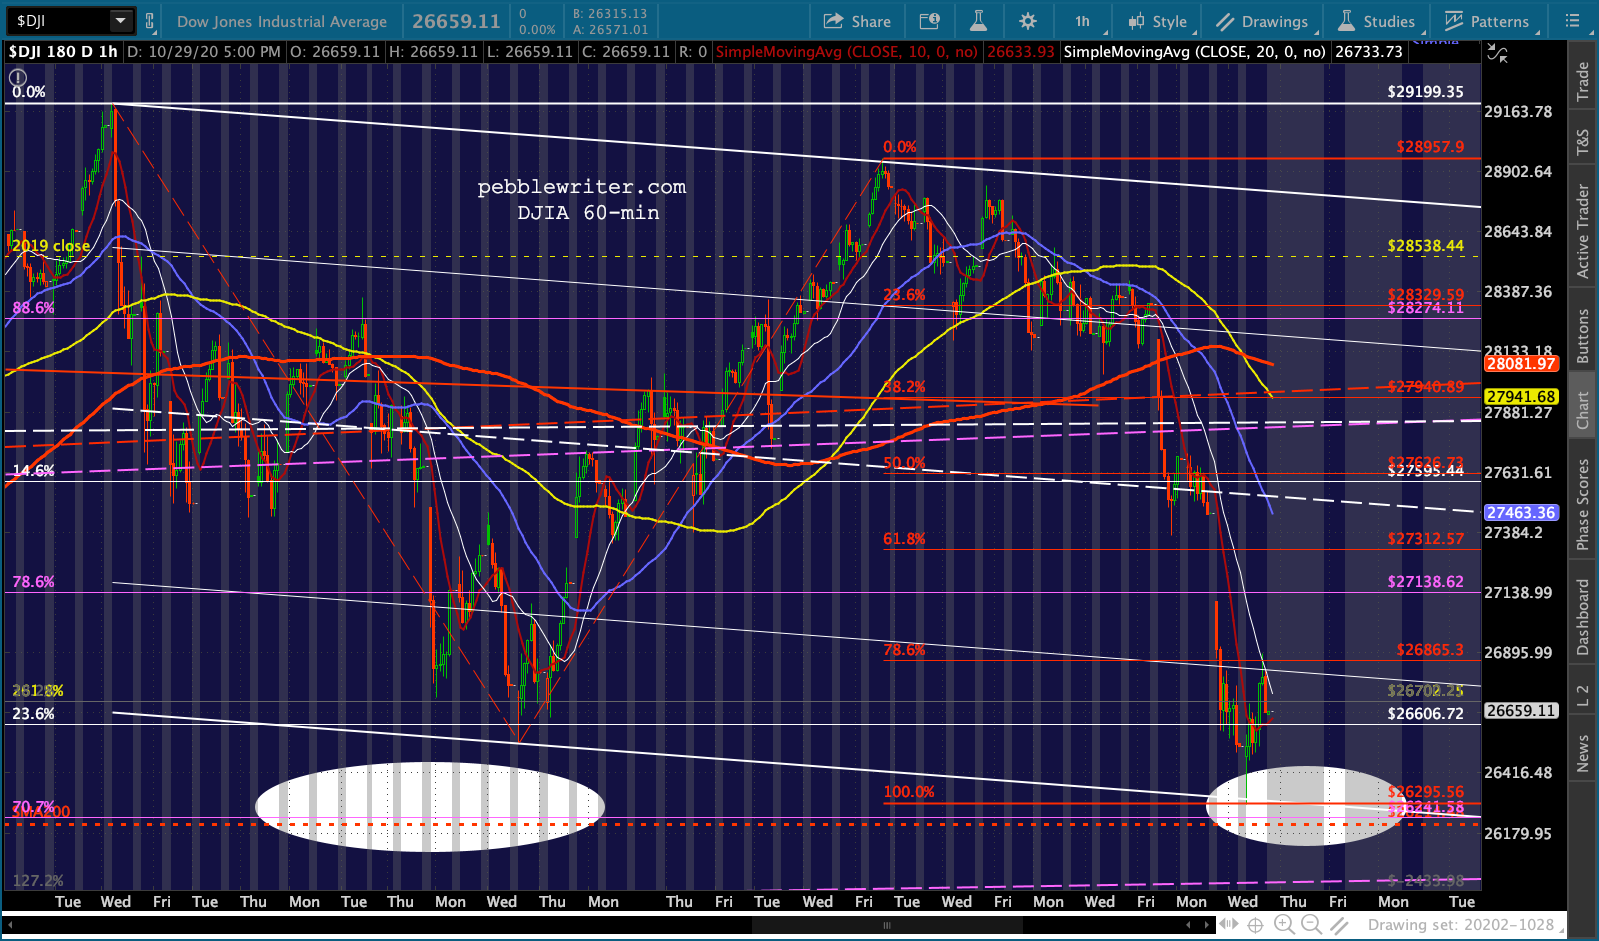 I still love the idea of COMP tagging its SMA200 once it reaches the old highs at 9838.37.
 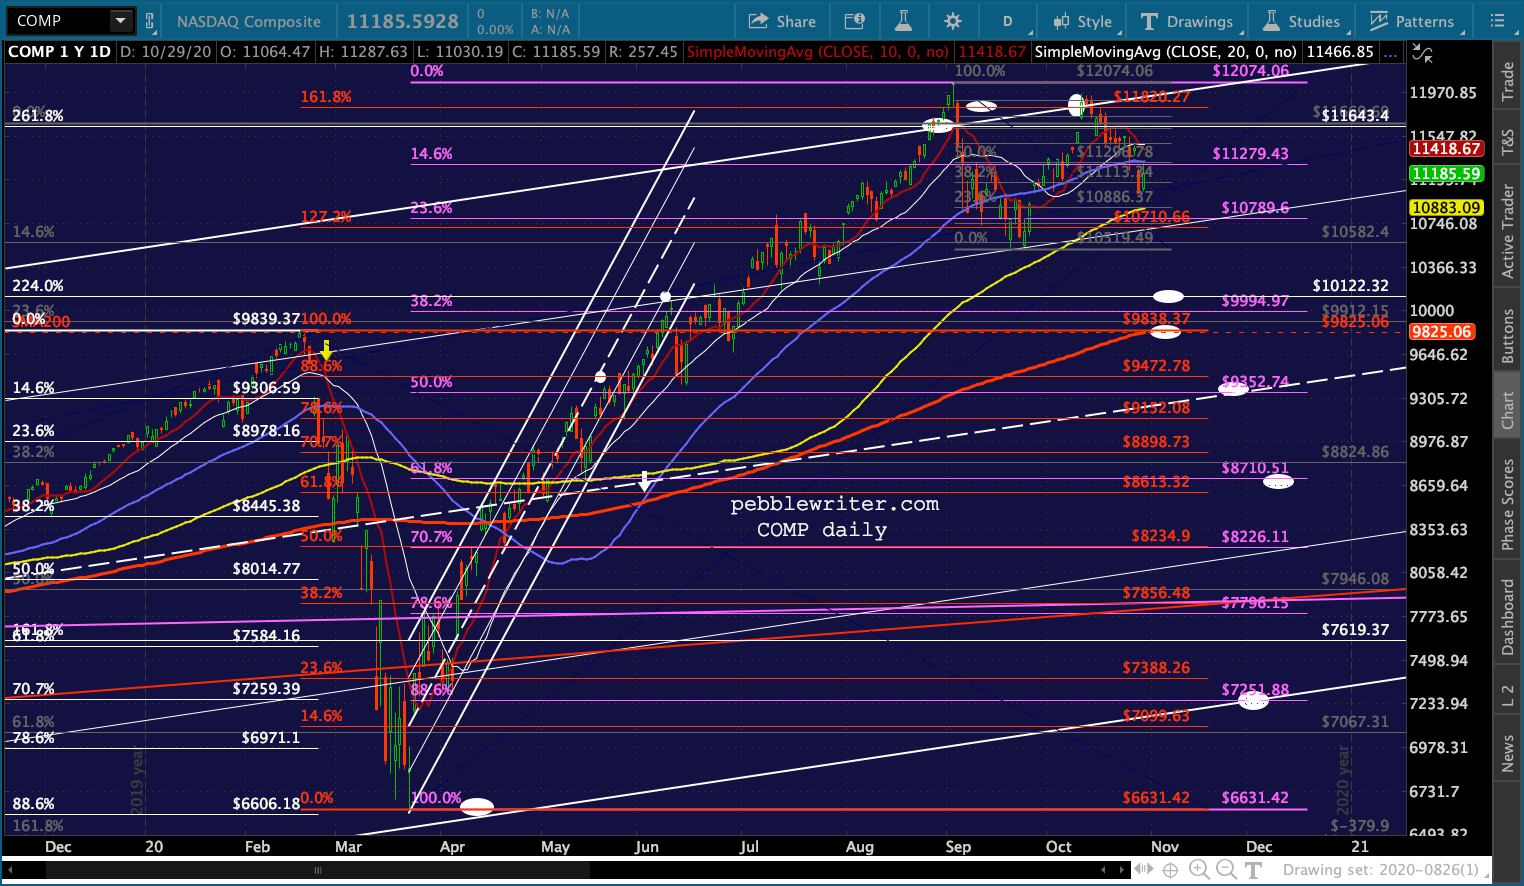 And XLF, which continues to bounce on bumps in interest rates, is on the razor edge of a sizable drop that would suggest another 11.9% downside for a total of 21.8% since the June highs.
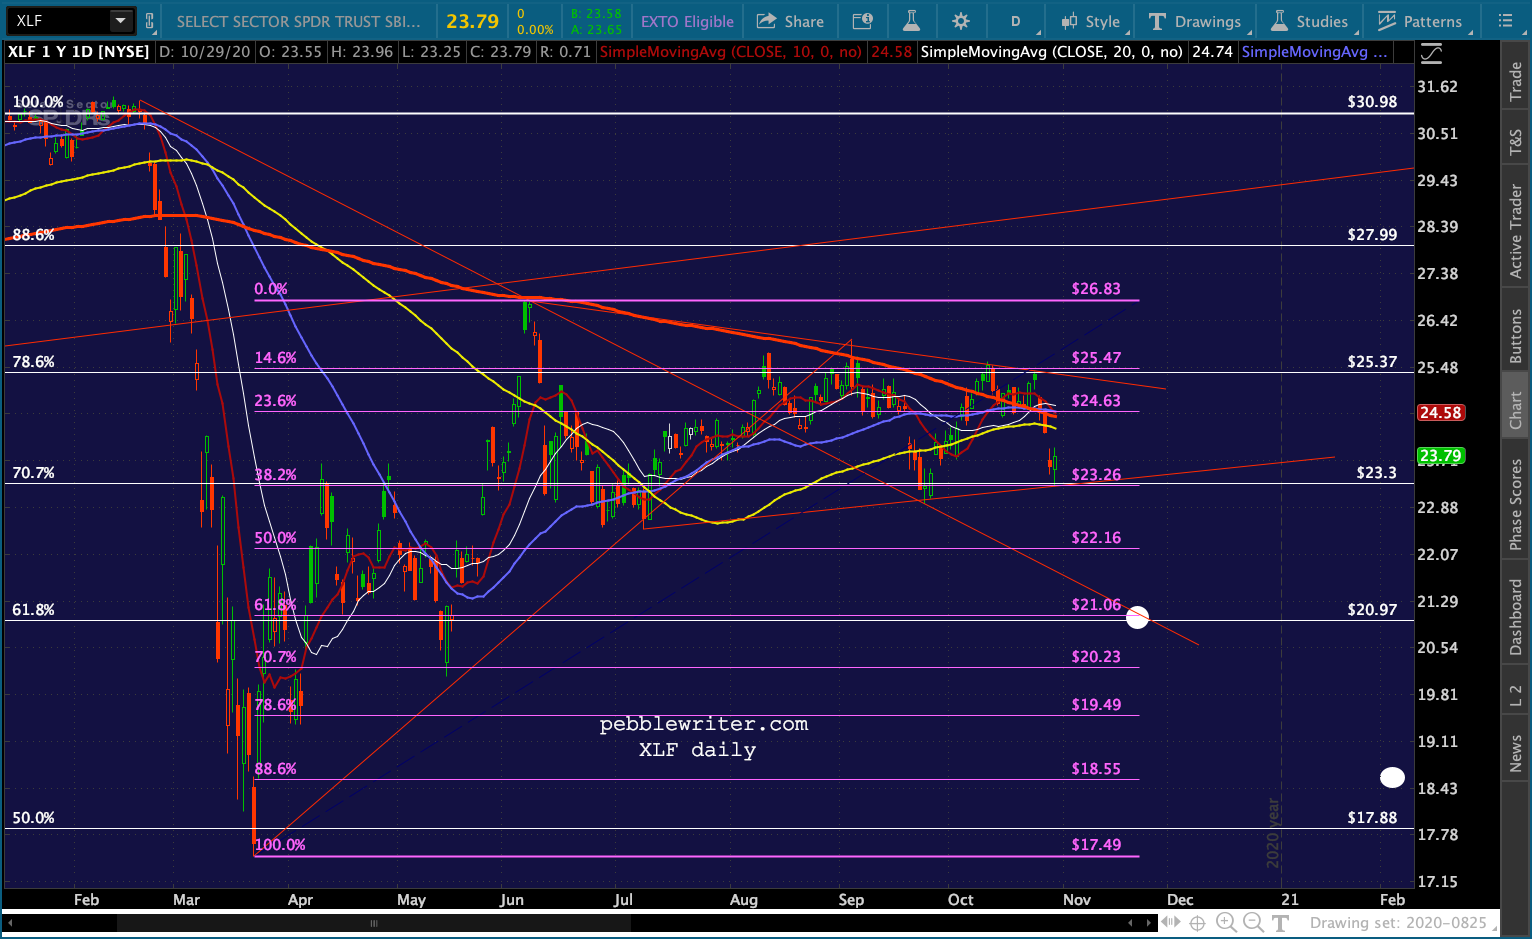 Oil and gas reached our downside targets yesterday and, so far, have managed to hold the line. There’s still a chance of lower – particularly in CL – next week. So, I’d be very cautious playing the bounce. Stops are your friend.
 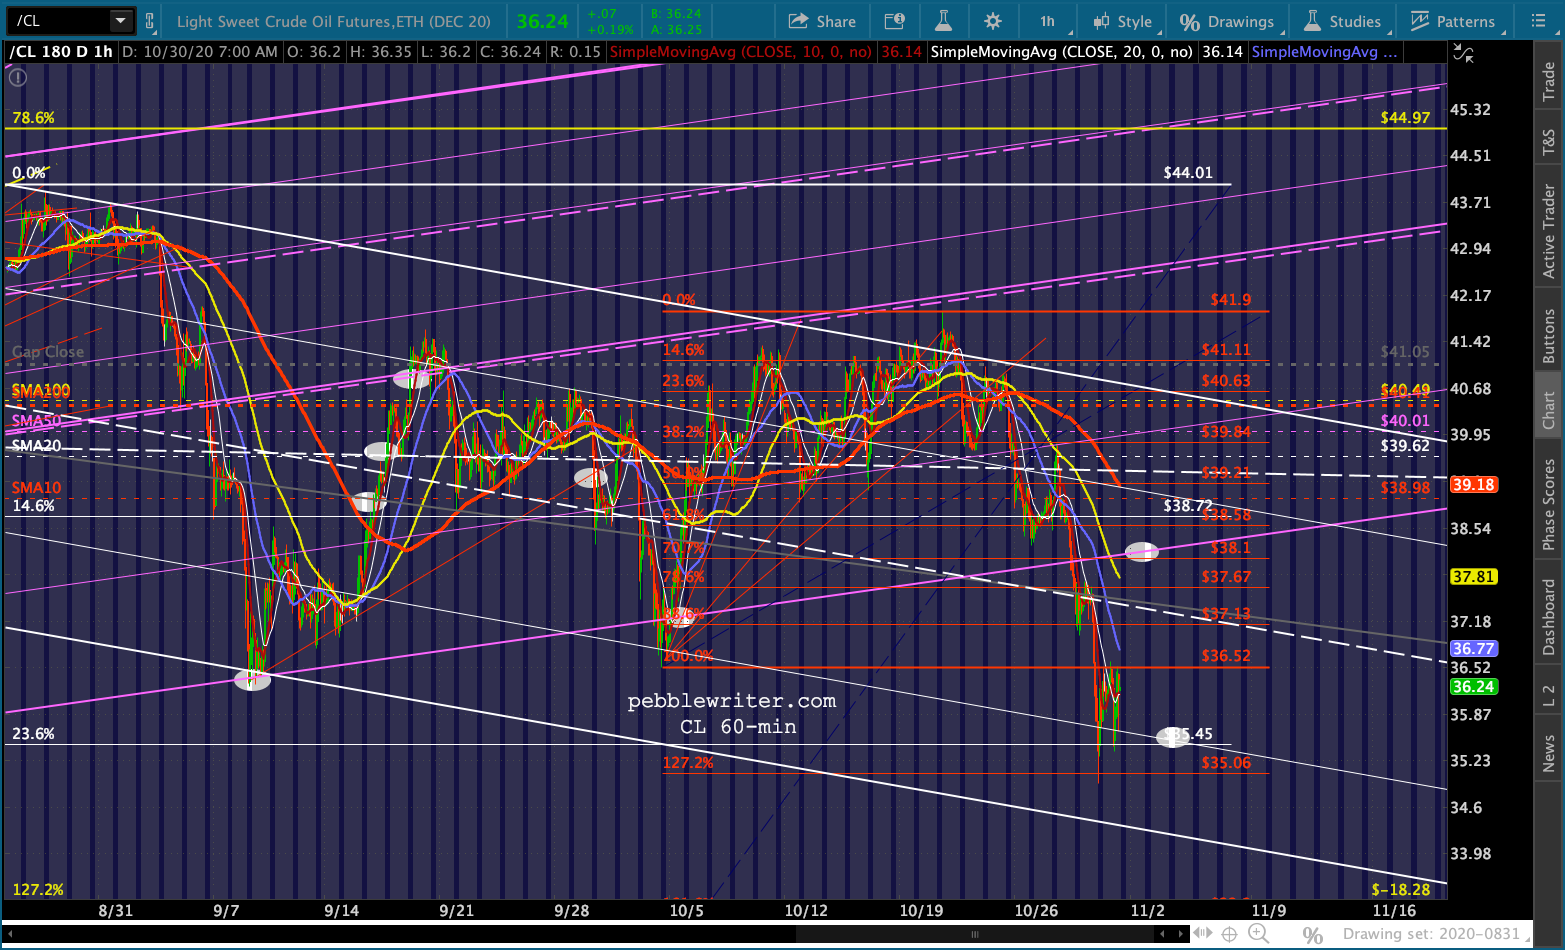 RB got all the way down to the channel bottom and just above the psychologically important 1.00 mark (1.0049.) So, while a dip to .9949 next week is still a good possibility, it could come and go pretty quickly.
 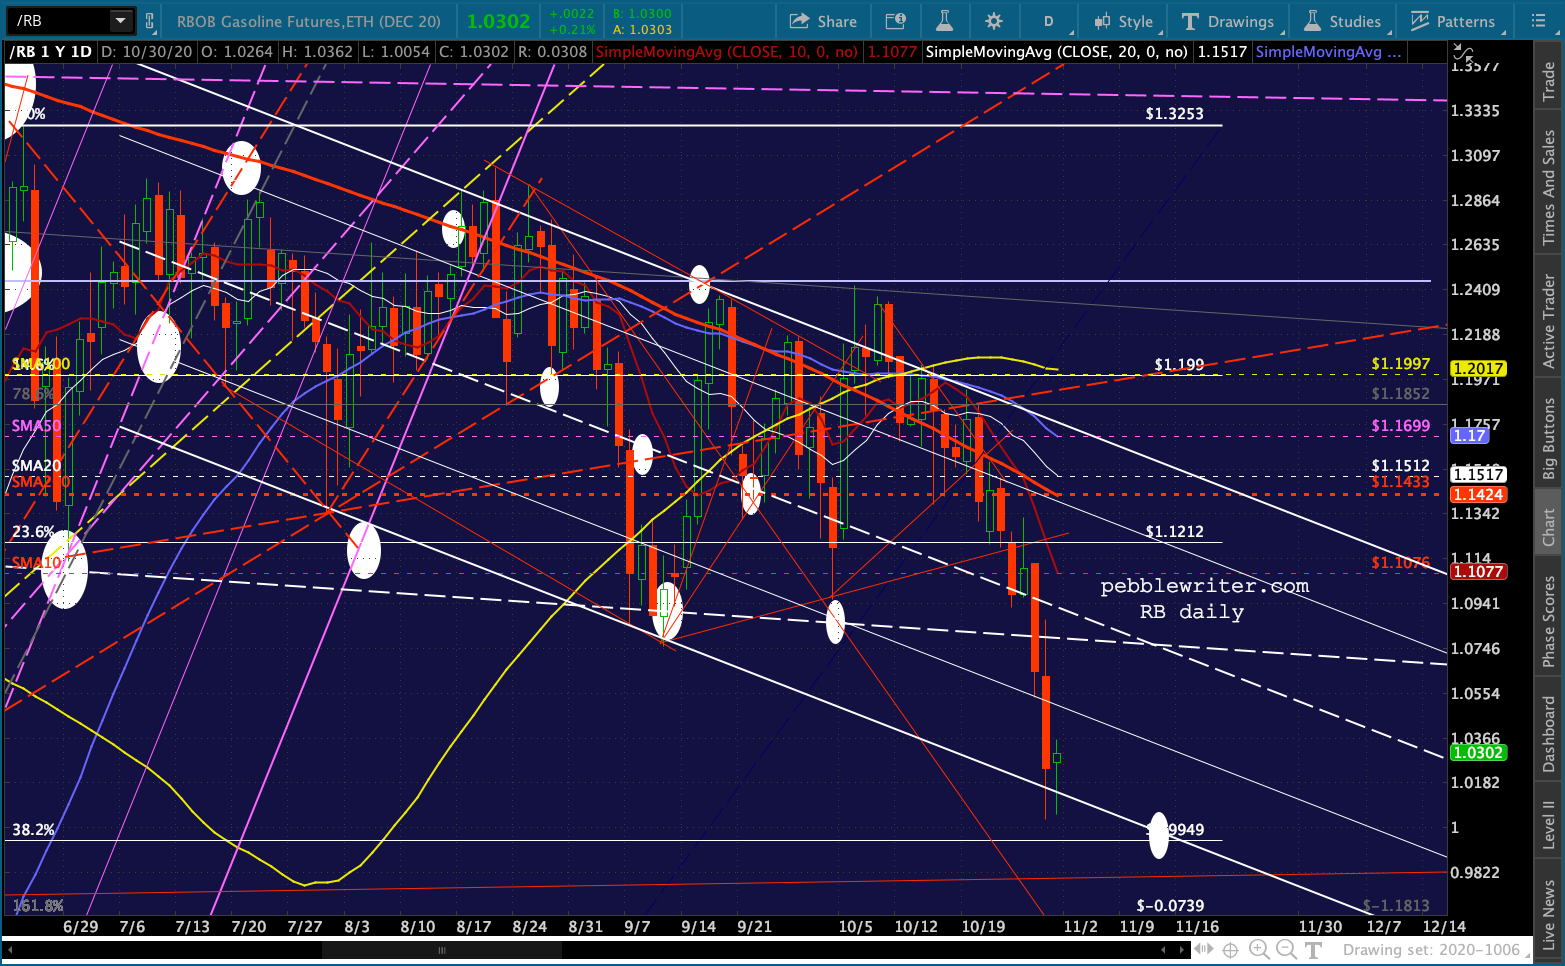 For the time being, currencies are putting the brakes on further equity downside. USDJPY has held its Sep lows…
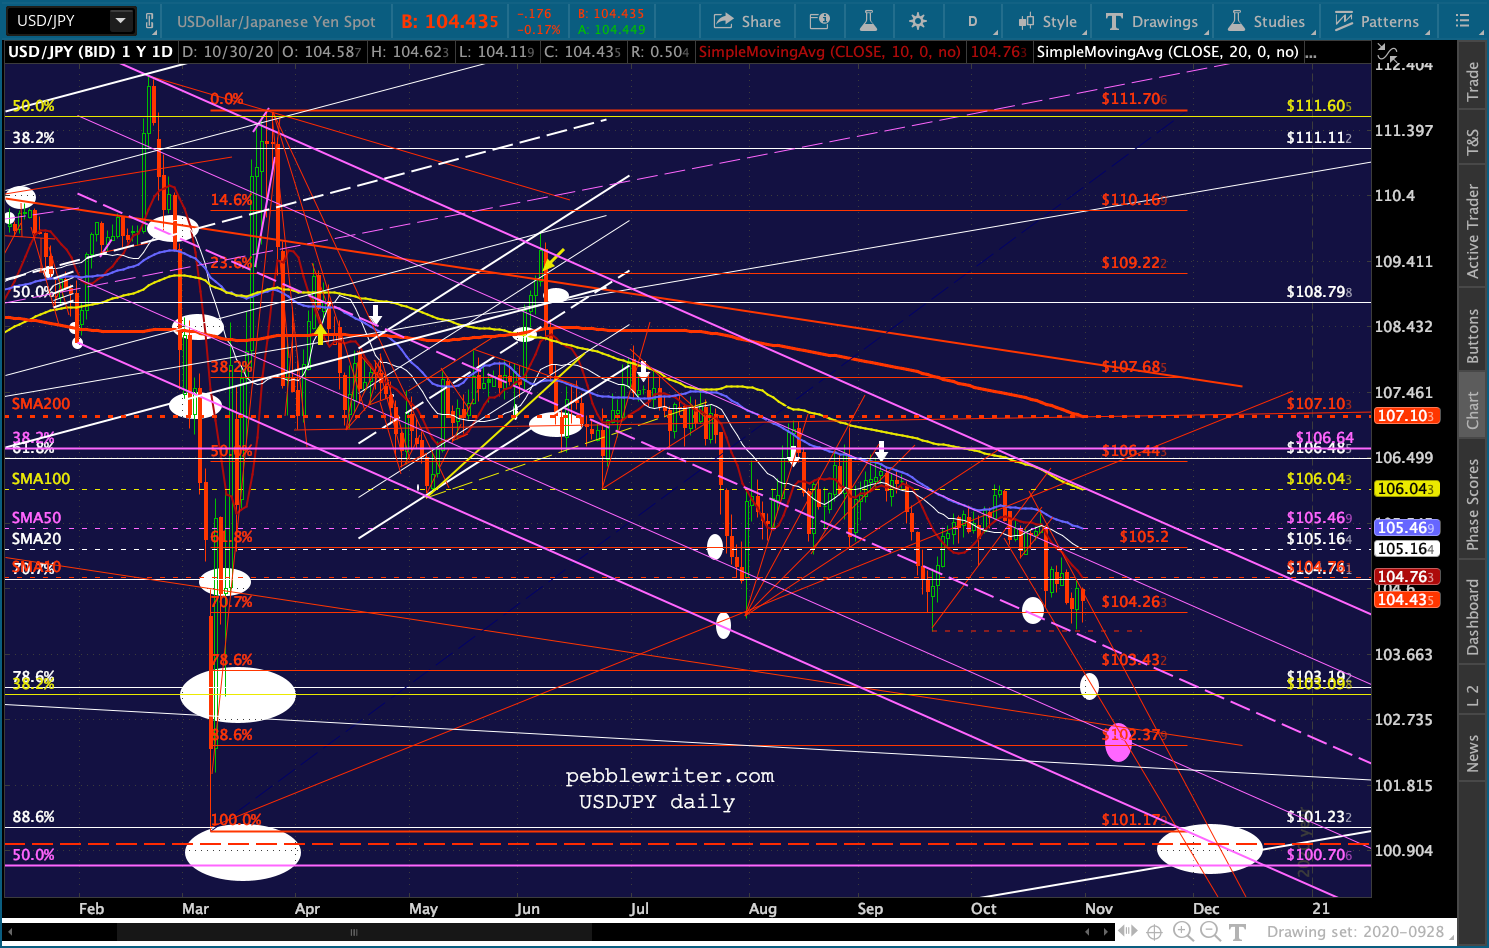 …while EURUSD is getting a bounce at its SMA100…
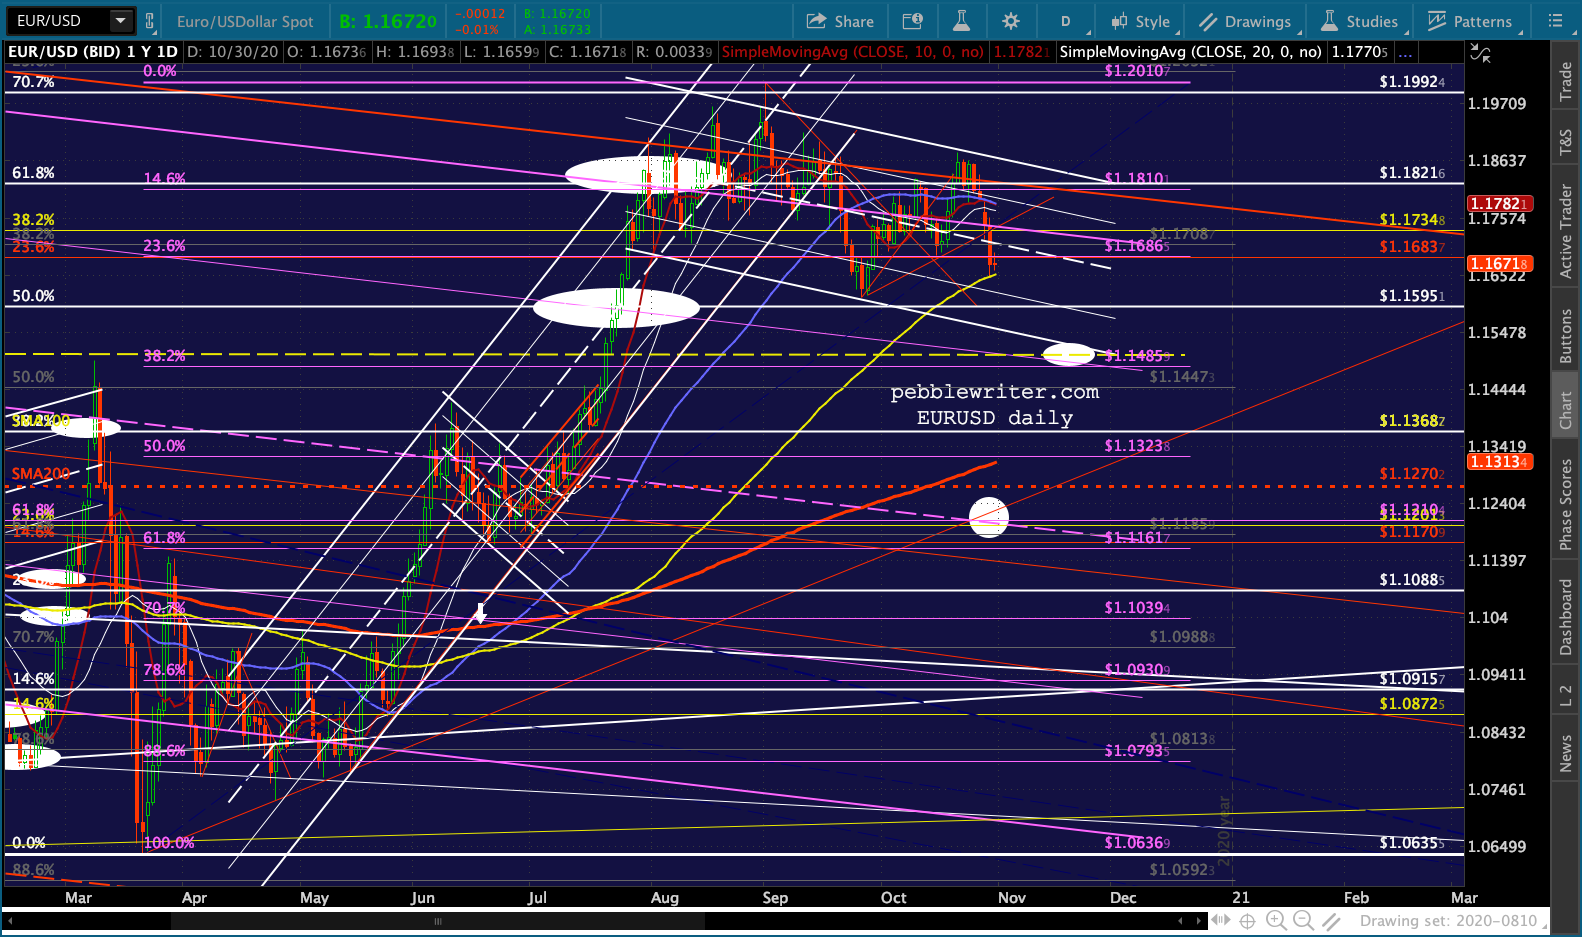 …and, DXY has broken out somewhat…
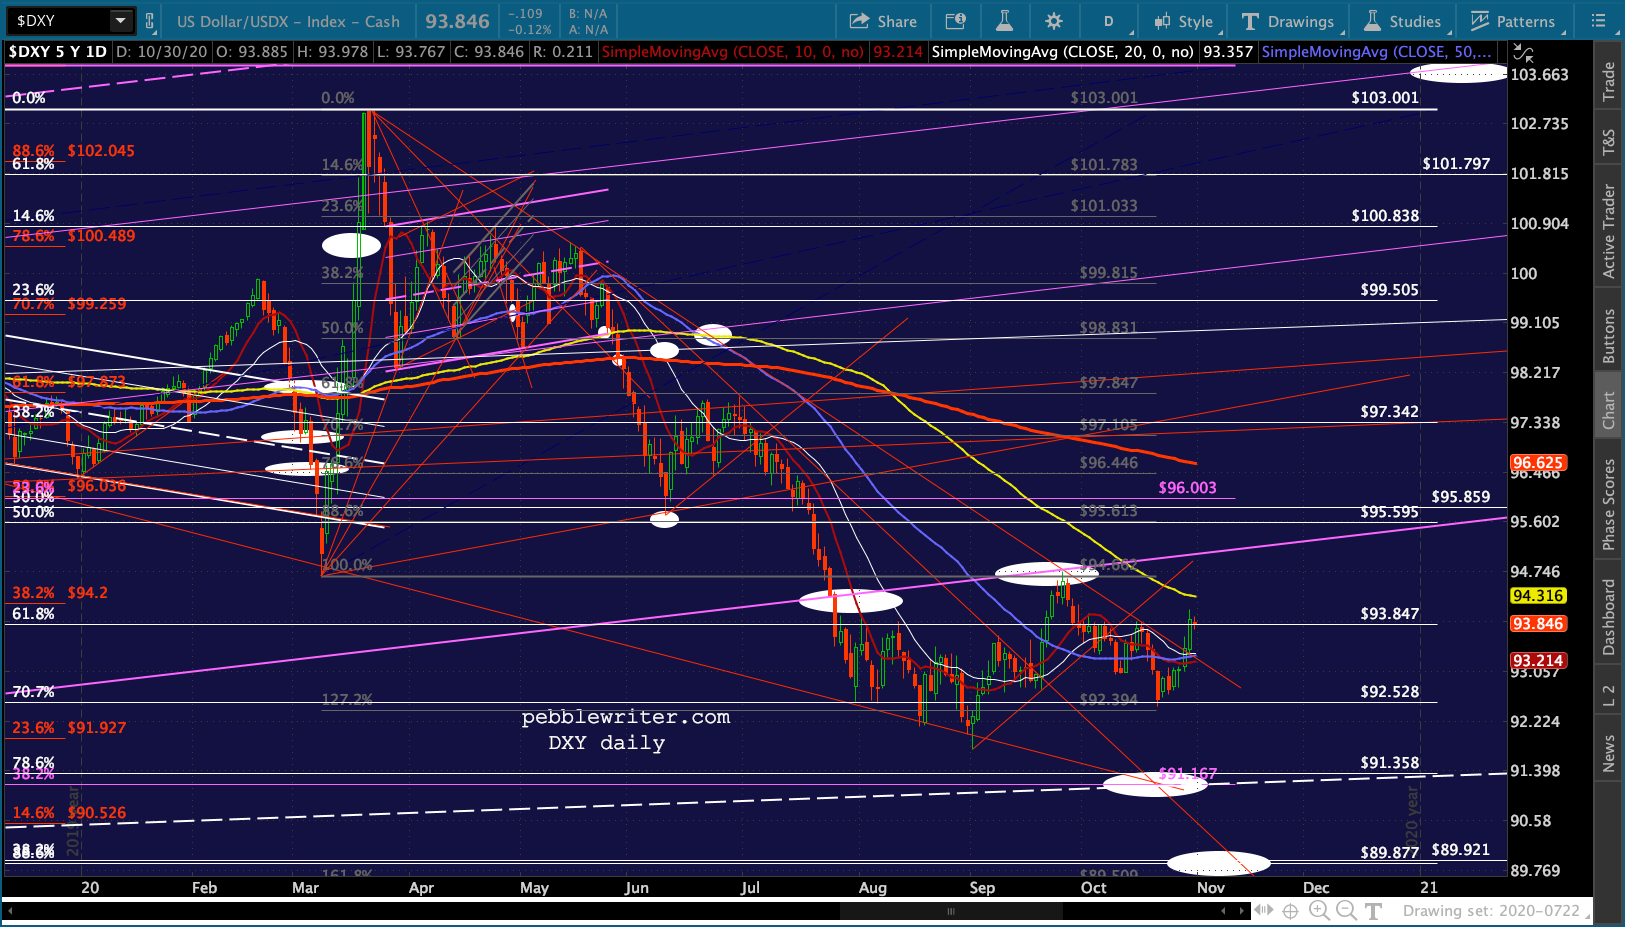 …as TNX rallied to close Monday’s gap.
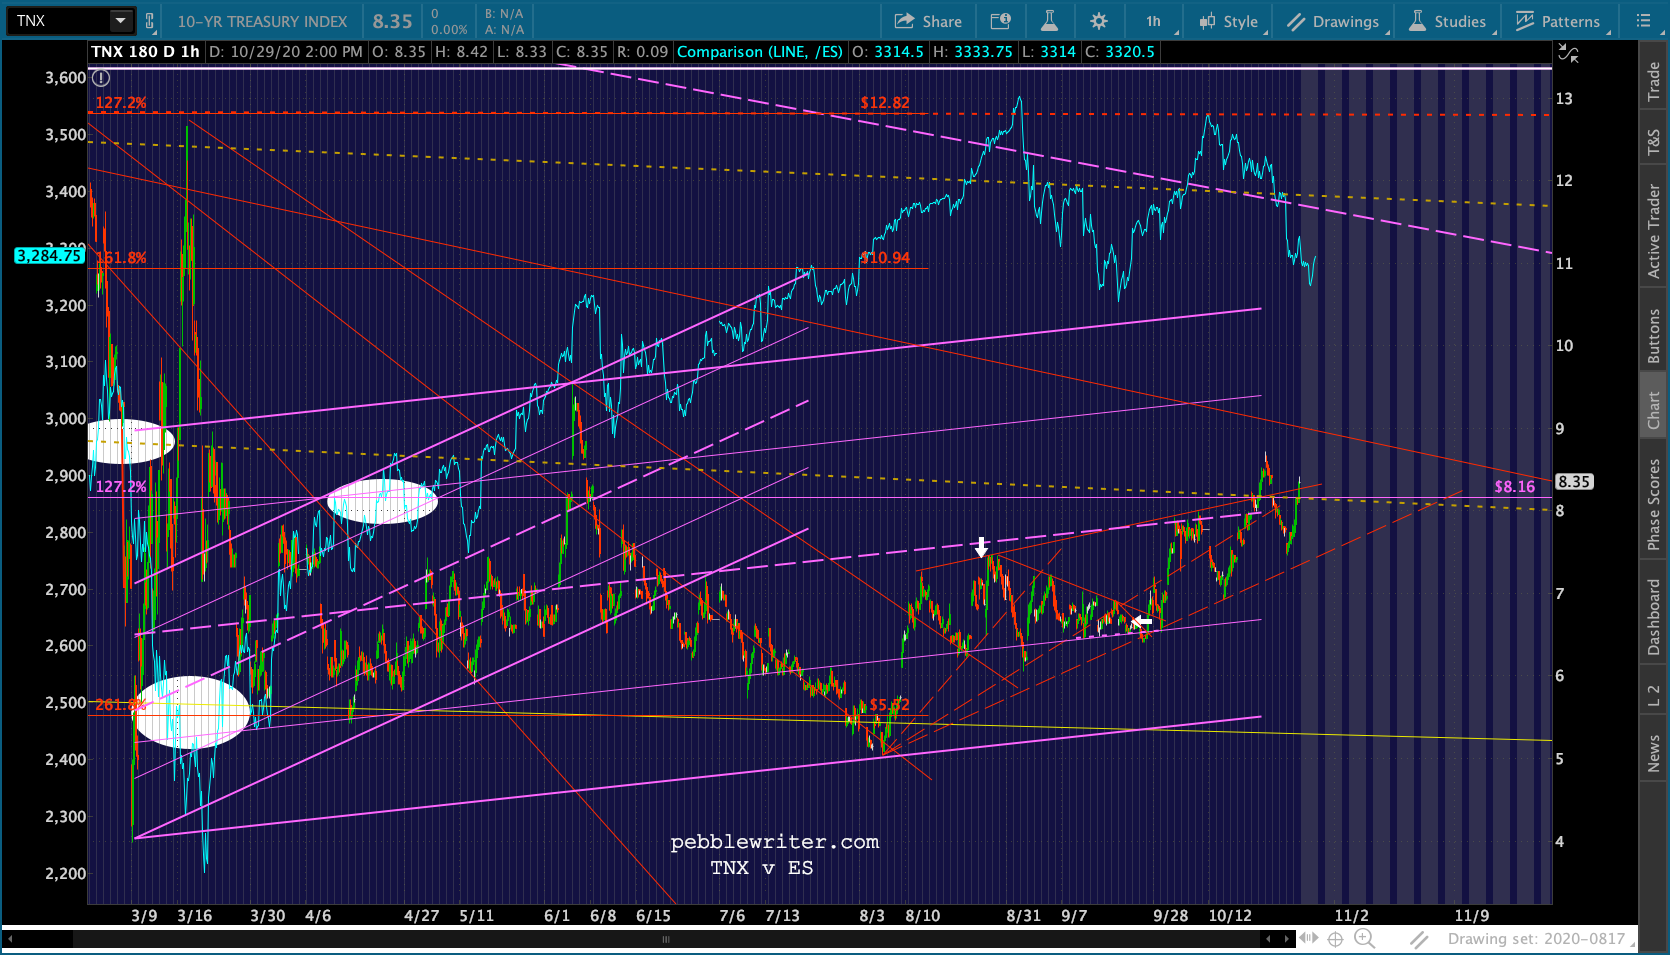

 This has put 2s10s back at the threshold of a breakout – very dangerous for stocks.
 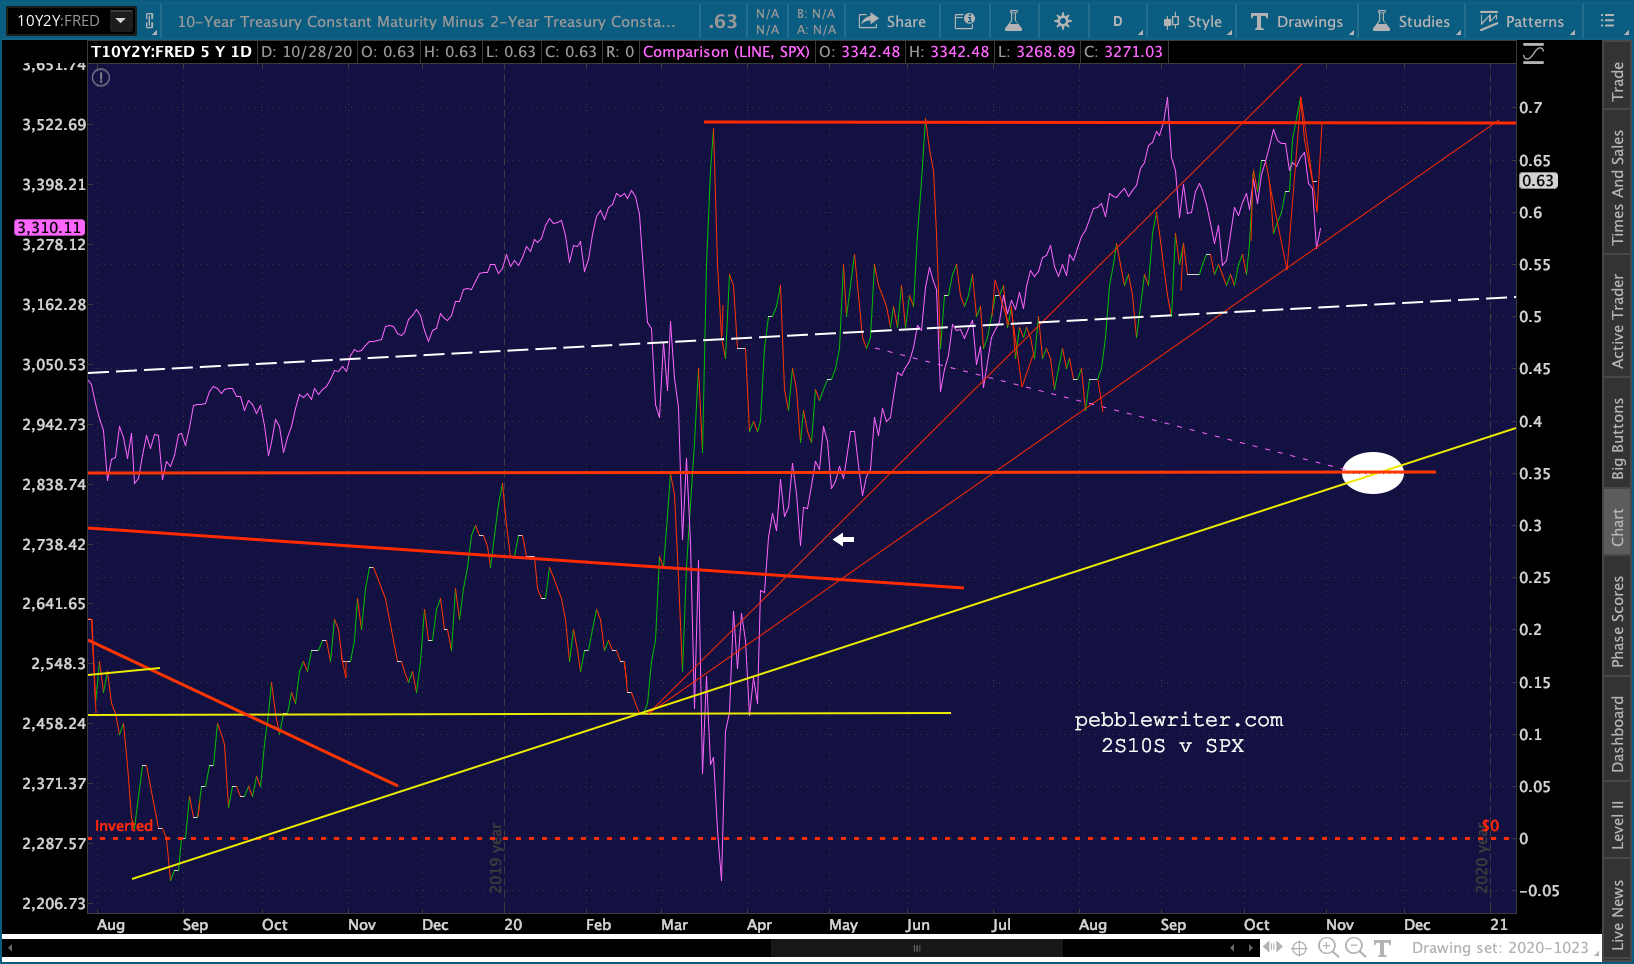 EURUSD’s bounce has provided a respite for GC and SI. It remains to be seen whether GC can push back above its twin midlines after experiencing a bearish 10/20 cross…
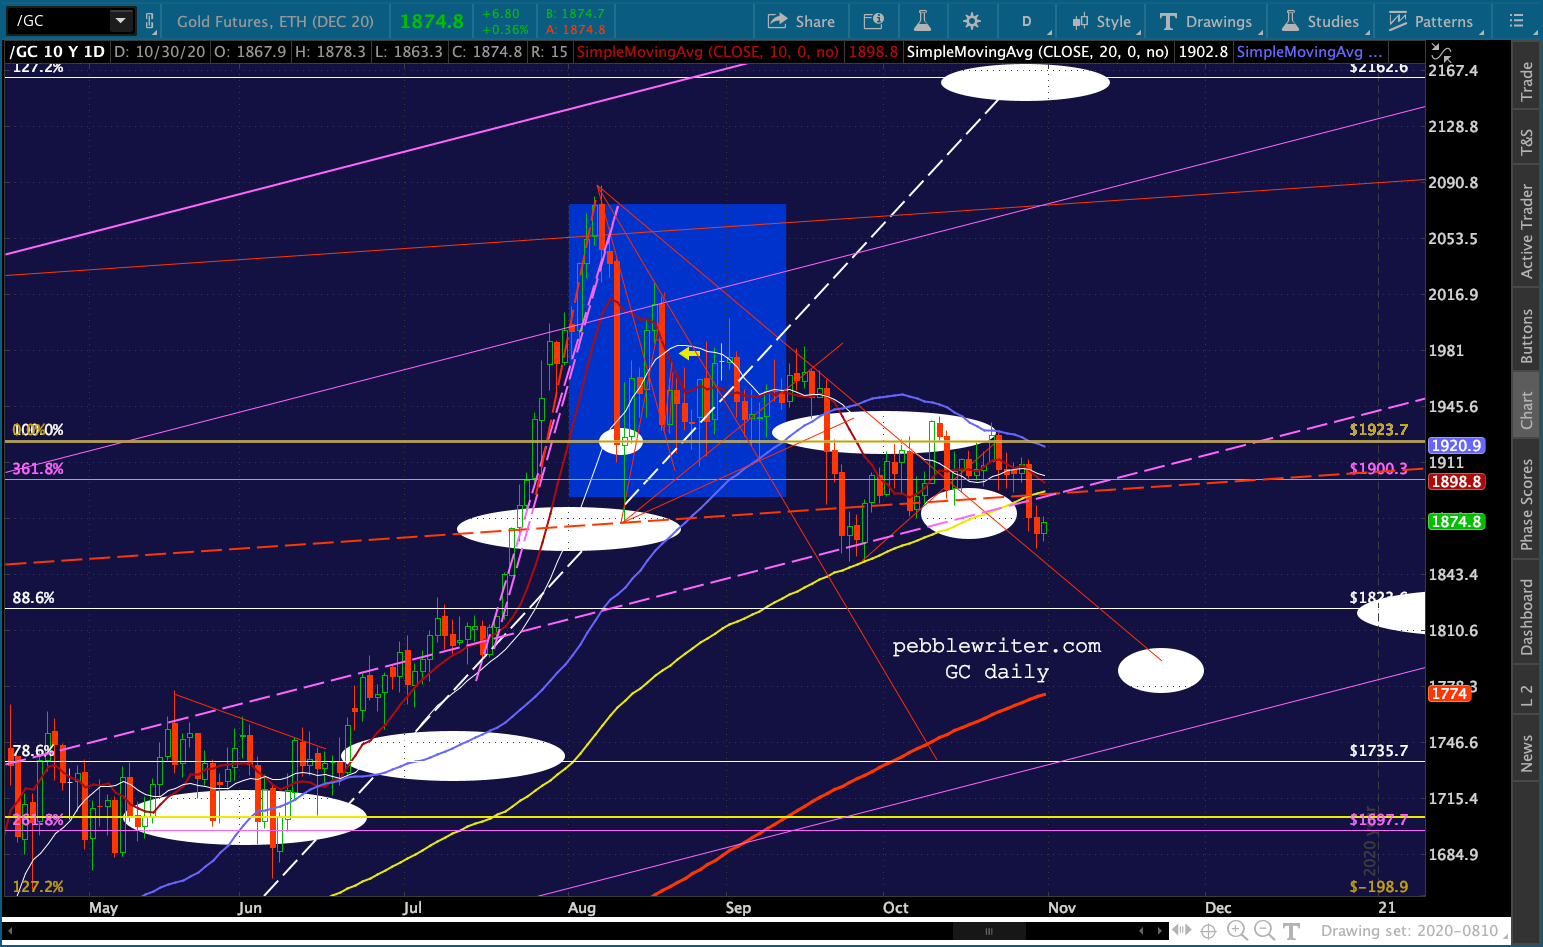 …or SI can stave off a drop to its channel bottom.
 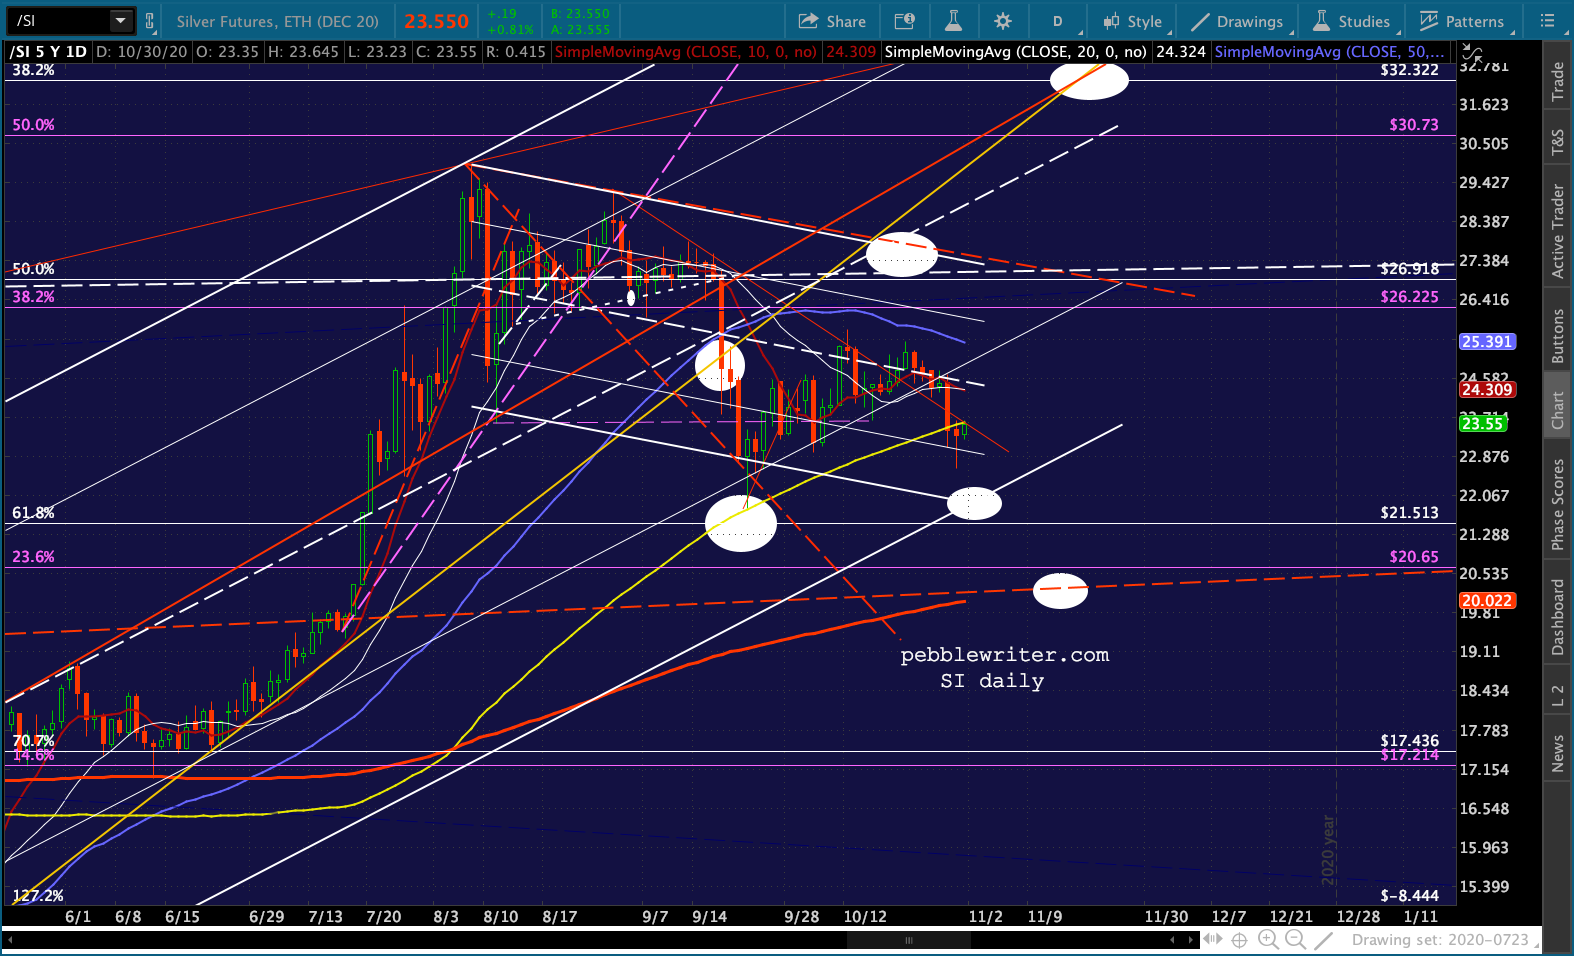 Both are hinting at SMA200 backtests in mid-November.
UPDATE: 12:24 PM
As I mentioned yesterday, I have to peel out early today. Before I go, here’s the state of things. ES has retested its earlier lows – not much progress beyond that. 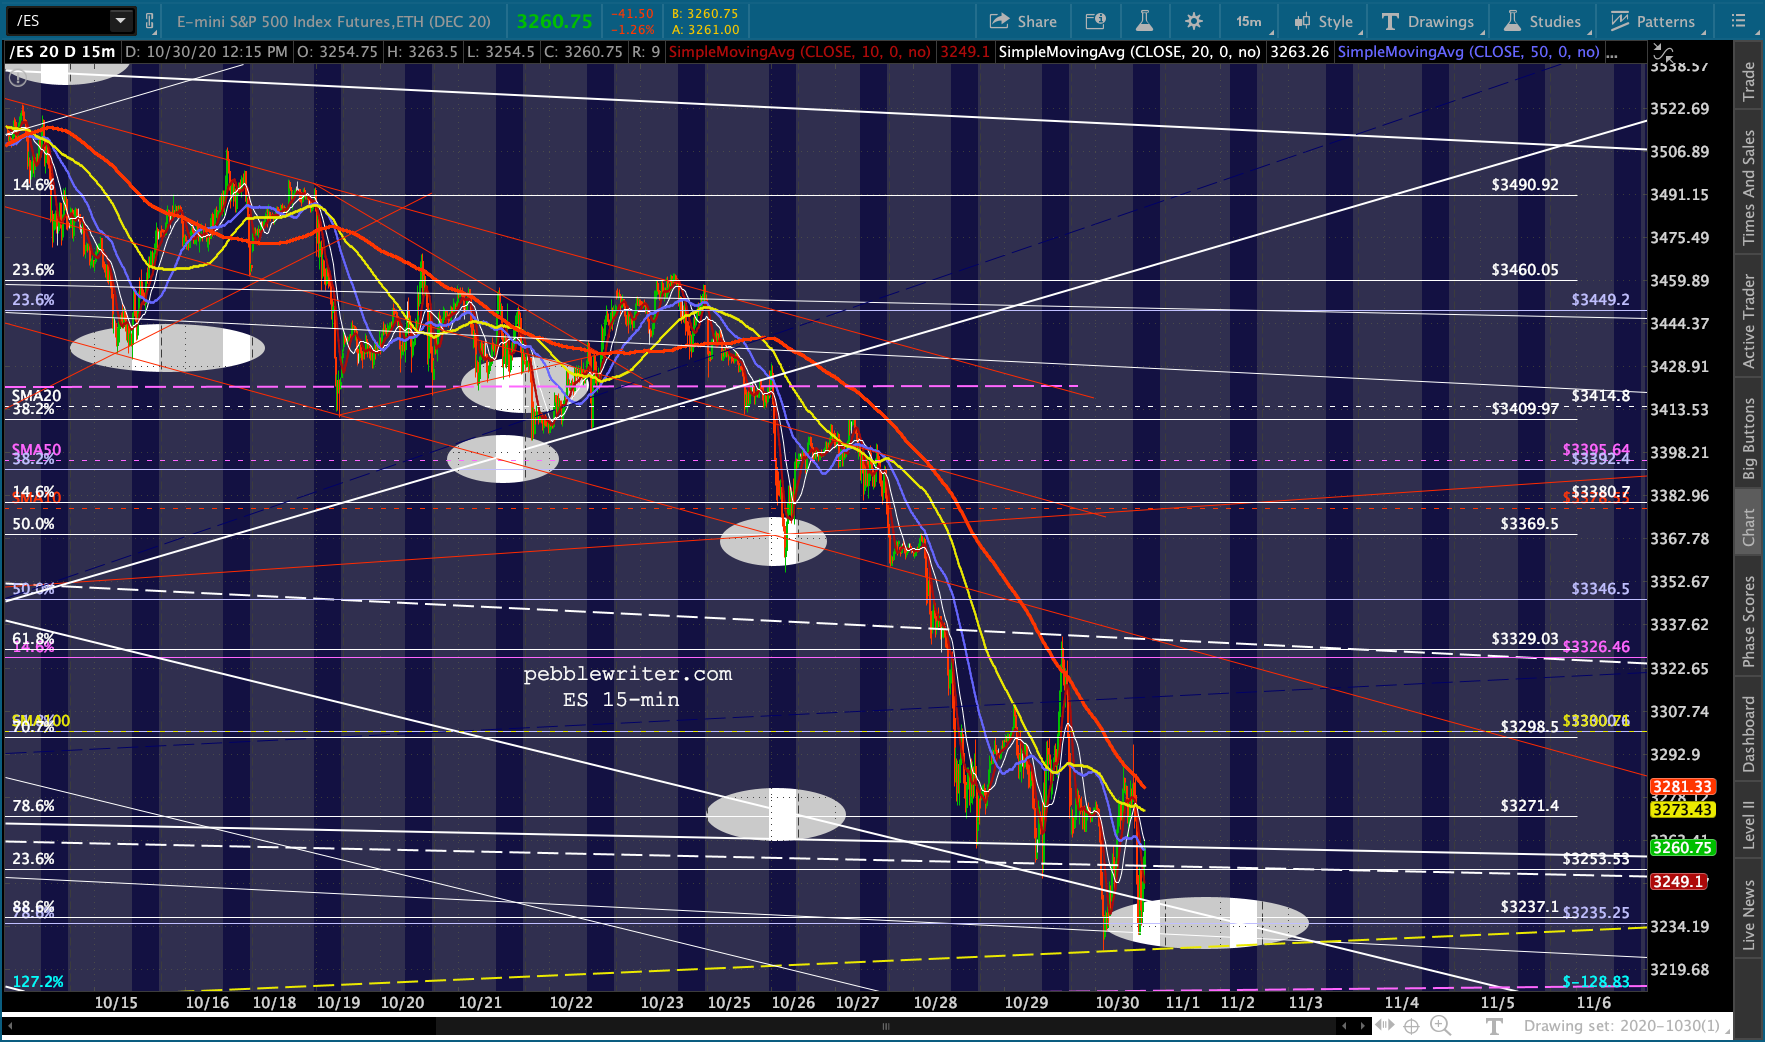 But, SPX has dipped down below its H&S neckline. A failure to rebound above it leaves our 3170 target – which would finally backtest its broken white channel – very much in play.
 Have a great weekend everyone.