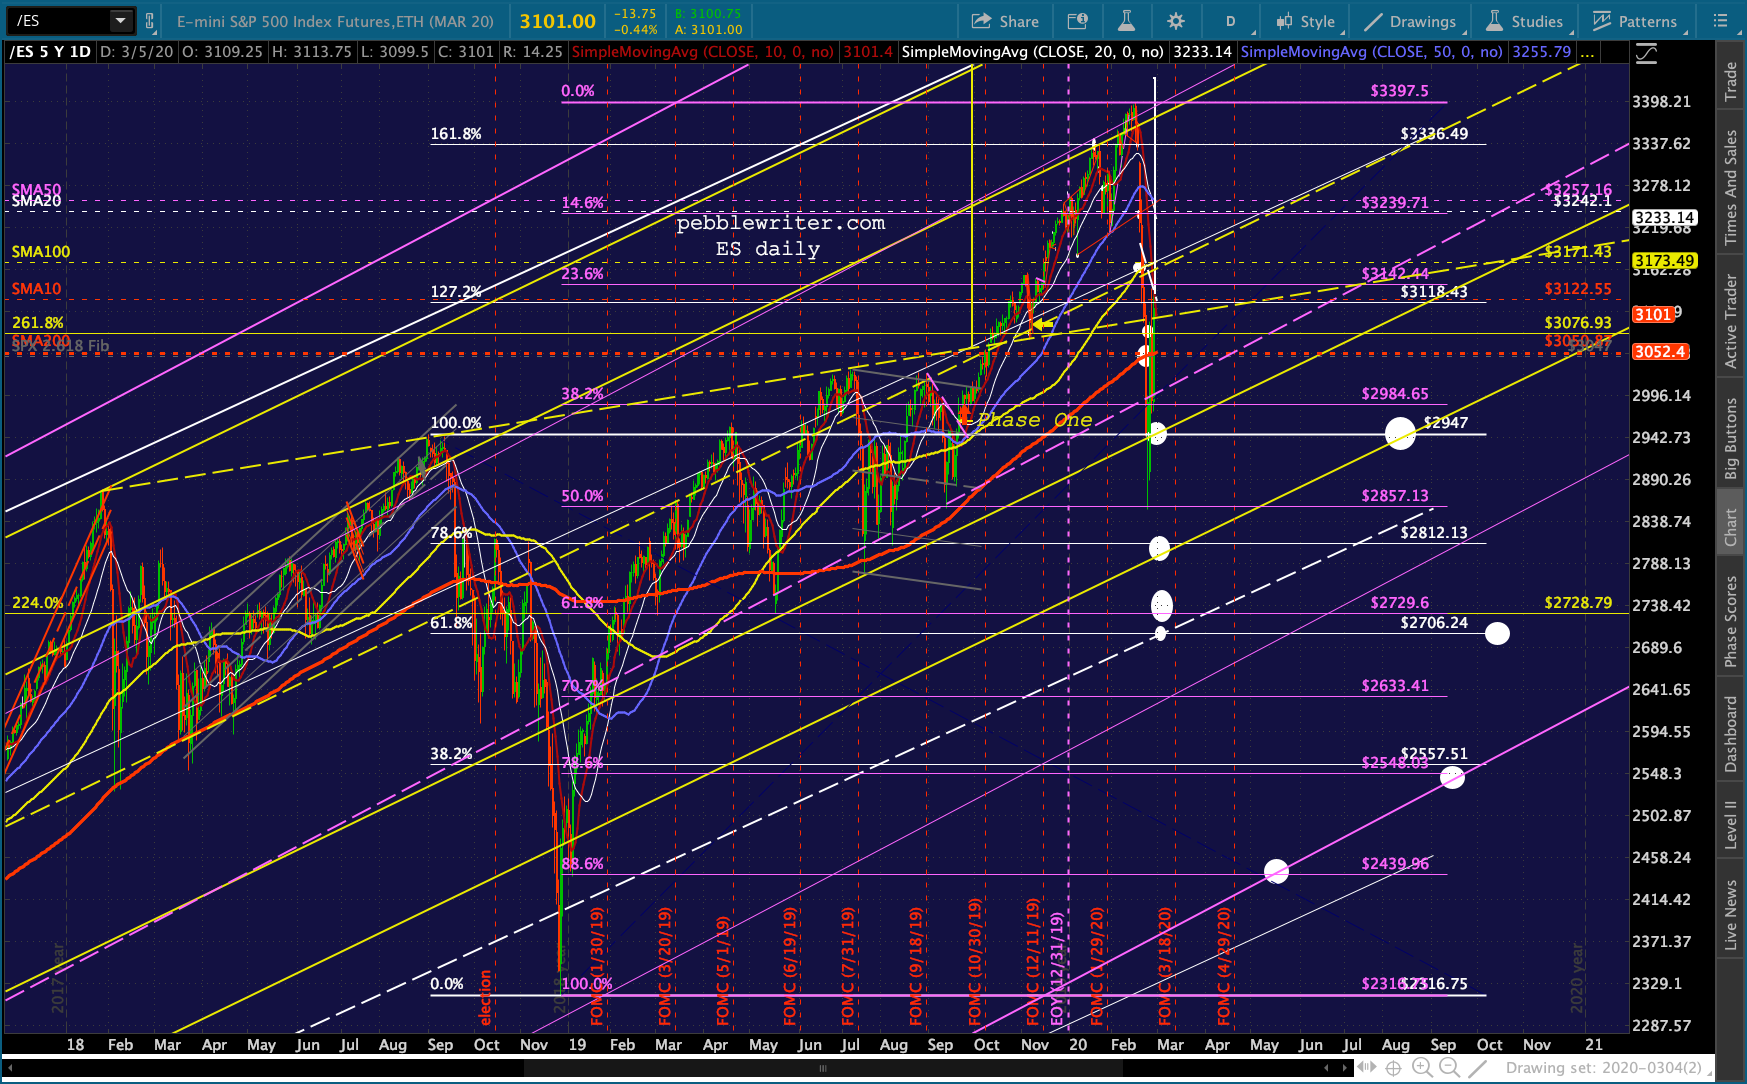
You may wake up and see futures down 60 points only to find they’re bouncing off the bottom of a rising channel and backtesting the (now) support of the 200-DMA.
 You may find that VIX remains very much under control even though a global pandemic that central banks can’t “fix” is ramping up.
 You may even find bond yields at all-time lows, but the “talking heads” insisting it’s “different this time.”
 You may ask yourself, how does this keep happening? You may ask yourself, what would it take to break the cycle? You may ask yourself, will the crash ever arrive? Glad you asked. Please read on, as this is probably the most important post I’ve written in a while.
continued for members…
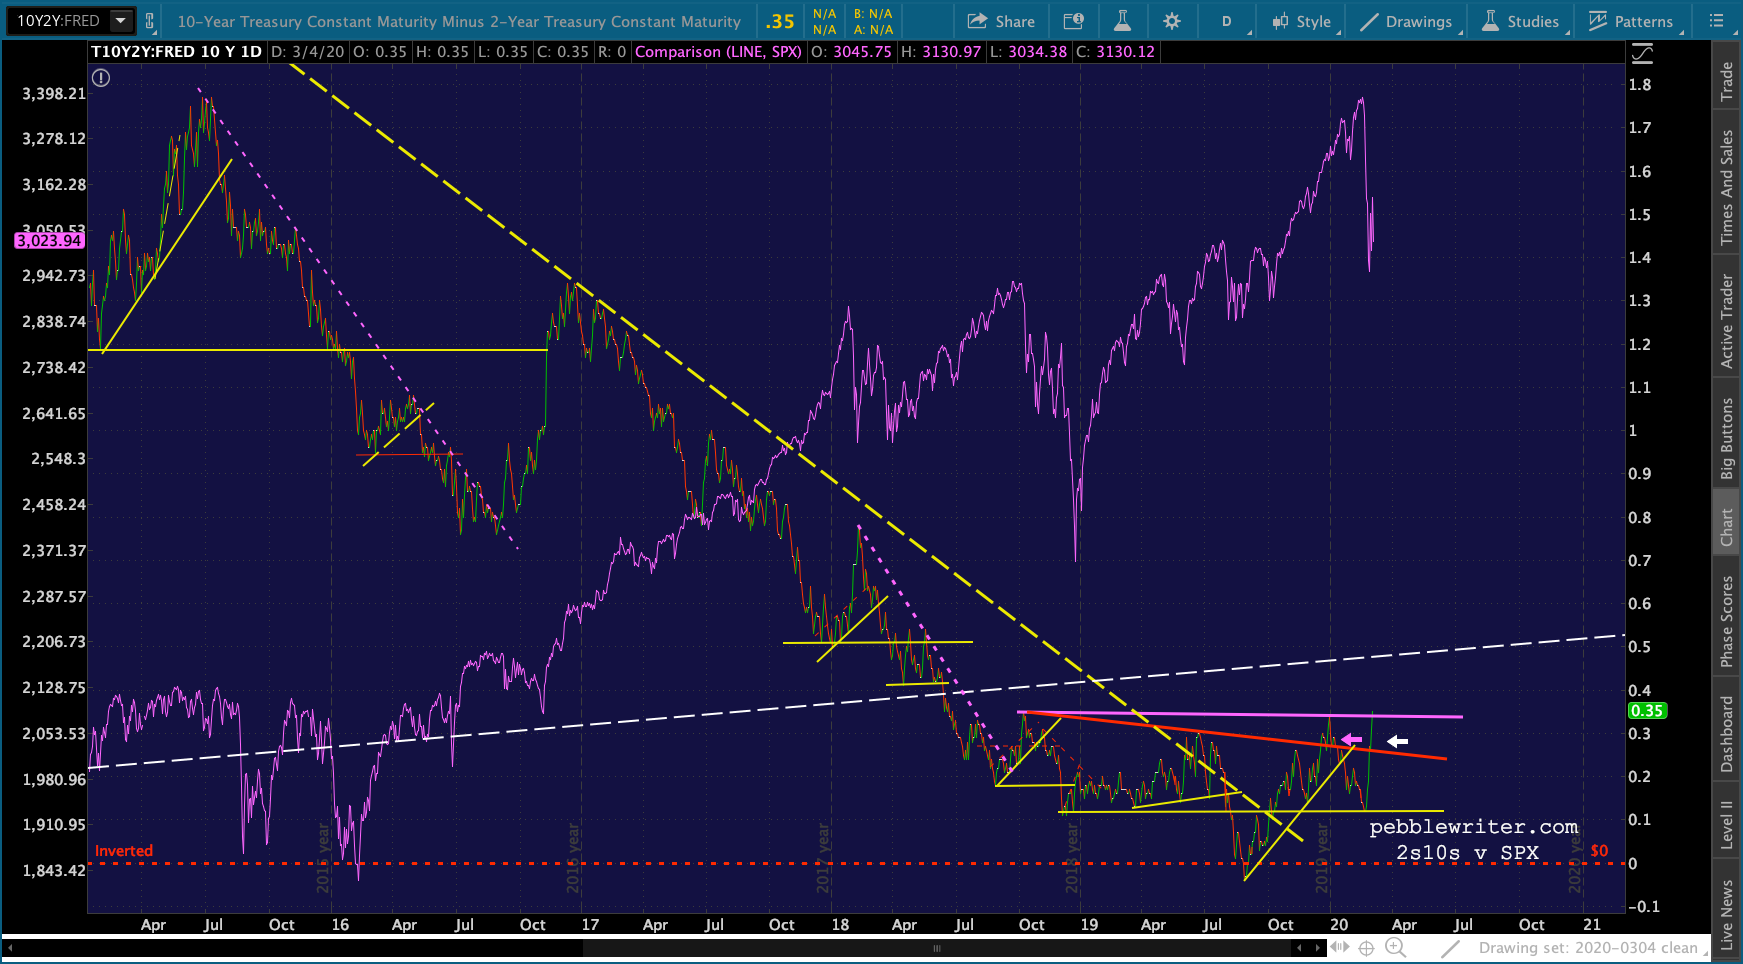
As the coronavirus ramps up, the risk is that the 2s10s blows out. How does this happen? Bottom line, the 2Y falls faster than the 10Y. And, right now, it’s threatening to do just that. Remember, every time the 2Y breaks down in a major way – whether horizontal or TL support – stocks fall.
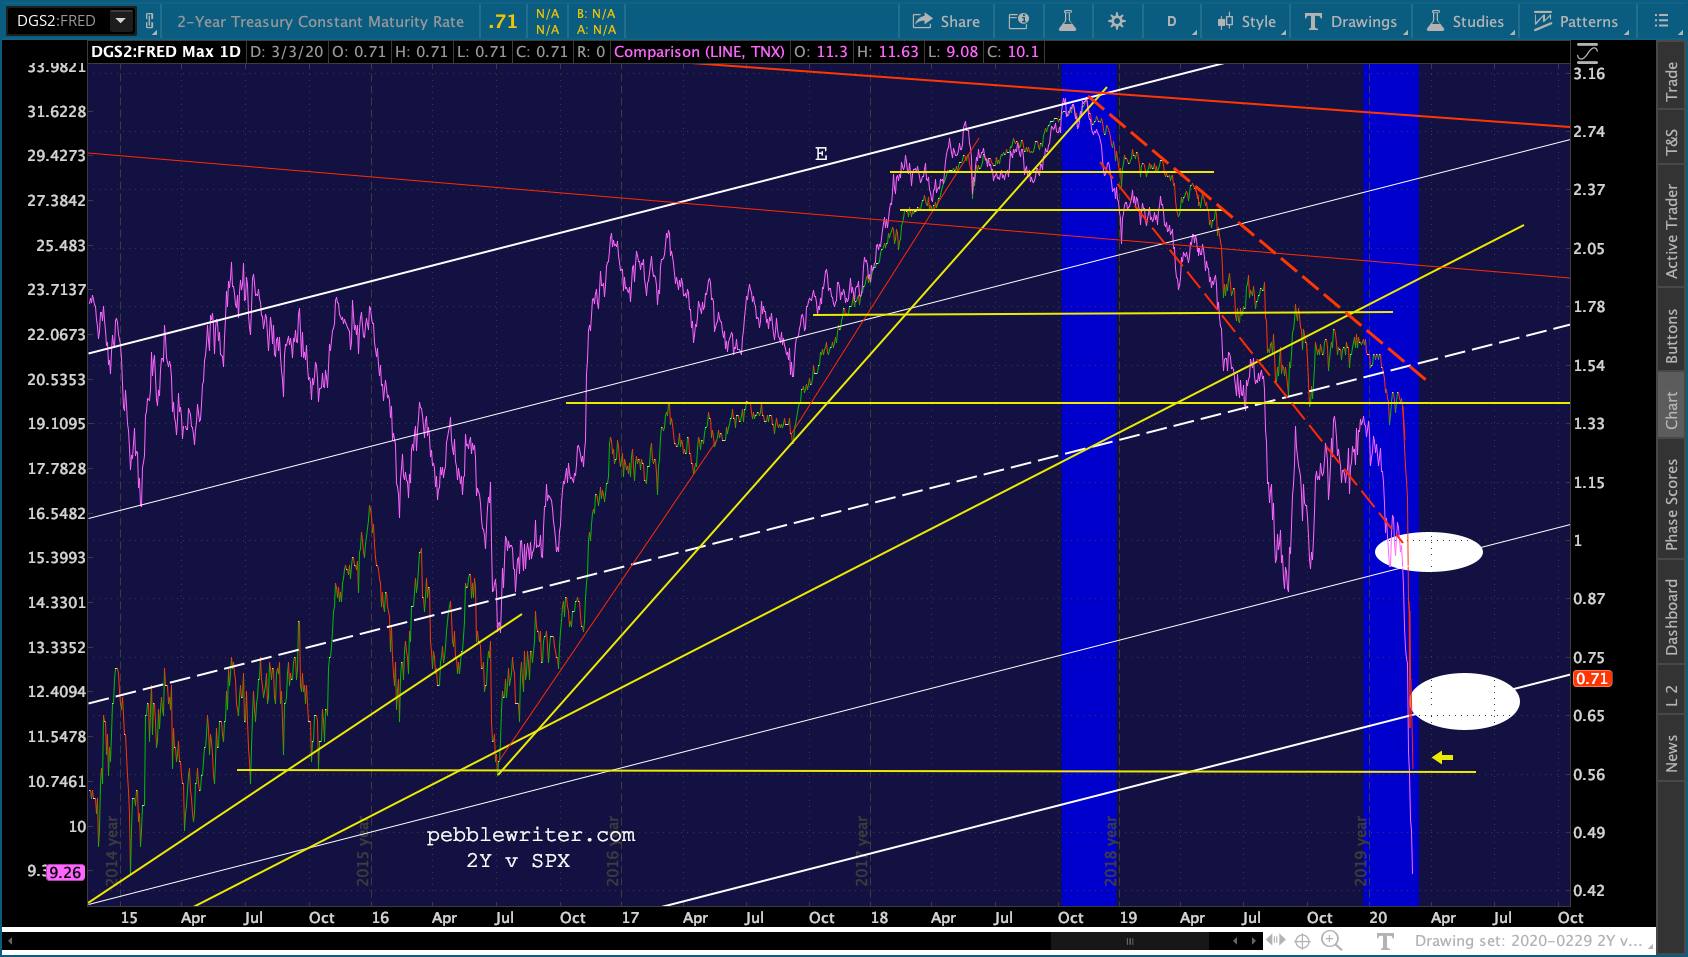
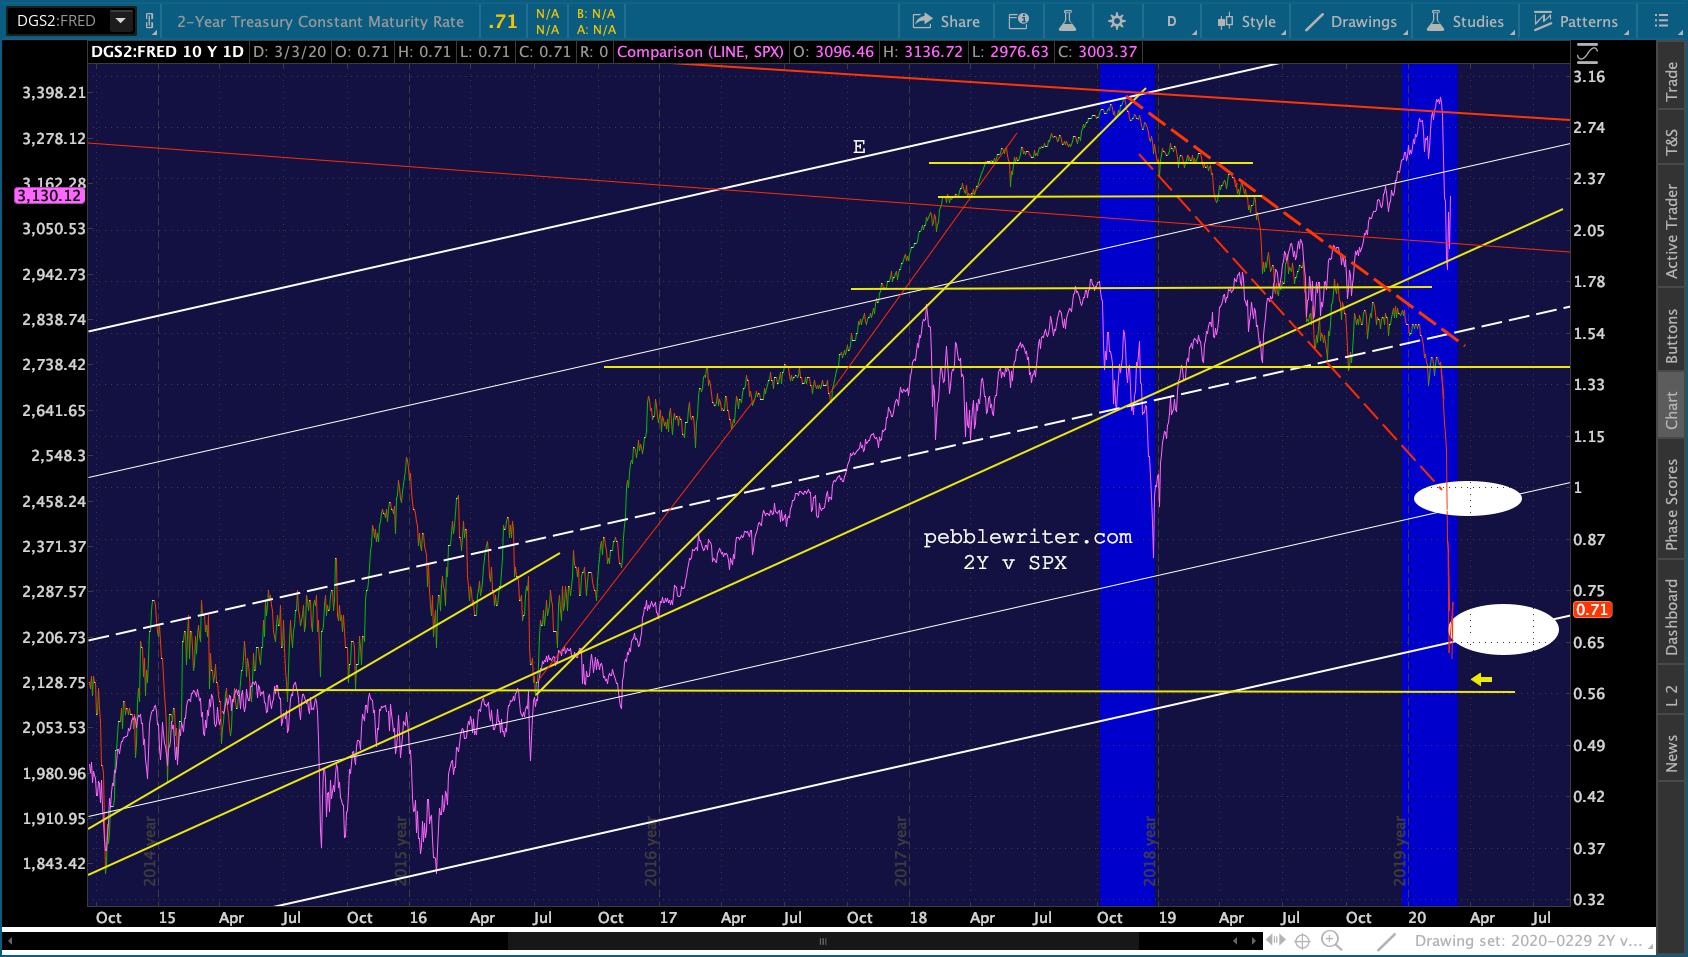 Stocks plunged when the 2Y recently fell below horizontal support at 1.4%. Now, it’s at critical channel bottom support and coming up on another important horizontal level at .65 and .57 respectively.
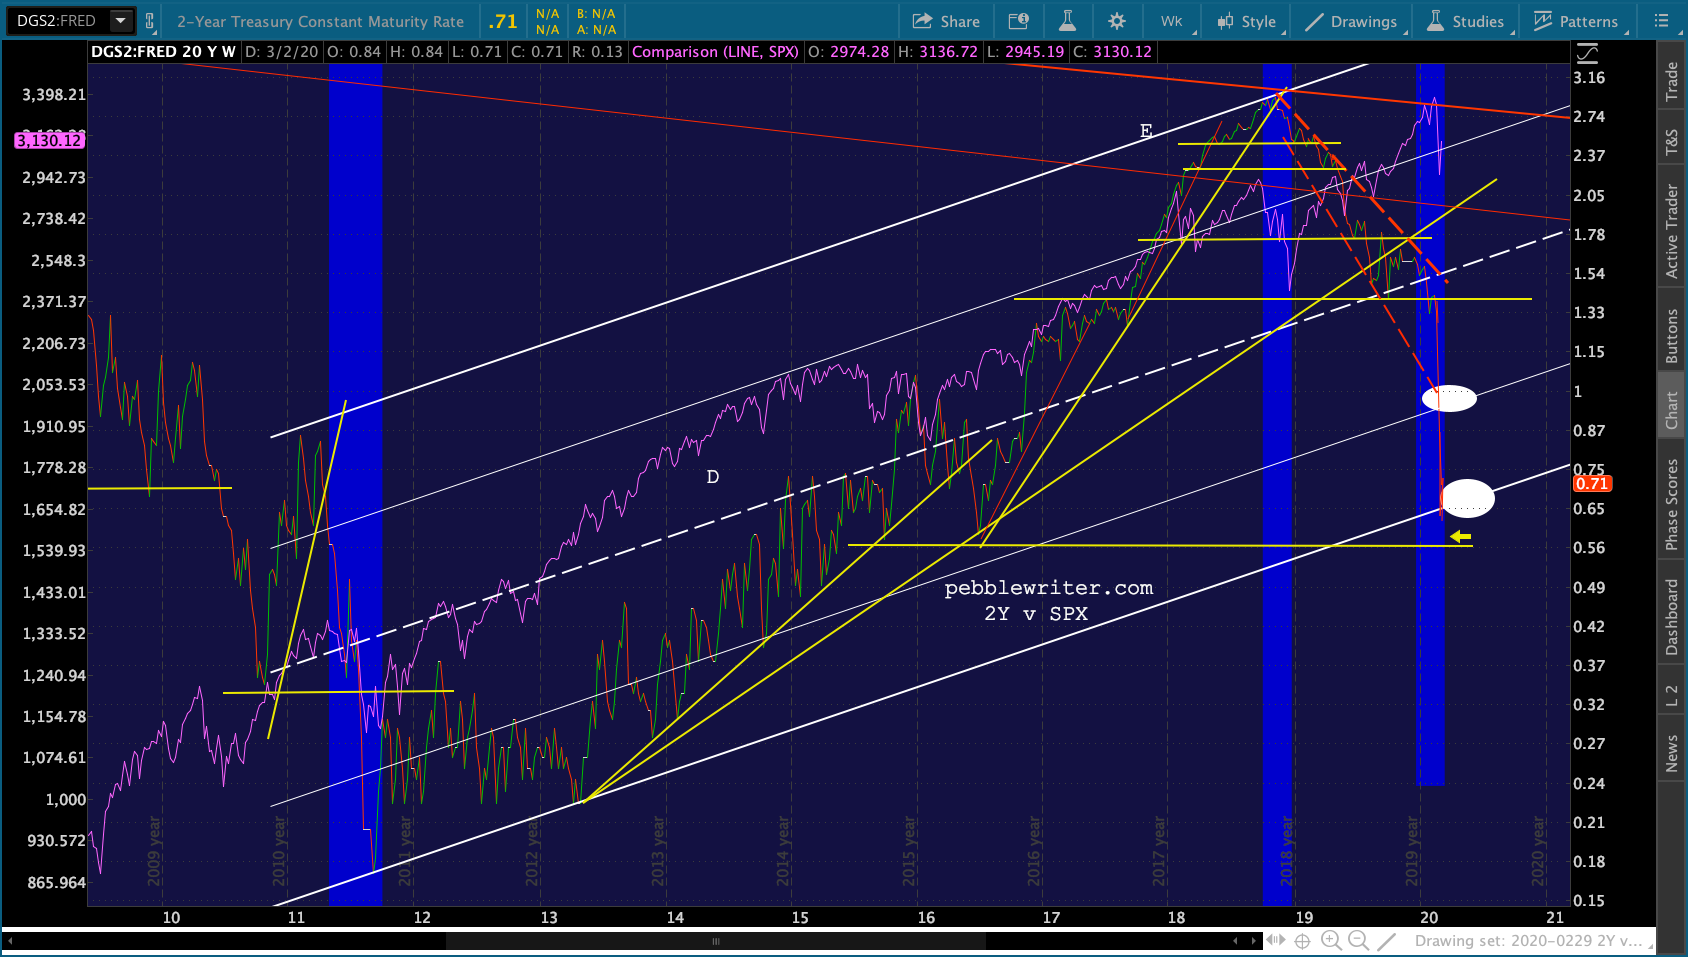 At .65, it will be about 33-35 bps below the 10Y. In fact, the 2s10s reached as high as 37 bps this morning – a level not seen since June 2018 and a clear breakout.
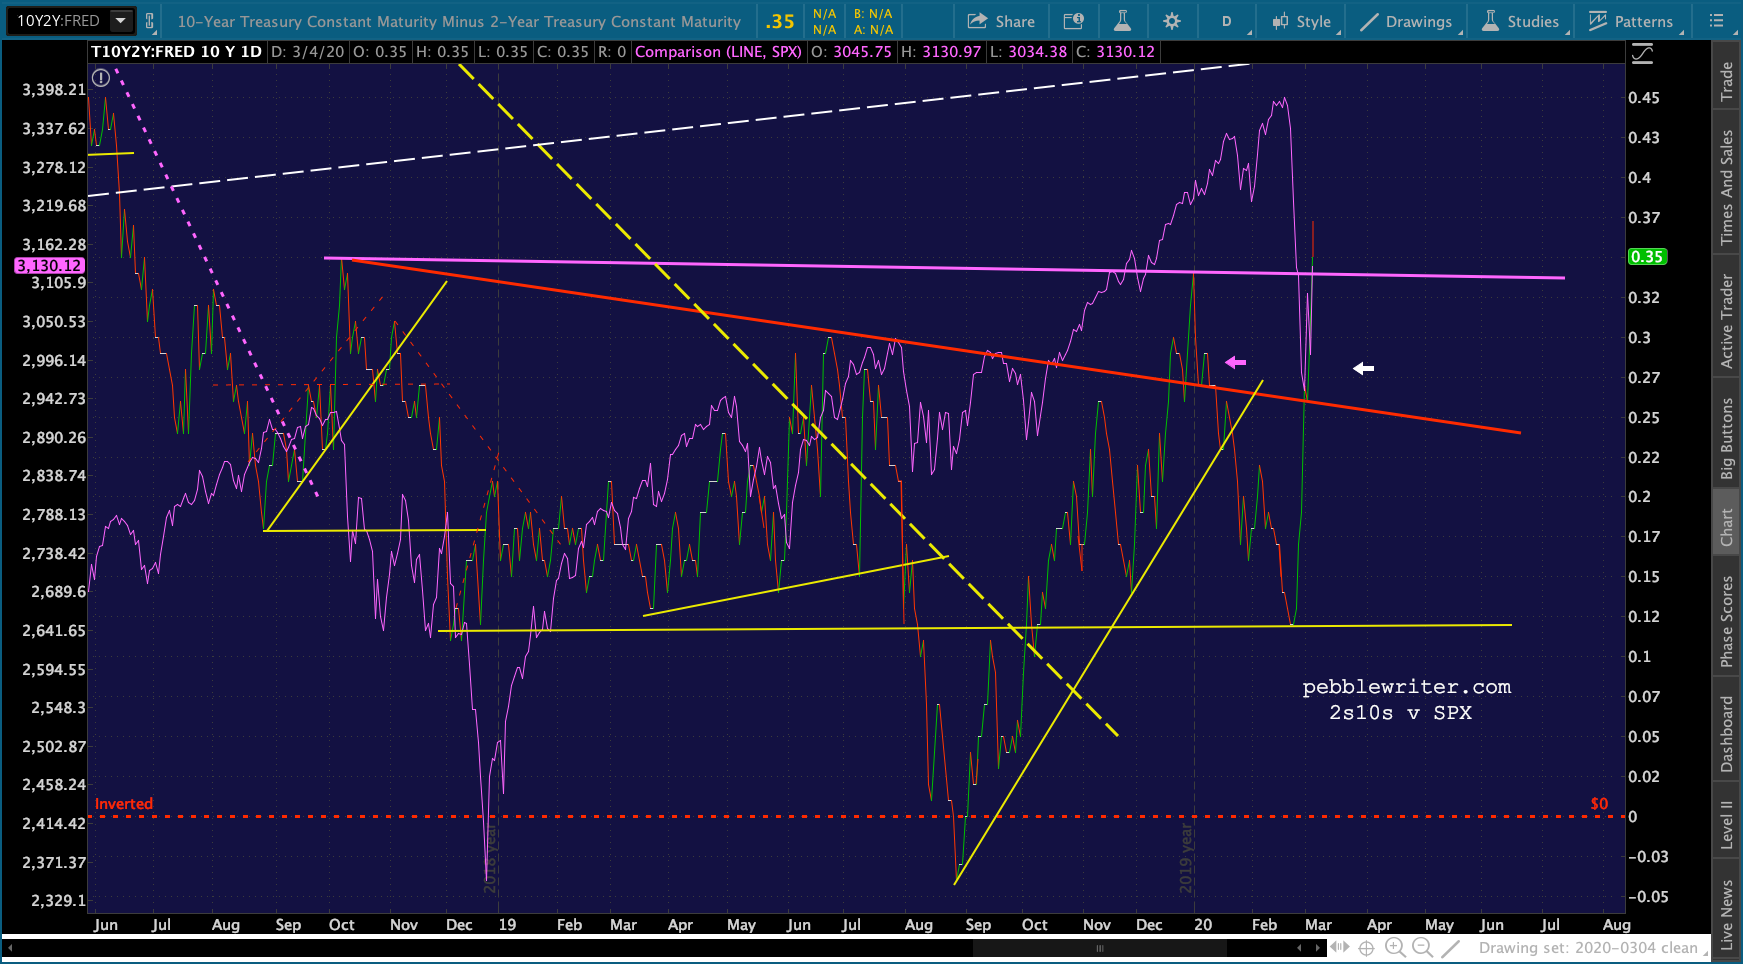 The 2s10s bounces around quite a bit every day, and it might or might not blow out.
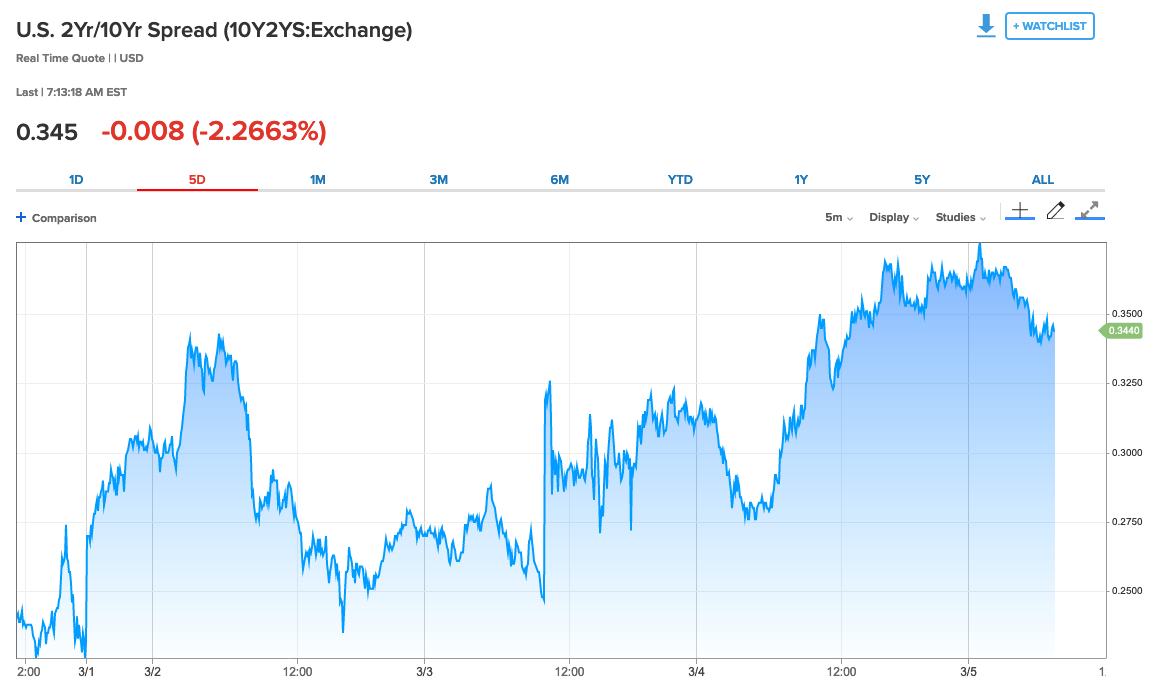
And, the 10Y has done a pretty good job of dropping right alongside the 2Y. But, the 10Y dropping below 1% is freaking some investors out. So, we should see some reticence on the part of central bankers to let it drop like a rock. Hence, the potential blowout in the 2s10s.
As we discussed yesterday, a rapid post-inversion rise has produced the last two major crashes.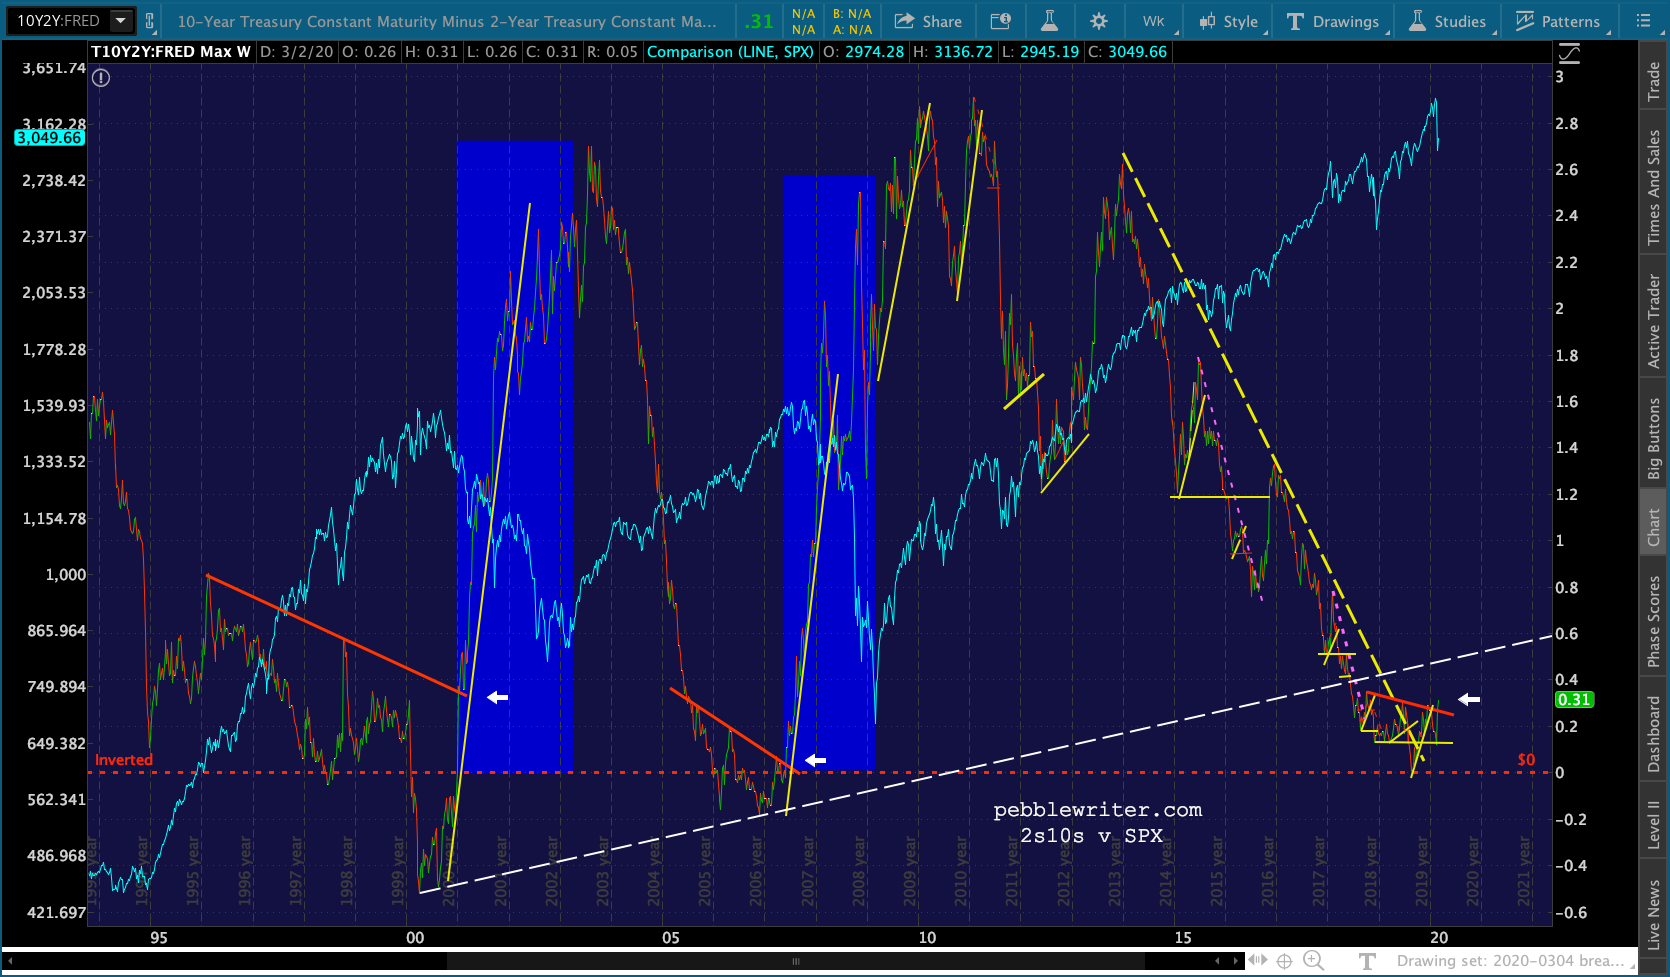 Examining the 2Y and 10Y in the first of those crashes, we can easily see the moment when TSHTF and the 2s10s blew out. I’ve marked some moments that were important to both the 2s10s and SPX:
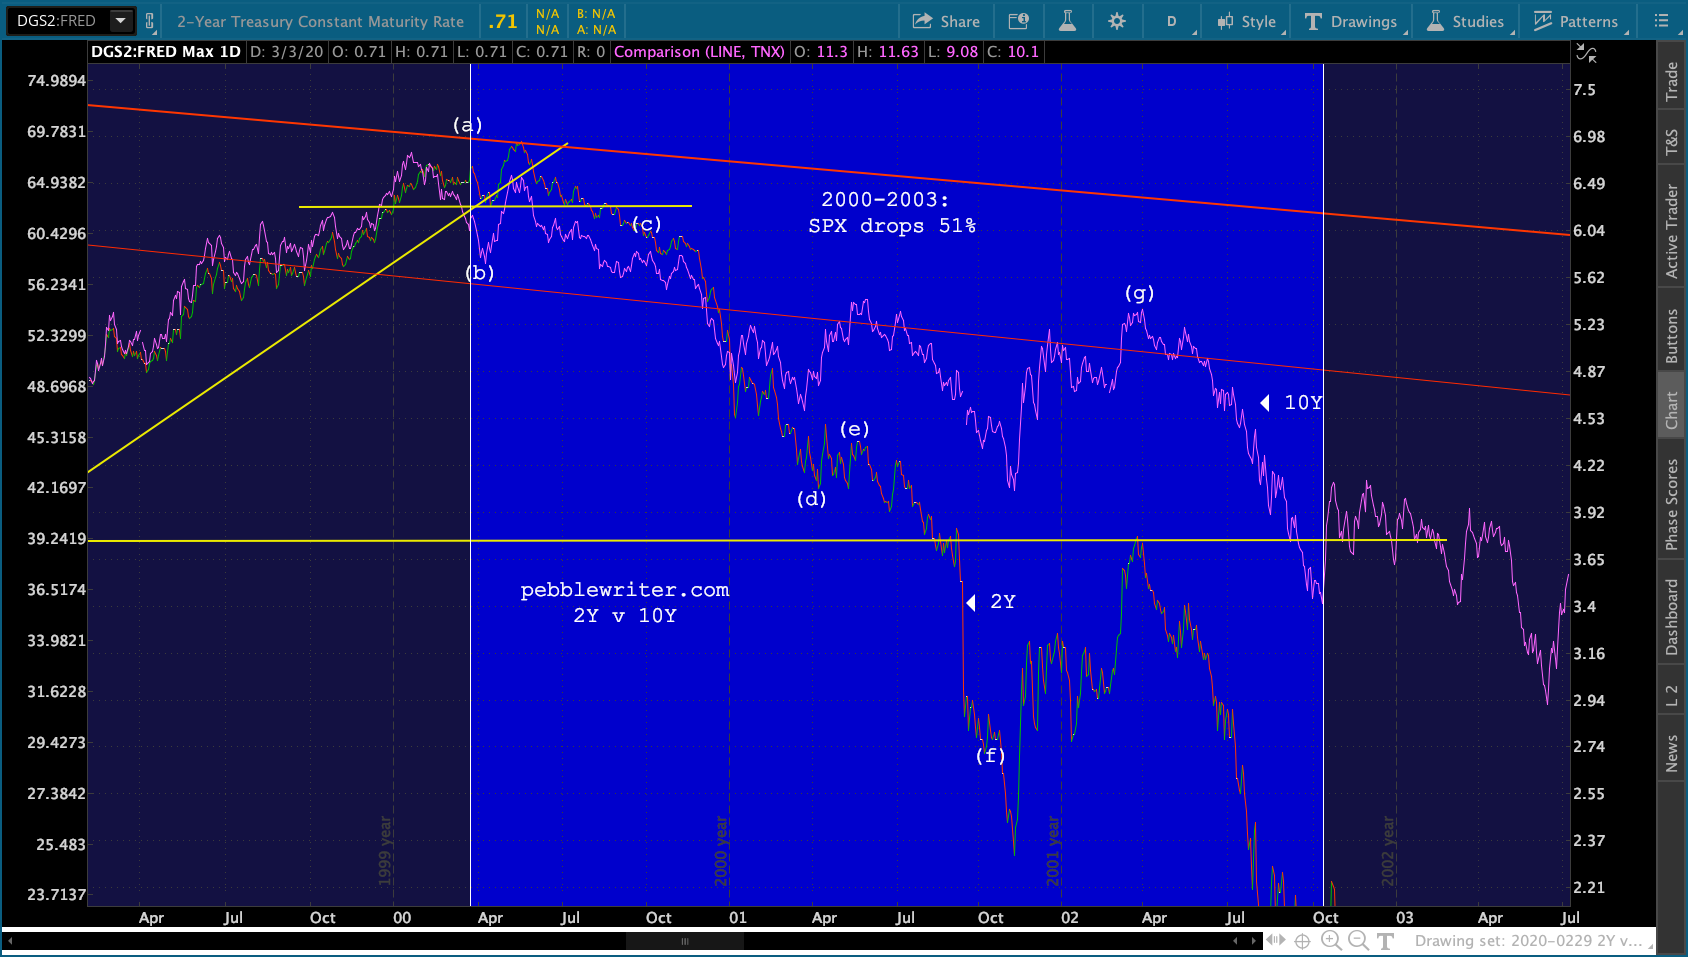 (a) Mar 24, 2000: SPX peaks at 1552
(b) Apr 4, 2000: SPX sheds 8.7% as the 2Y craters. By 4/14, the drop has grown to 13.7%
(c) Oct 6, 2000: after a long convergence, the 2Y drops sharply. SPX breaks down
(d) Apr 4, 2001: SPX off 30% as the 2Y attempts a comeback
(e) May 22, 2001: 2Y completes bounce, begins collapse, SPX completes a 22% bounce
(f) Sep 21, 2001: 2Y stabilizes as 10Y catches down, SPX now off 39%
(g) Mar 19, 2002: SPX completes a 20% bounce, 2Y begins collapse
(h) Oct 10, 2002: SPX completes 51% crash.
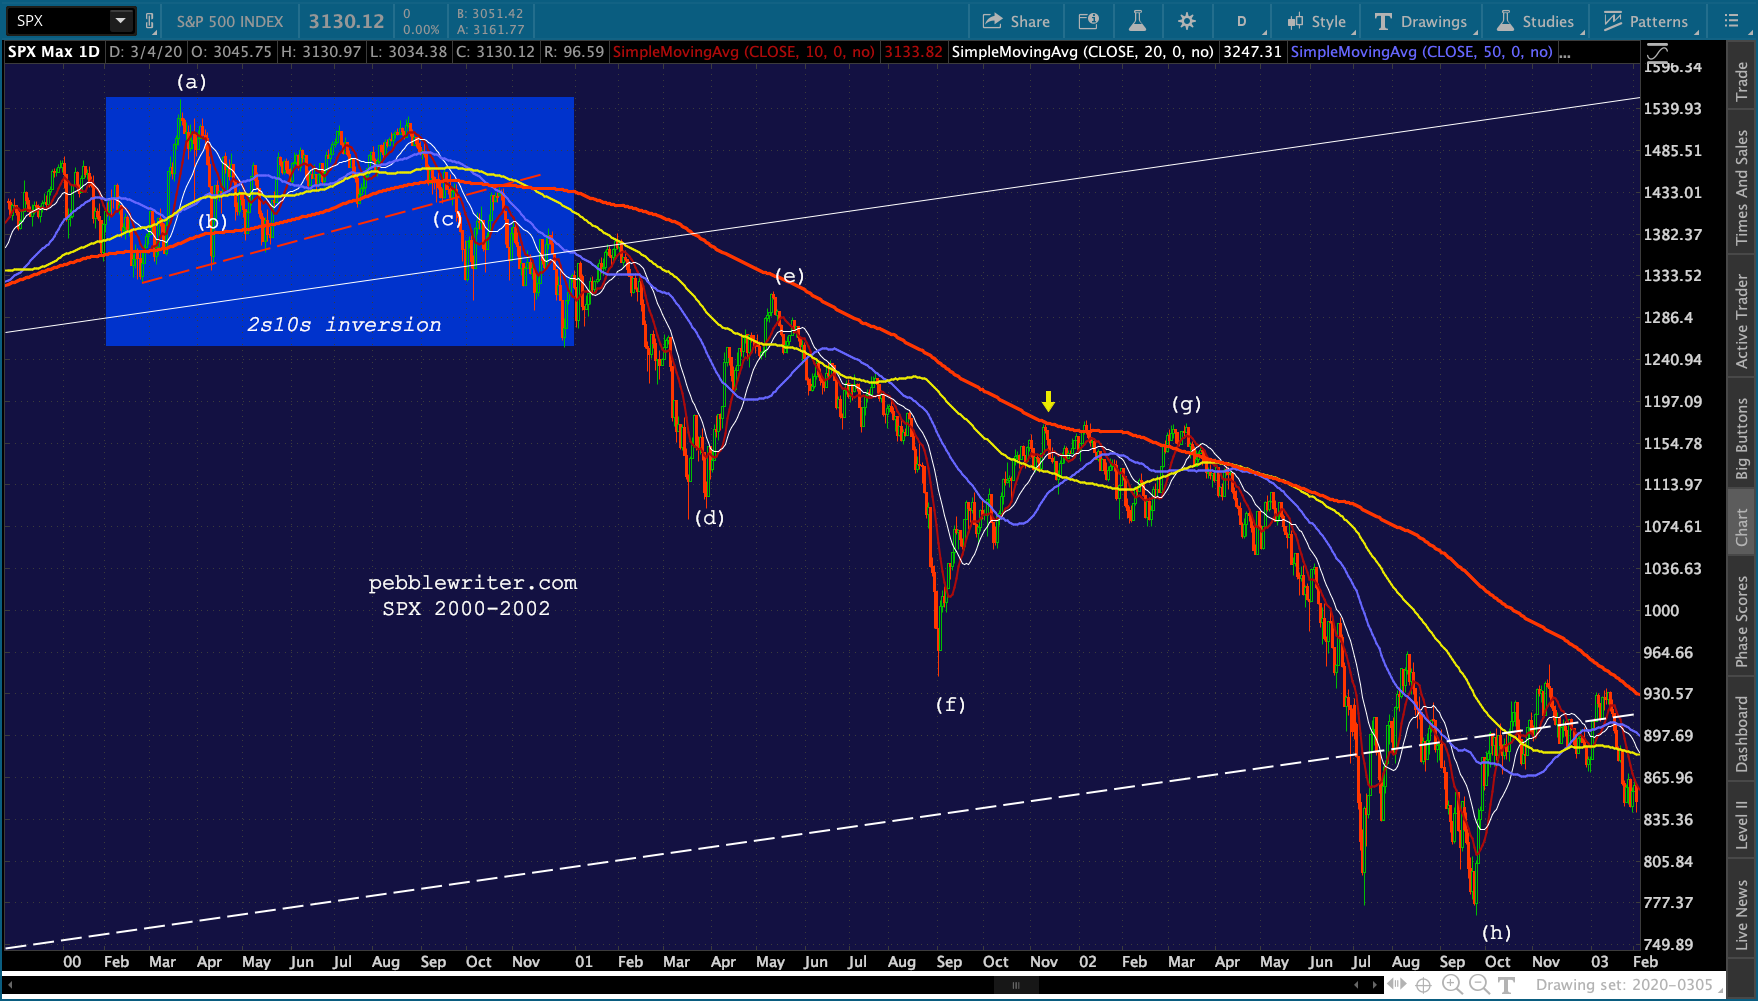 Remember, the 2s10s was inverted between 2/2/2000 (51 days before SPX peaked – 2000 was a leap year as is 2020) and 12/28/2000. On Dec 28, SPX had bottomed a week earlier (after a 19.2% drop) and bounced for a month as the 2Y and 10Y converged.
But, SPX failed to retake its SMA100 and the 2Y suddenly plunged, sending the 2s10s inversion spiking higher above TL resistance.
There are many similarities between 2000 and 2020. But, there are many differences as well. The current elephant in the room, of course, is the coronavirus. The US is currently showing 11 fatalities out of 59 cases, a 6.9% mortality rate. But, the number of cases is no doubt hugely understated due to the lack of test kits.
If the frequently cited mortality rate of 2% were applied, the current cases would be closer to 550 – about where Italy was on Day 8 (with a mortality rate that day of 2.6%) of reported cases and the 7th day after its first death. If we sync the Italy and US charts, setting Day 1 in the US as Feb 26, the first day US deaths were reported, we would also be on Day 8.
We might be off a day or two, since the lack of testing kits might also have affected the reported cause of death for US fatalities. But, on Day 8, Italy jumped from 12 to 17 deaths. A week later, on Day 14, it had reported 109 deaths. Today, my model suggests 161.
For details, please see yesterday’s post: https://pebblewriter.com/coronavirus-why-the-complacency/
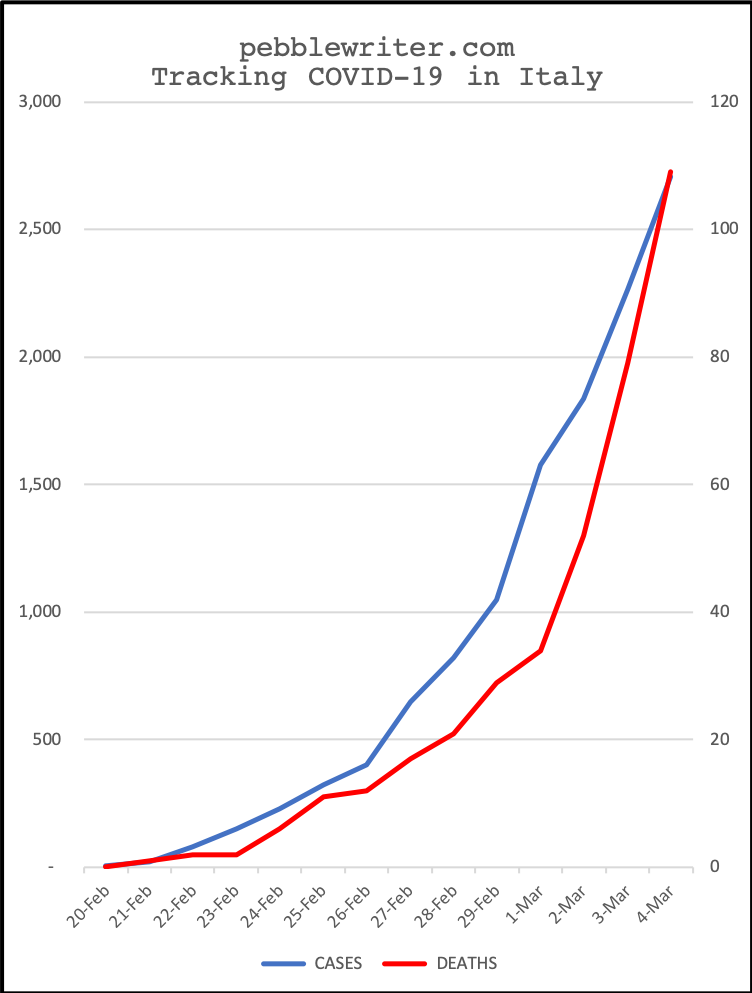
Now, the US has 5.45 times the population of Italy and has yet to institute any quarantines other than those returning from infected cruises and the like. But, if the correlation and current exponential rate of increase were to hold, we could be looking at 55,000 cases and 1,000 deaths by Mar 16. Adjusted for the population difference, raise that to 300,000 cases and 5,500-6,000 deaths.
I wonder how low the Fed would need to cut interest rates to make the stock market ignore those numbers.
* * *
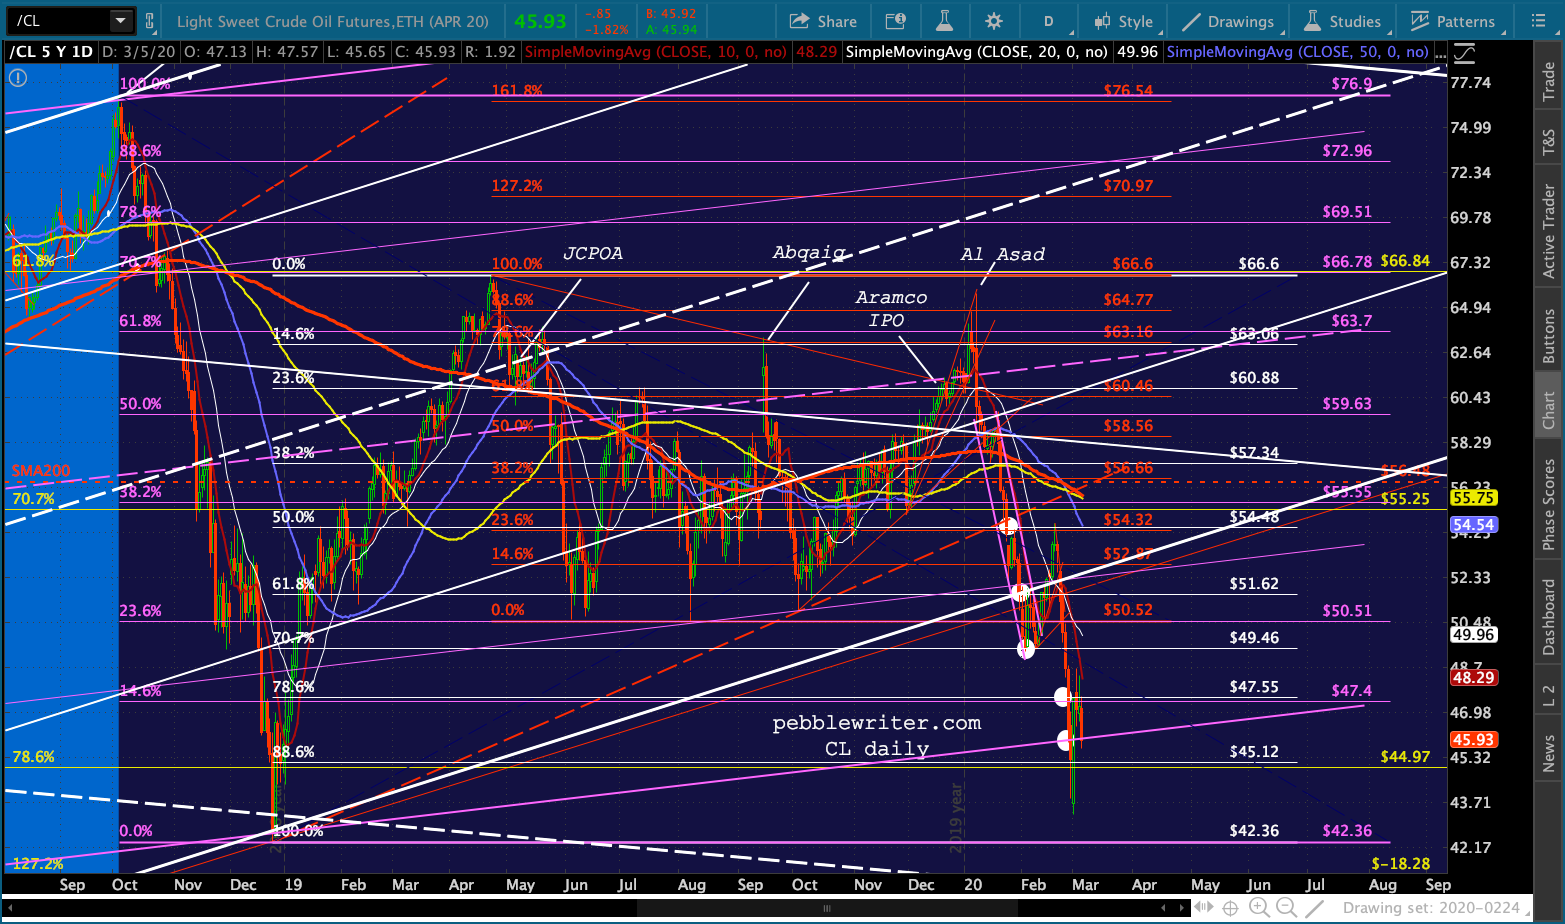
Meanwhile, the algos are still rearranging the deck chairs this morning. CL is off this morning as OPEC tries to figure out how much of a production drop will increase demand, or at least stabilize prices. 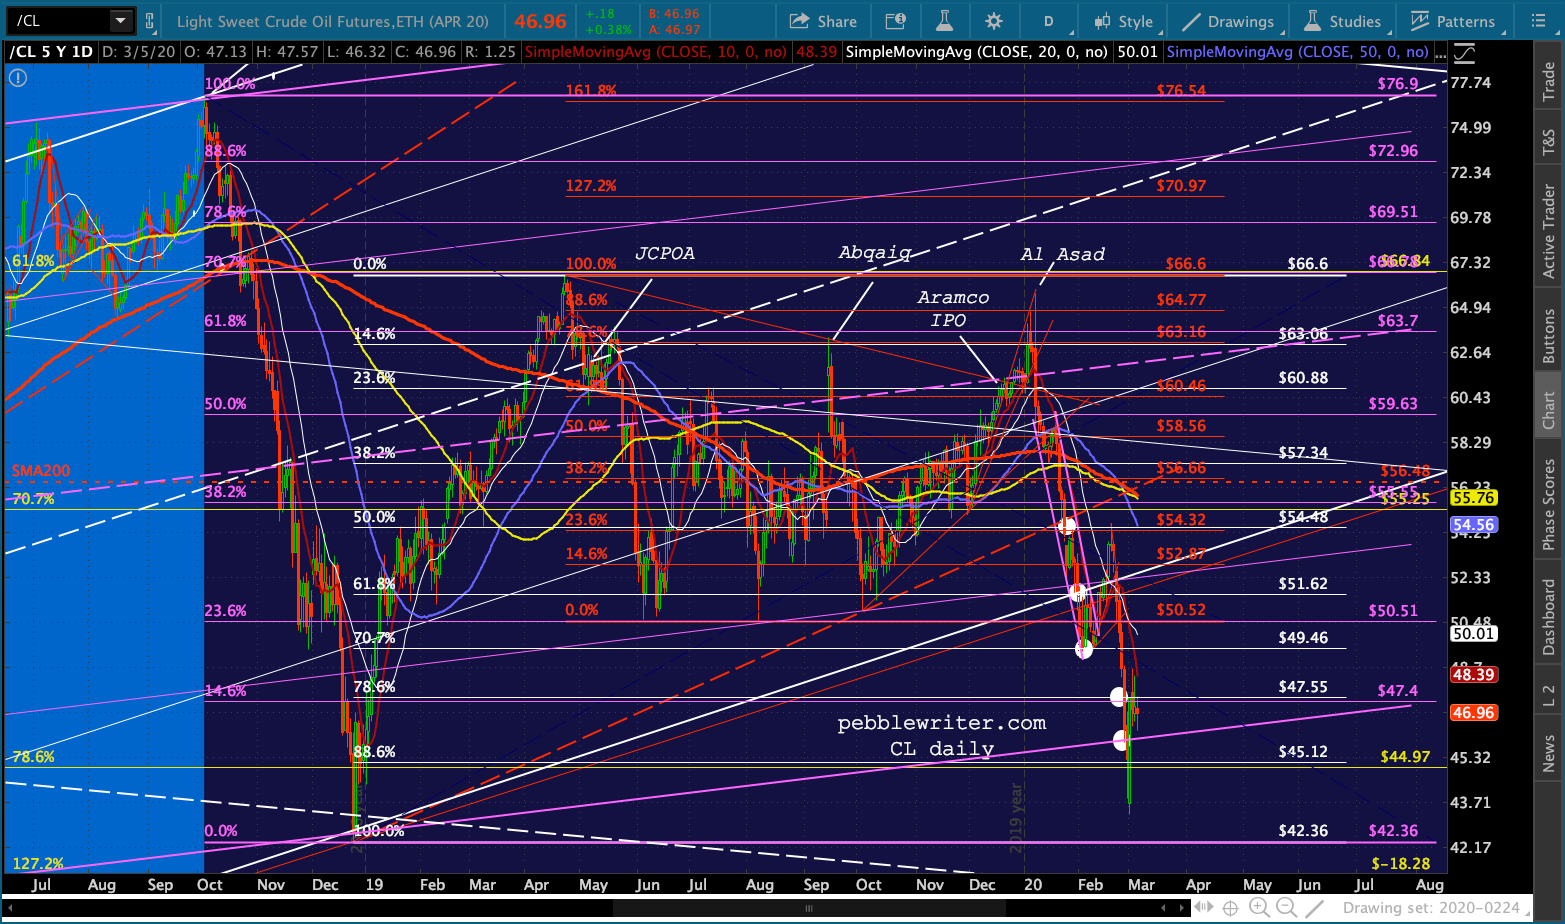 But, the drop thus far hasn’t been enough to signal the (coming) massive breakdown on the weekly chart. Remember, 45.47 is the line in the sand.
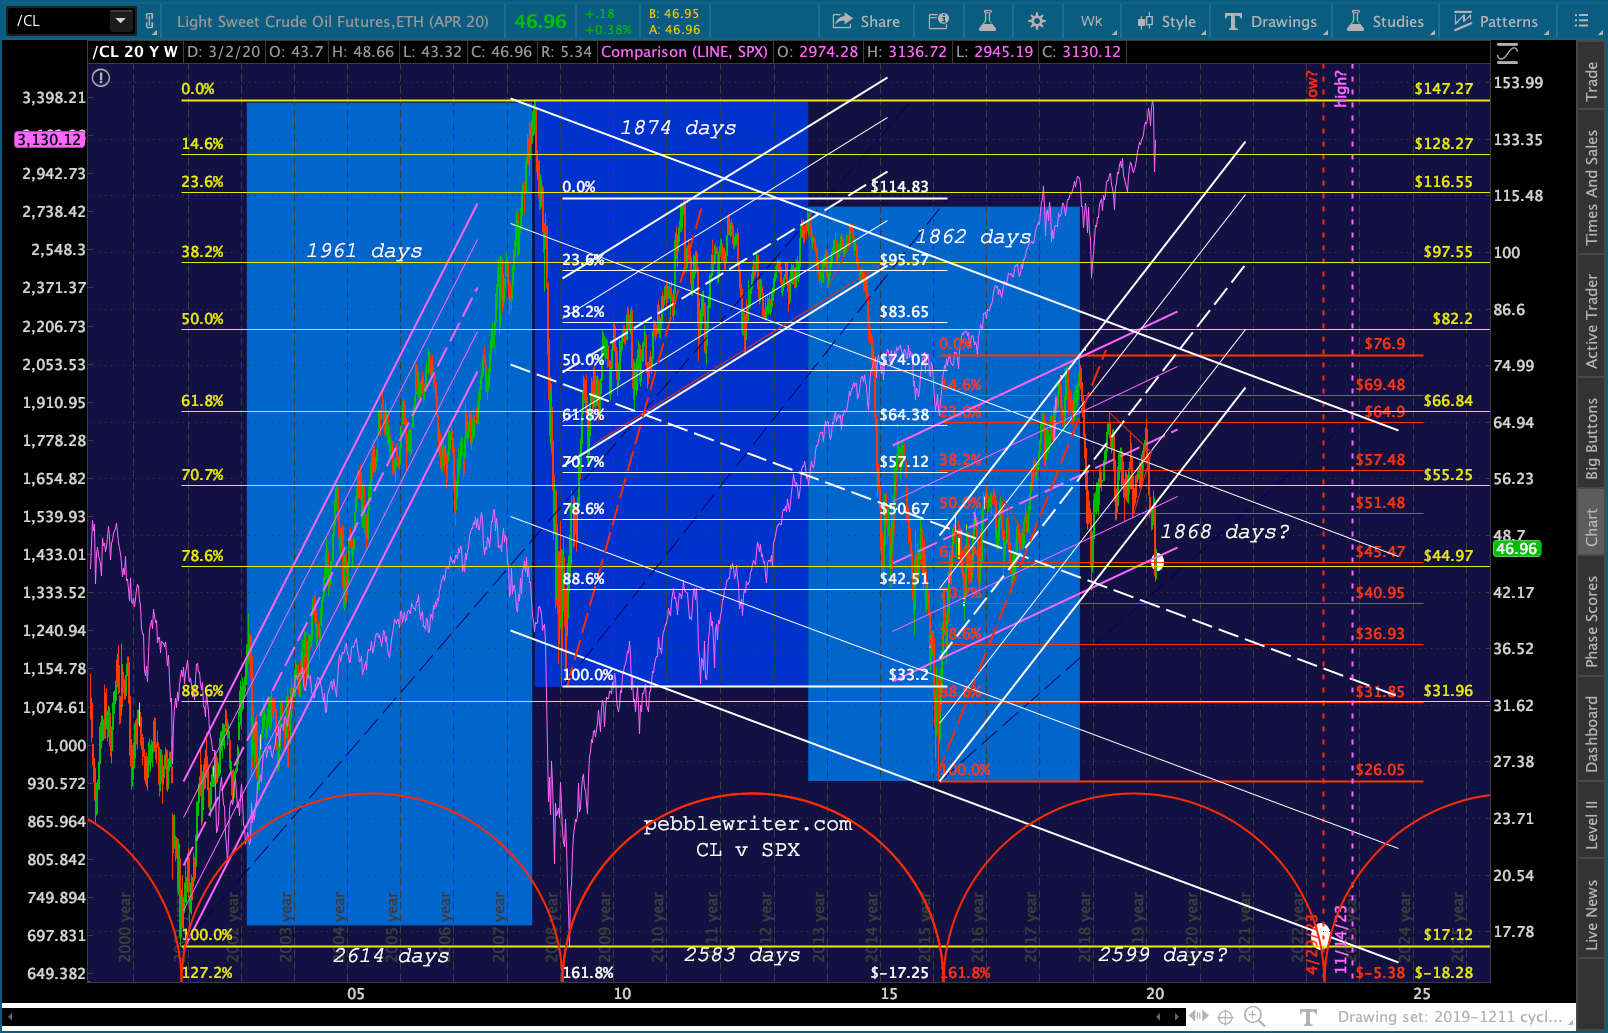 RB is happy to bounce around in this range which will produce a concerning (but not alarming) drop in CPI from last month’s 2.49. Count on it being low enough to justify more Fed meddling.
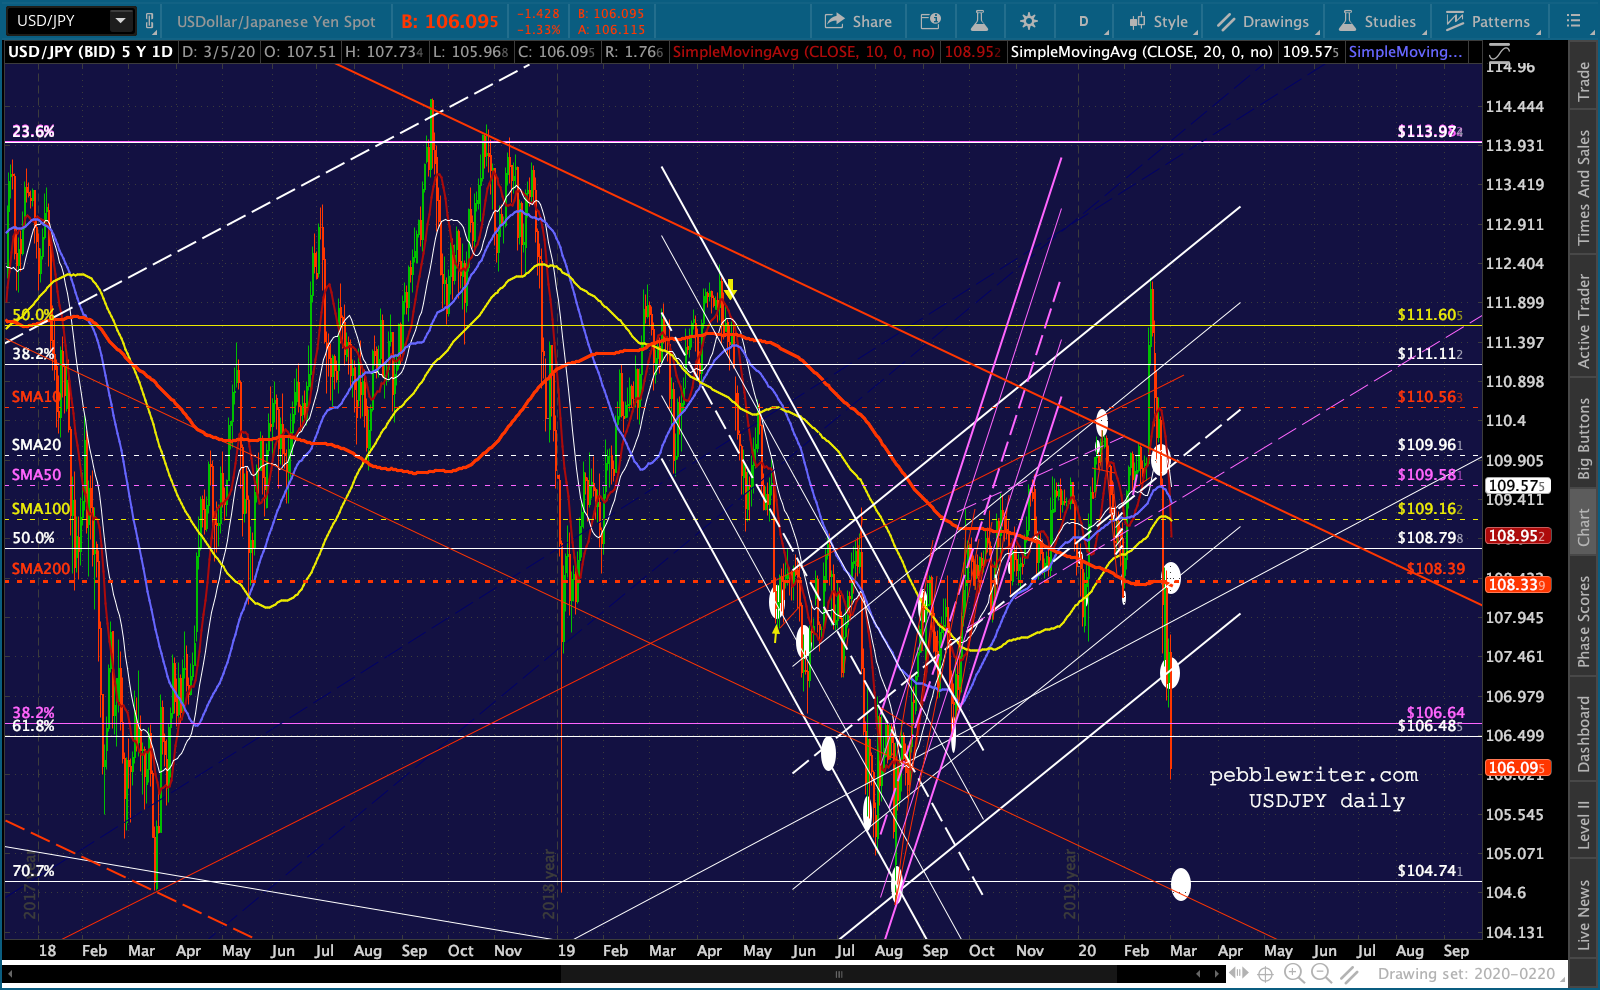
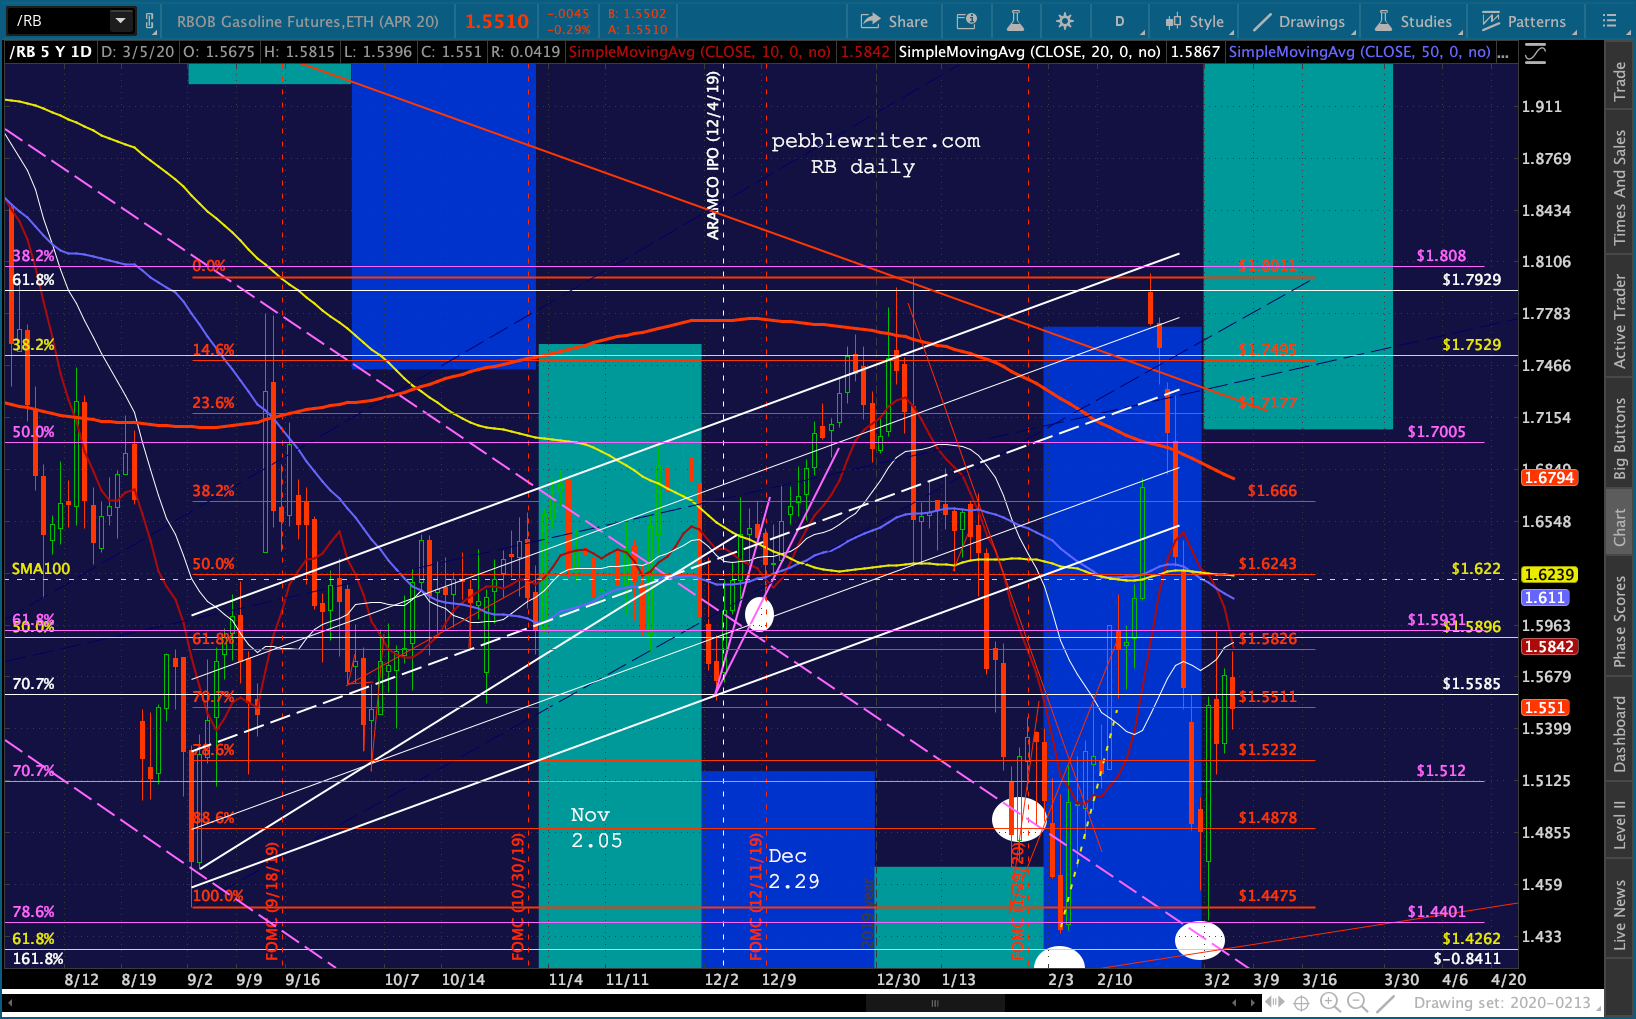 USDJPY is threatening (yes, again) to break down.
 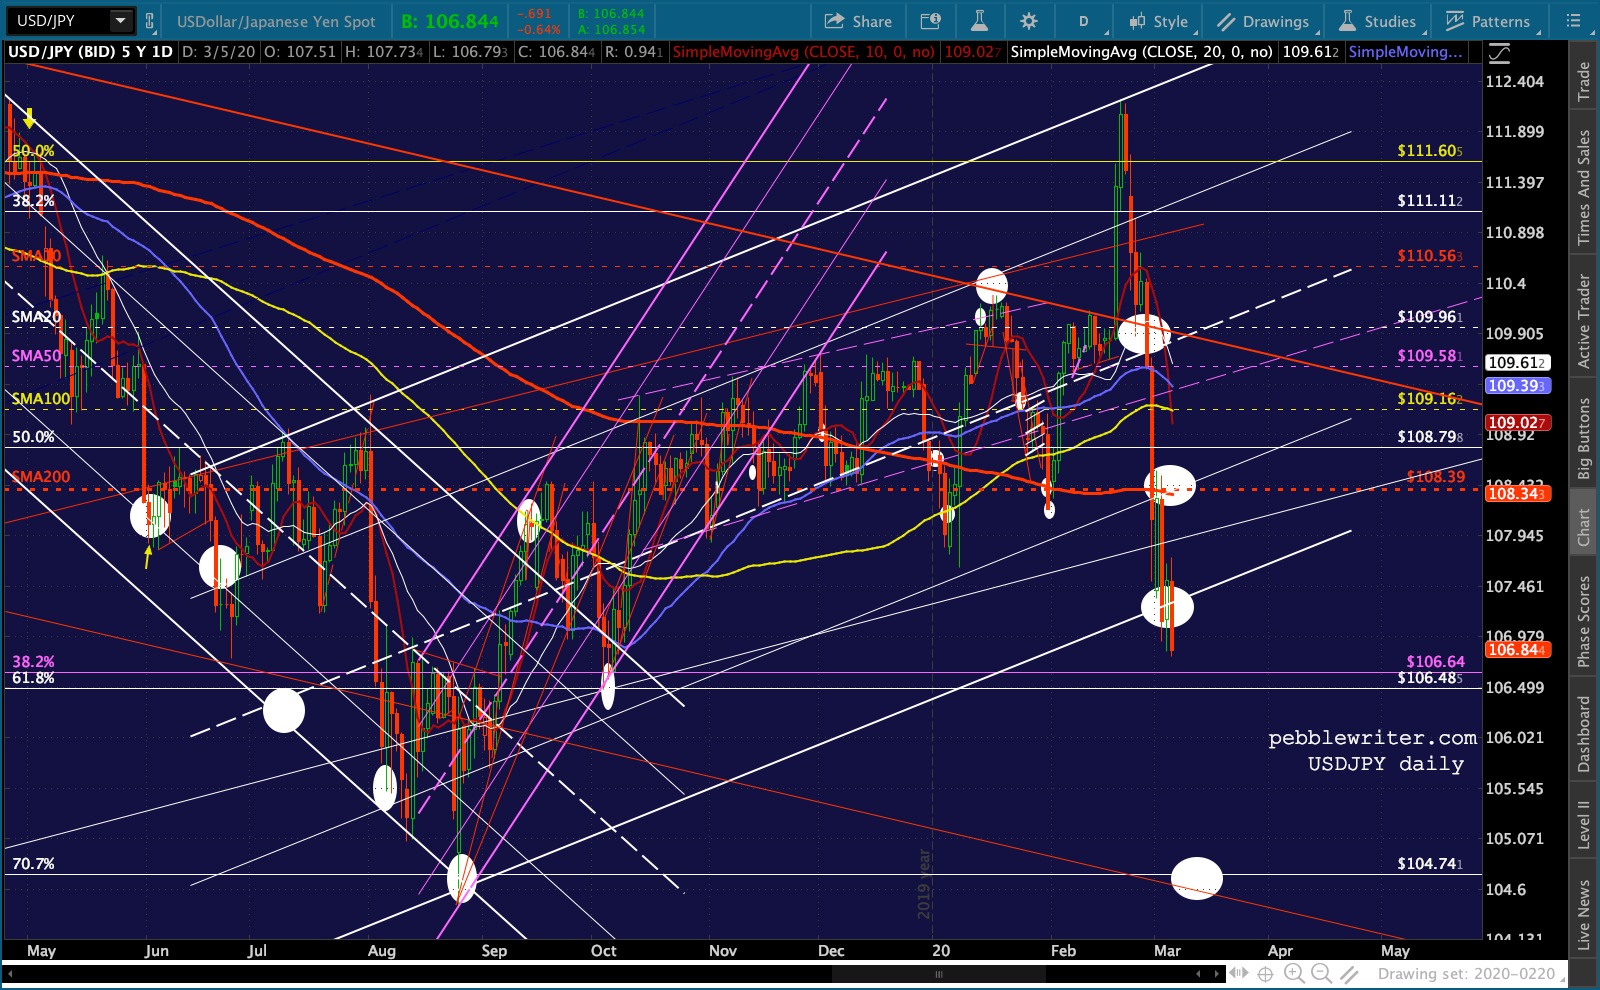 But, this time, EURUSD is breaking out, making higher highs with an eye toward 1.13…
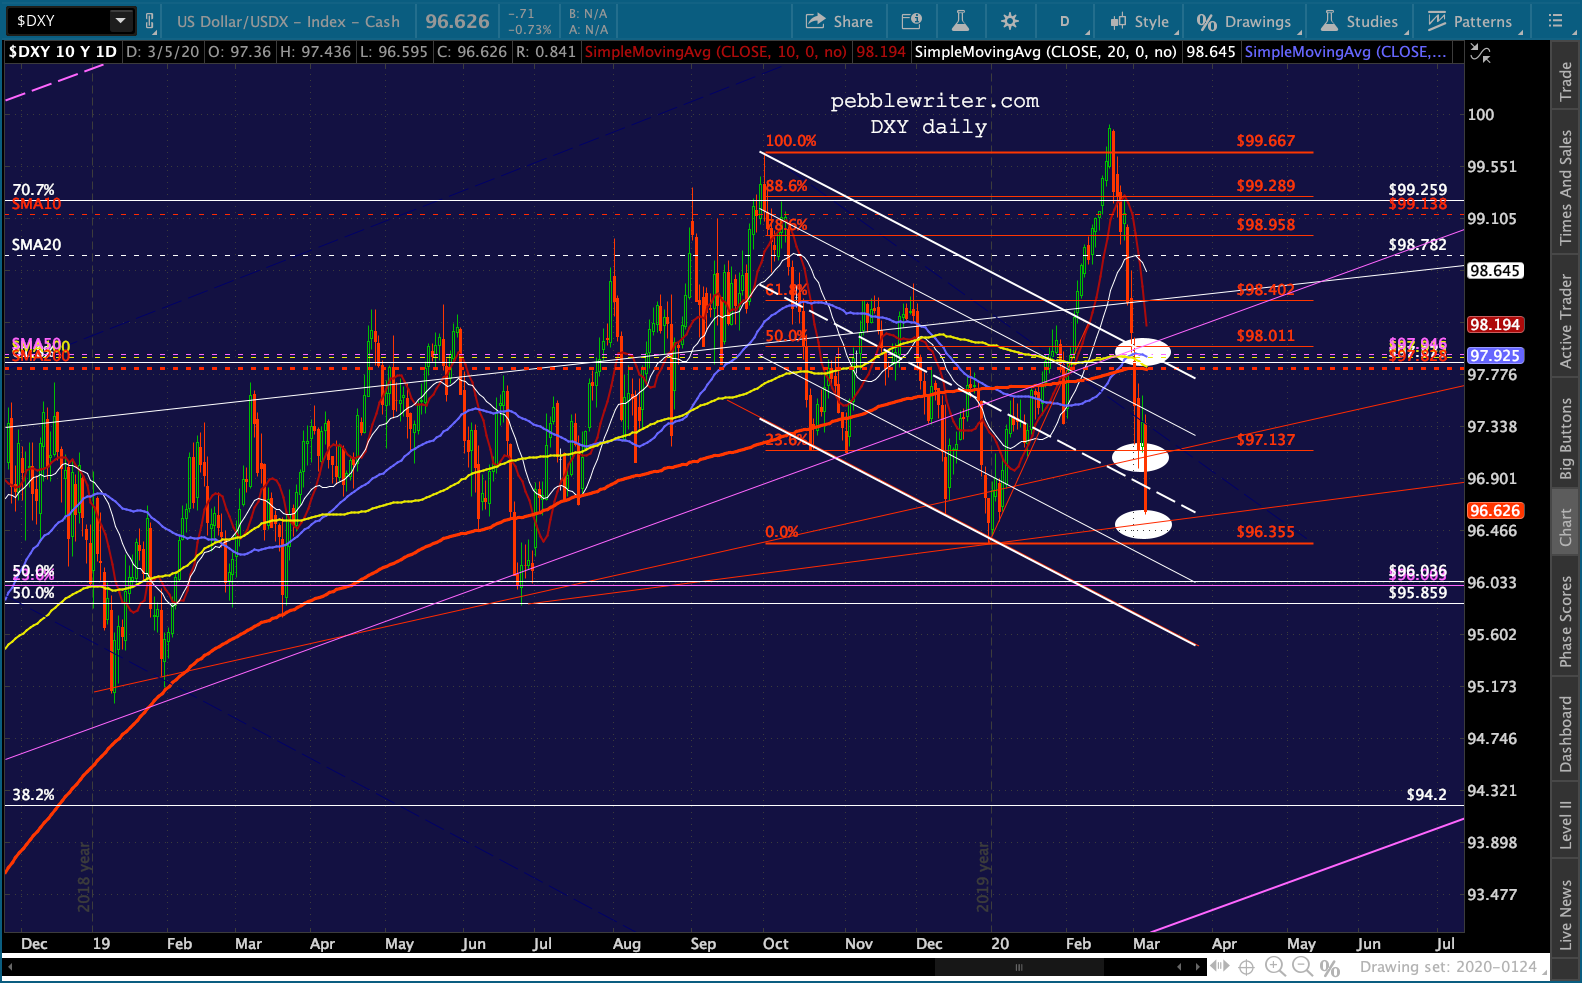
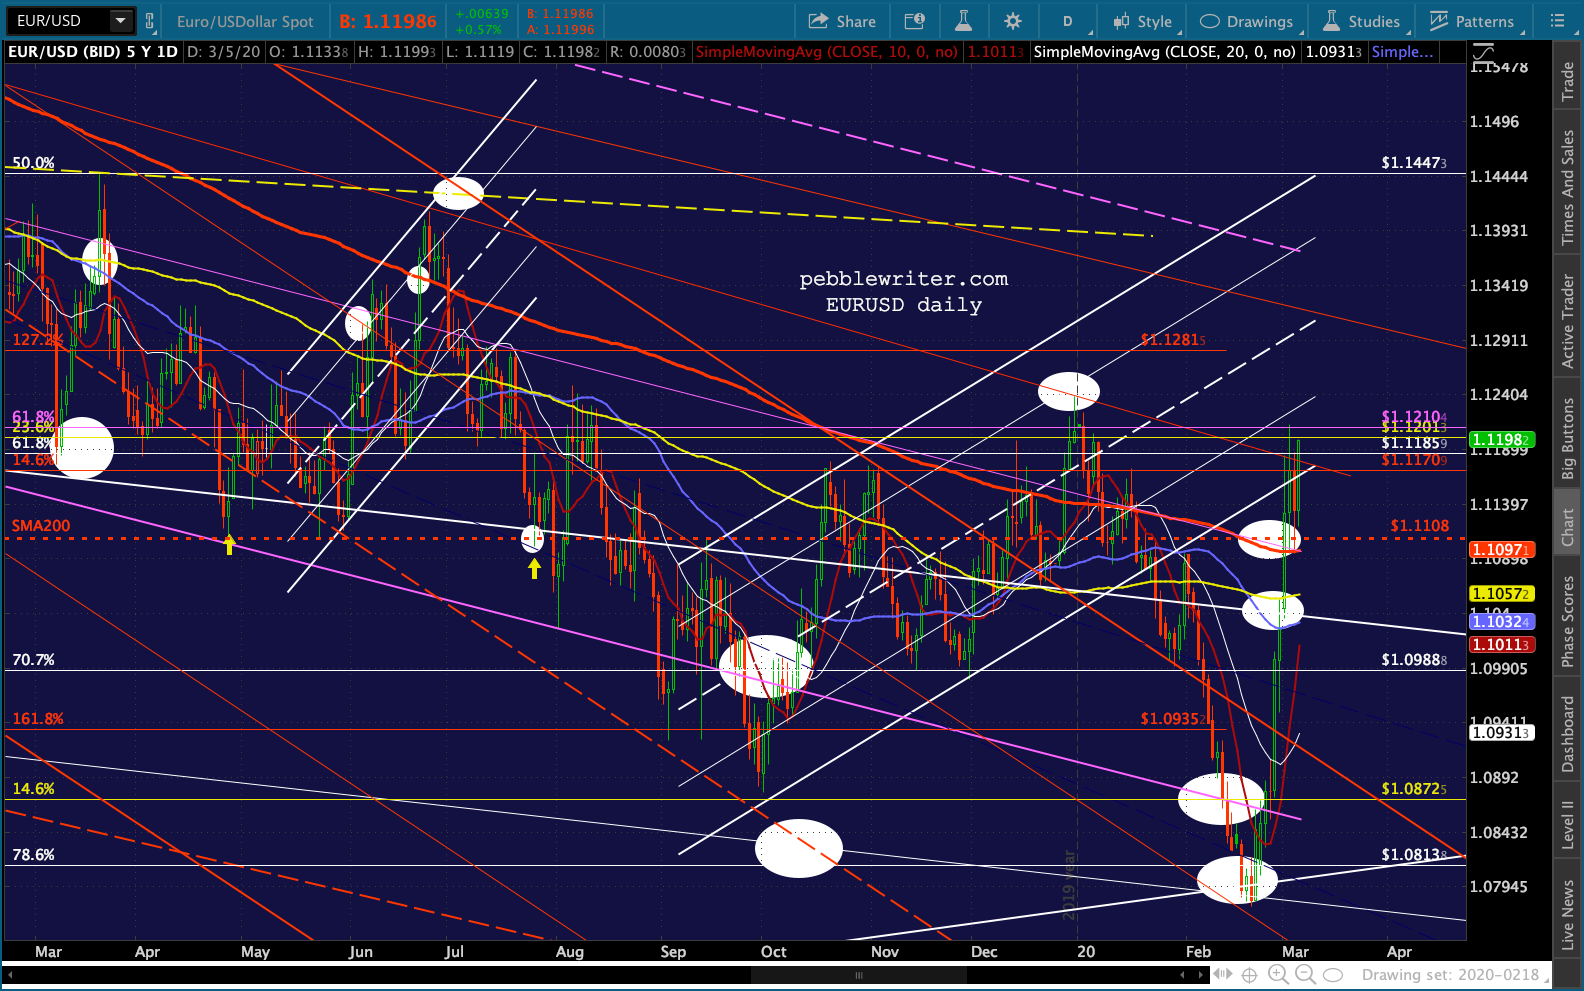 …meaning DXY is making lower lows. Hmmm…
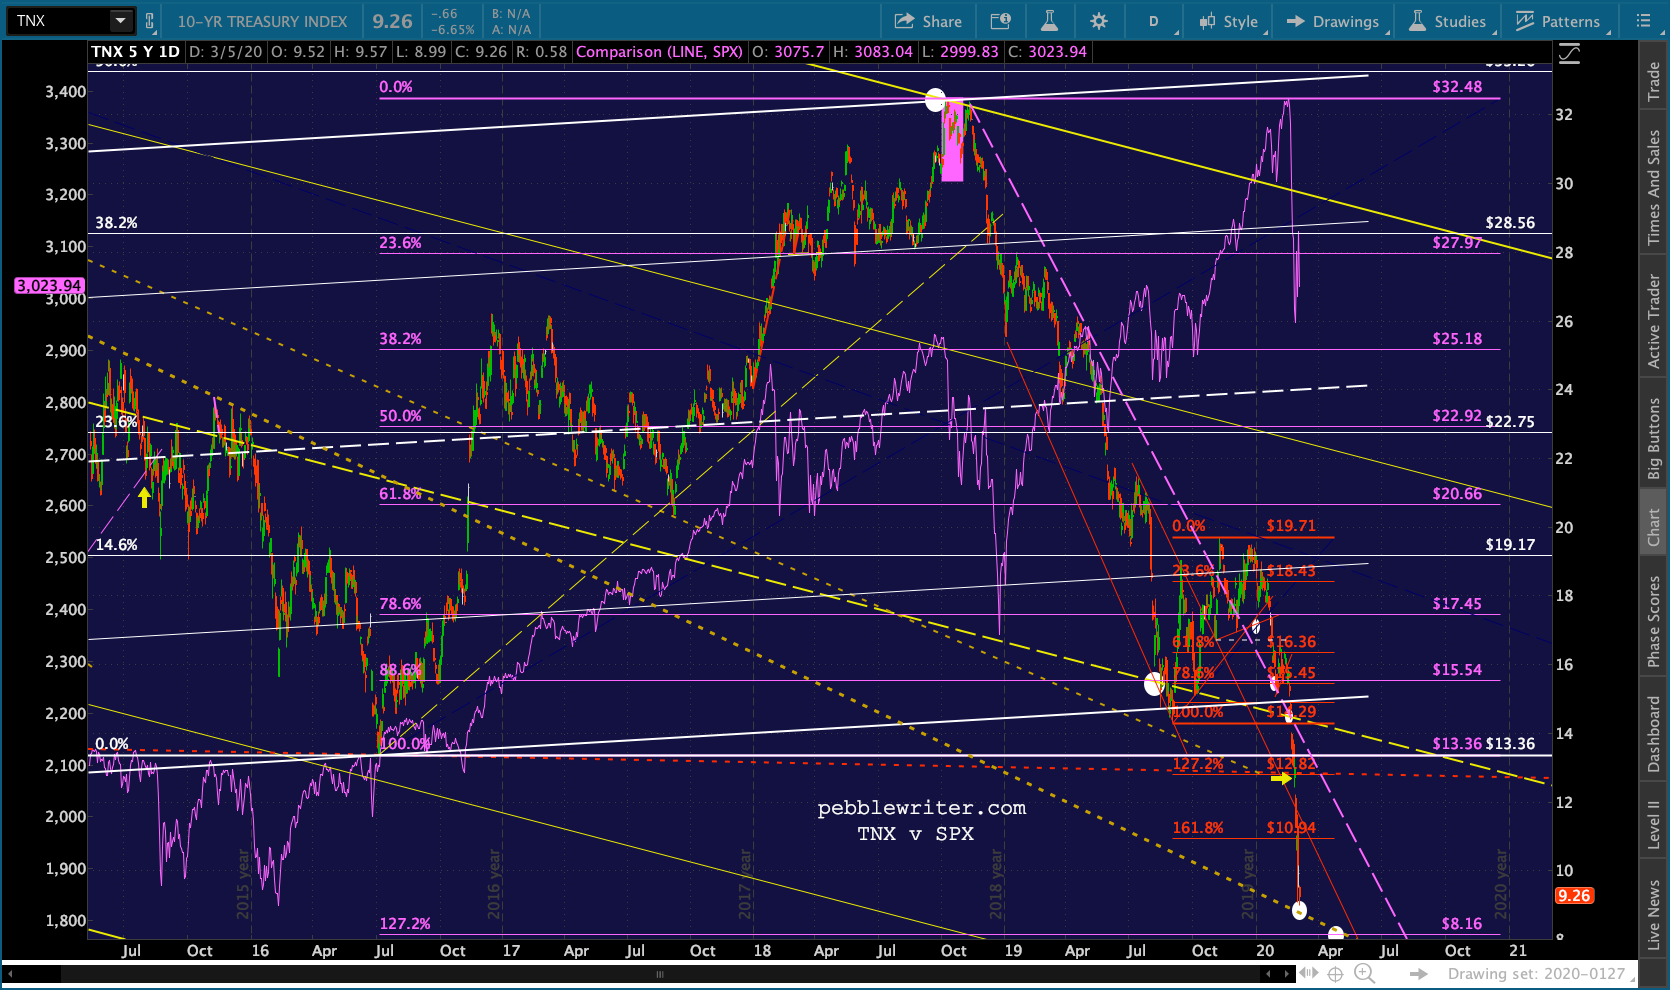
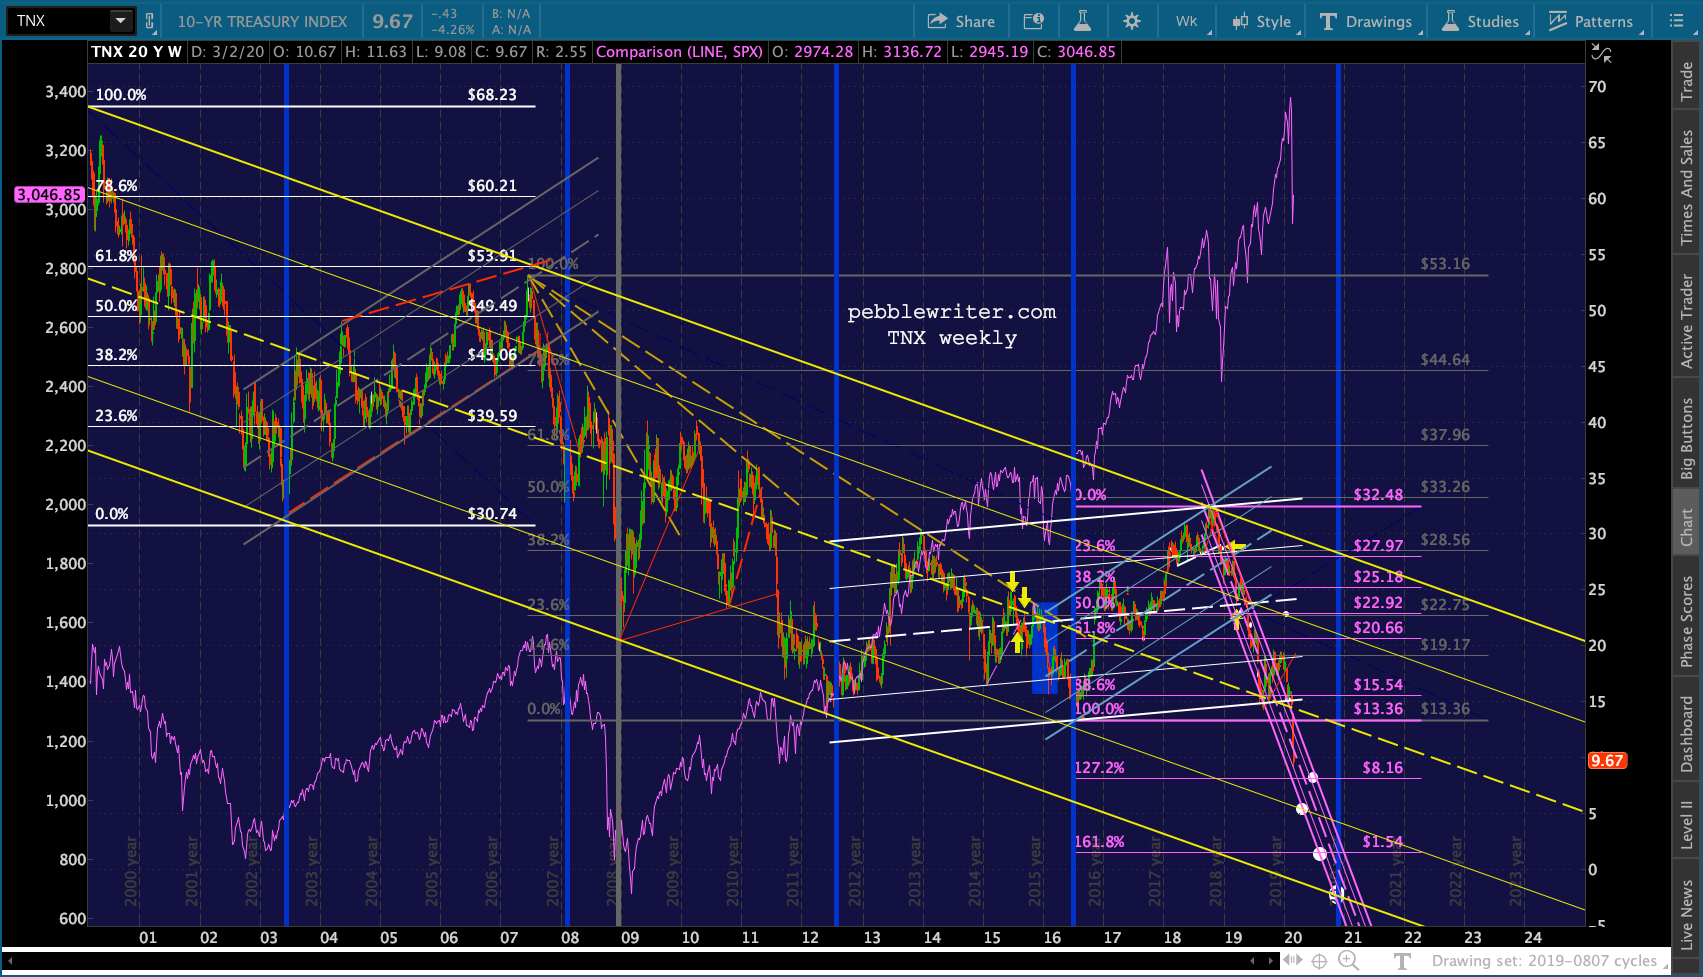
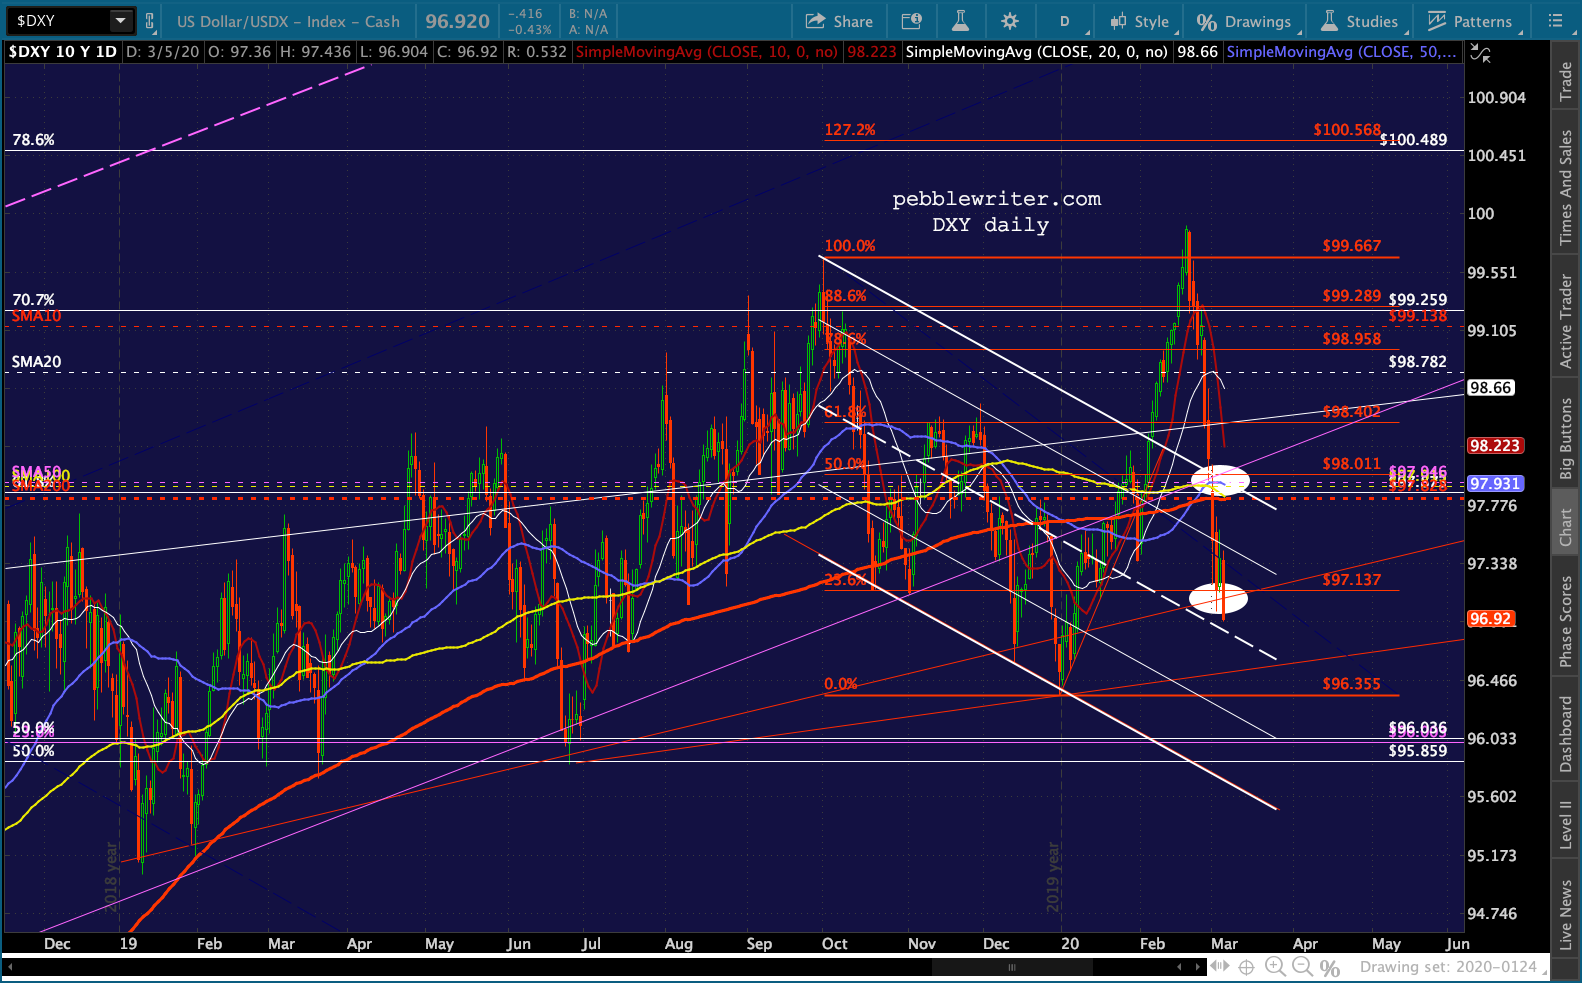 The 10Y still has a wide open path to much lower levels — if it dares.
 ZN certainly supports the move, and has still broken out above its July 2012 highs. Hmmm…
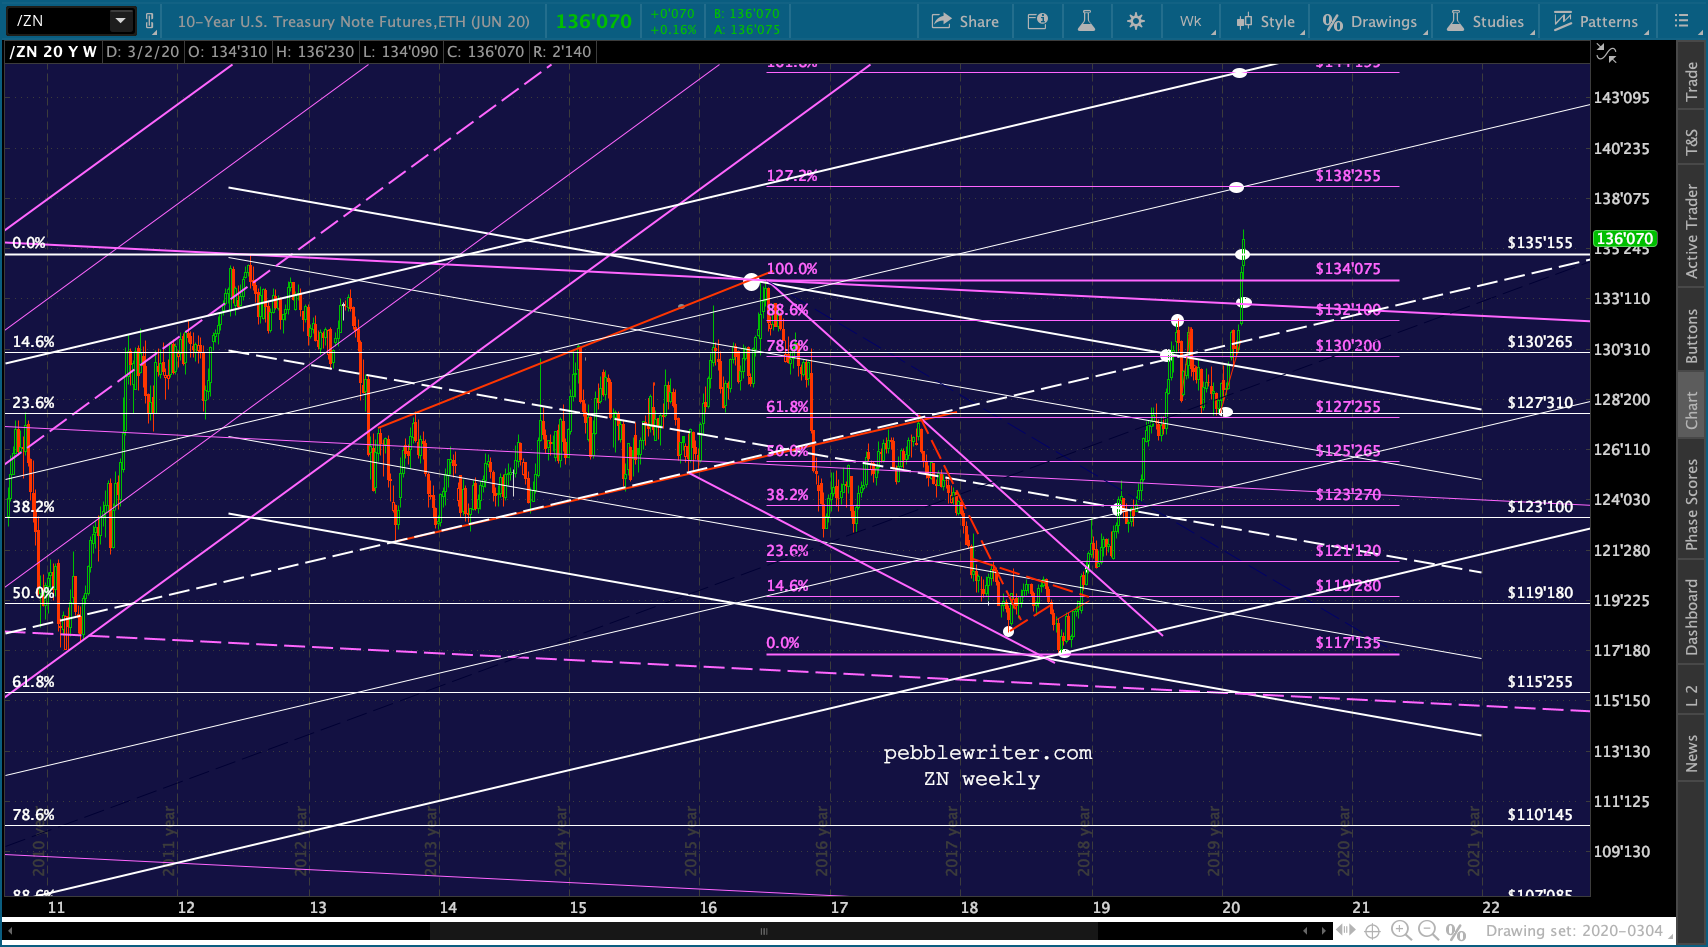
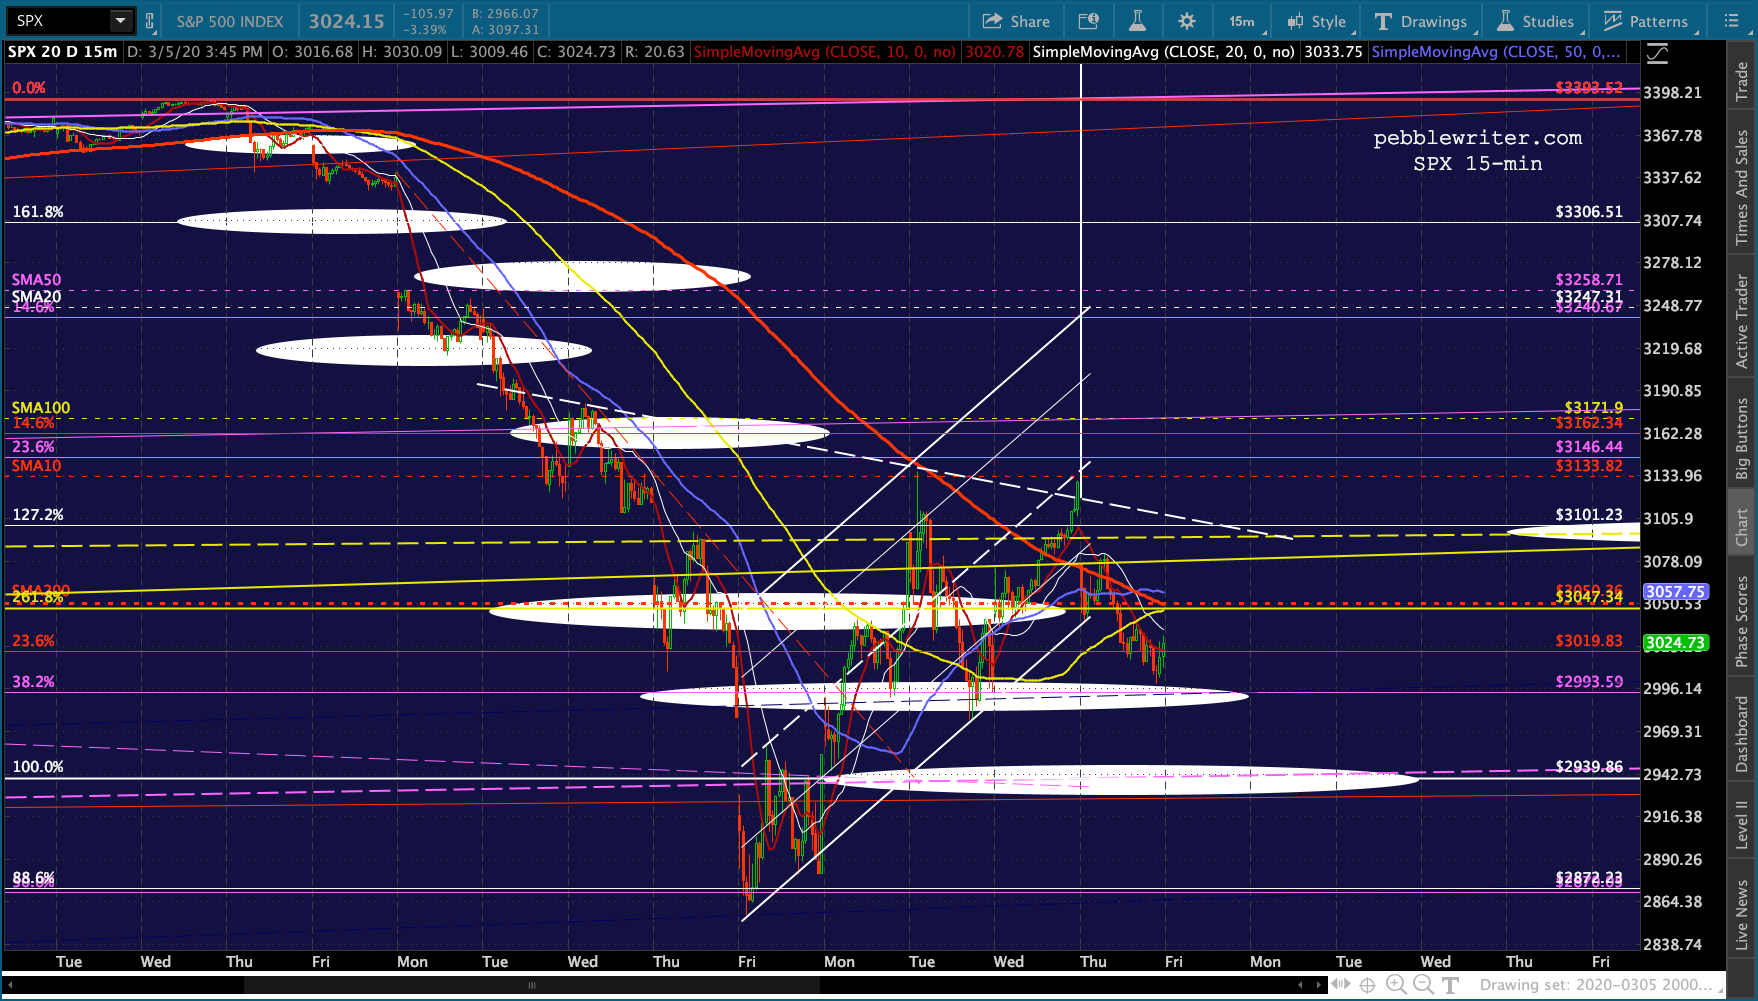
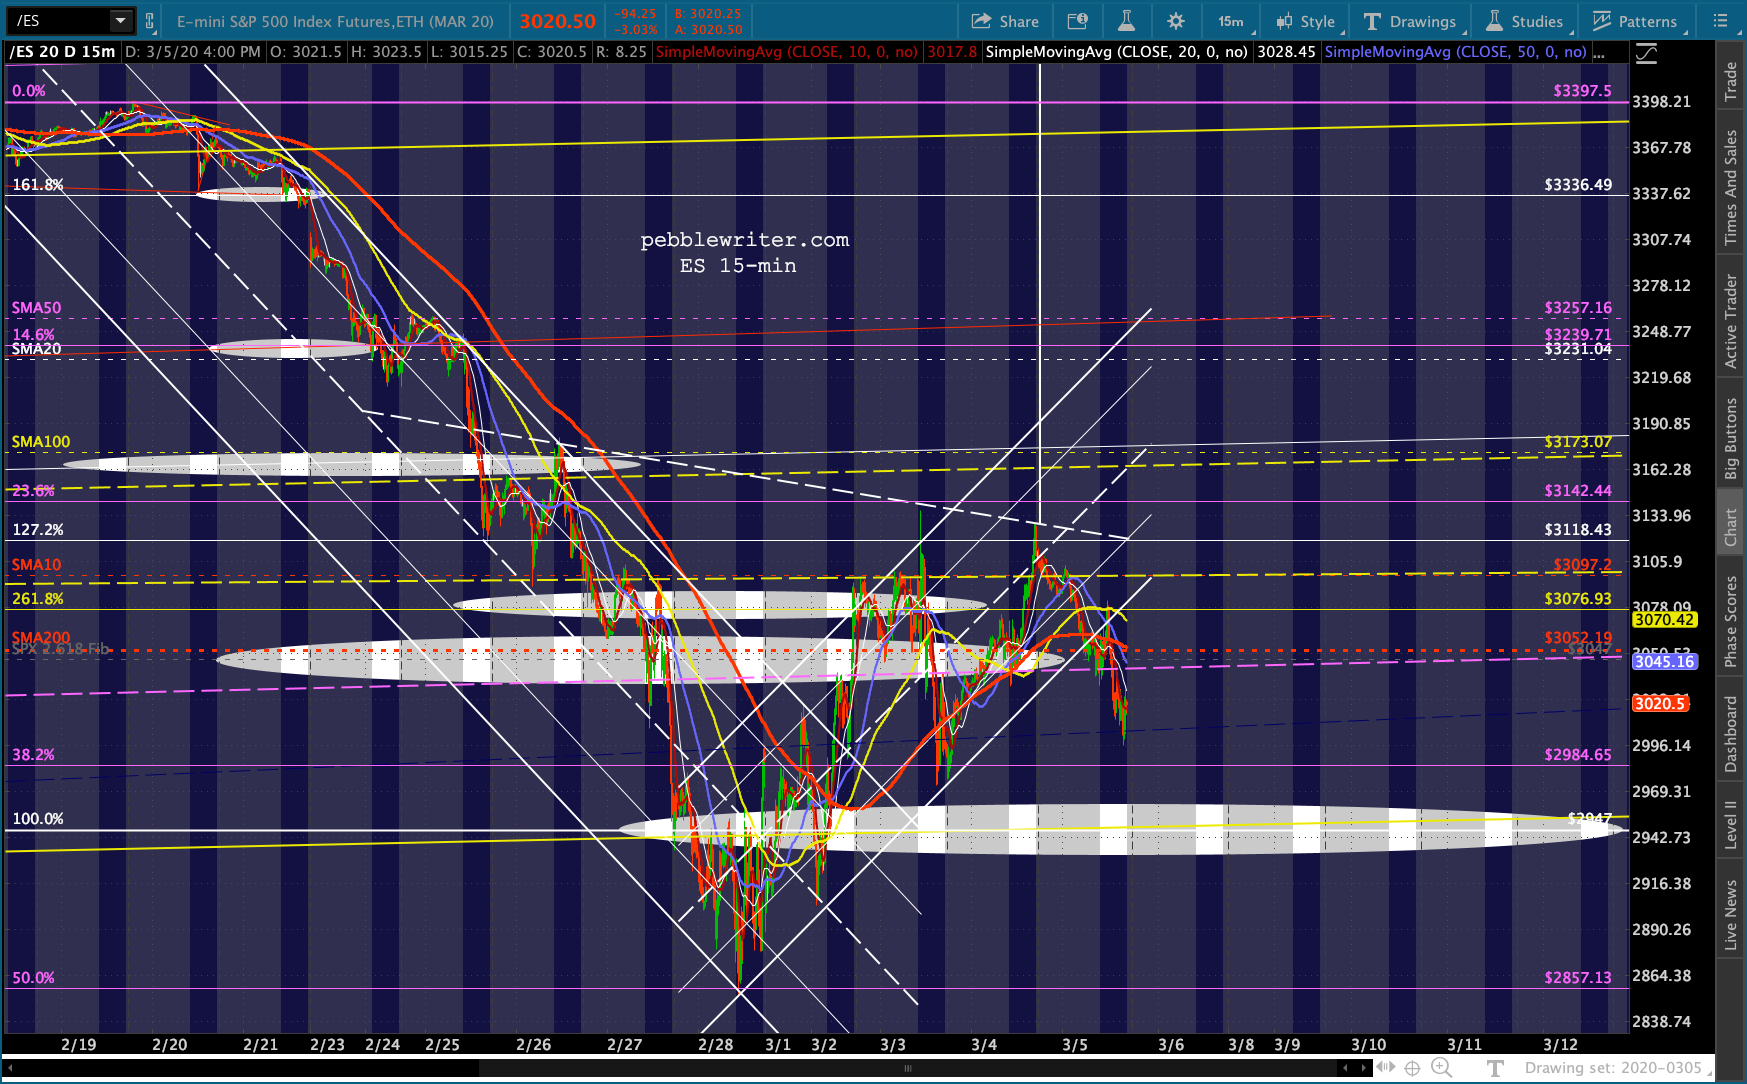
Bottom line, I’m still looking for ES 2728/SPX 2703 and, should those support levels fall, significantly lower targets to come into play.
 I will be out of the office from about 10am to 3pm today. I’ll post more upon my return.
GLTA.
UPDATE: 4:00 PM
The day went pretty much as poorly as it could without falling completely apart. The 2Y tagged horizontal support and the 10Y reached our .90 target. DXY and USDJPY broke down. About the only positive thing is that CL didn’t break down. Yet.