

Q2 GDP came in slightly below consensus at 4.1%. The good news is that it’s a healthy number, certain to earn its way into headlines (and presidential tweets) from now until at least Nov 6.
The bad news is that, thanks to the “good” and “easy to win” trade wars, at least 1% of the print was attributable to accelerated exports – primarily soybeans. In other words, it was borrowed from future quarters. It’s safe to say a good chunk was also attributable to much higher oil and gas prices.
Futures are flat – still loitering (3rd day) within a few points of the Fib .886 retracement. With oil’s rising wedge looking ready to pop and the dollar still under pressure, can stocks still break out?
continued for members…
Note that the 10s2s steepening is taking a breather.
 Rates remain elevated, but have leveled off even as RB is up slightly.
  Amazon’s earning blew away expectations, yesterday, even though revenues missed.
  From a technical standpoint, the stock backtested its 1.618. Though, it continues to exhibit striking negative divergence on both the daily and 60-min charts.
 No change in VIX, which continues to decline in line with the red TL overhead. Today, it intersects with the SMA10, which makes it doubly important. Needless to say, a breakout would be an excellent signal to short.
 Things are quiet on the currency front, too. Though, the BoJ had to step in again with an offer to buy everything in sight as the 10Y crept over 0.10% again.
  Not sure how much longer this can go on, but it’s feeling quite extended.
  Ditto for the EURUSD, which has been going sideways for two solid months.
  RB continues to inch higher, breaking through the TL, but has reached channel and Fib resistance.
 The falling gray channel top should provide solid resistance if RB can break 2.18.
 It can be seen better on the daily chart. However, note that RB is already at the upper bound of the range established in June. Given that it just bounced at horizontal support, I suspect it’ll reverse here at horizontal resistance.
 CL’s rising wedge is hard to ignore, as is the fact that its SMA200 is about to exceed its June lows. I remain quite bearish on both and would want to be short at this point.
 The Dow has broken out, but doesn’t look in any particular hurry.
  The big picture for both ES…
 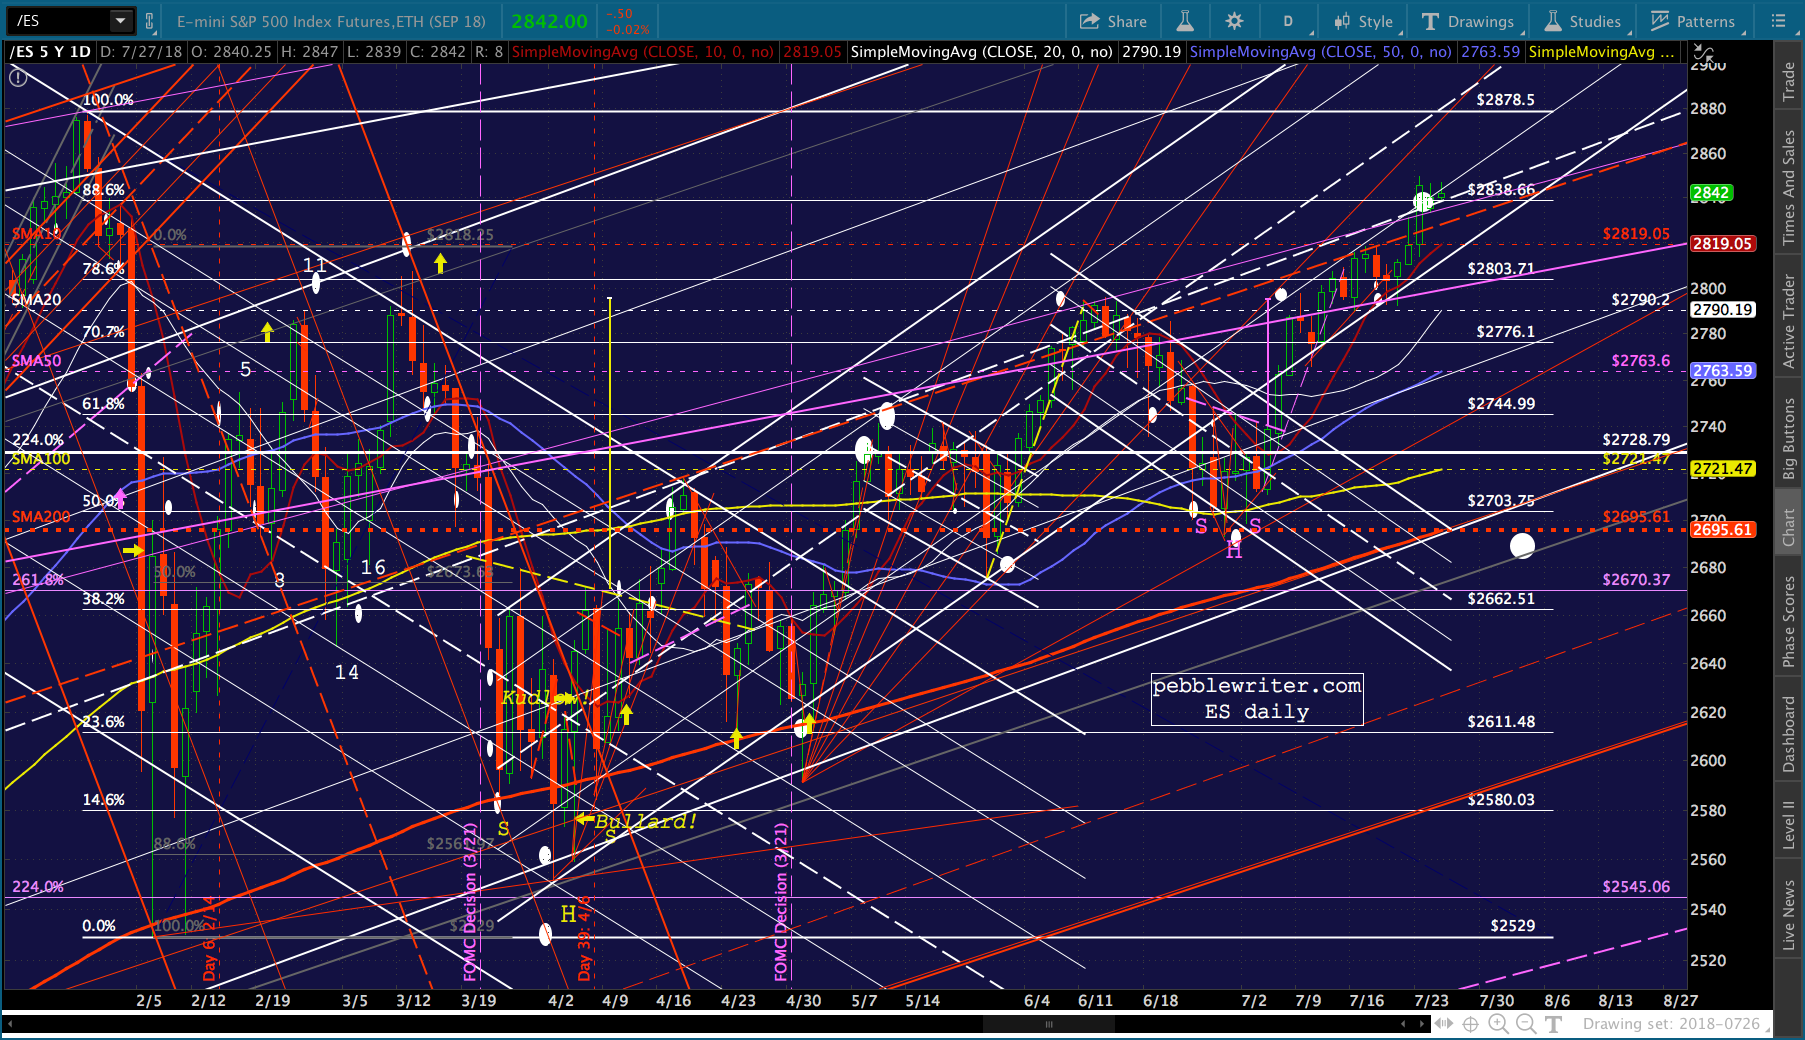 …and SPX.
  And, a smattering of other stocks of interest. Netflix, which had some serious negative divergence going, has potential RSI channel support here. If it doesn’t hold, the stock has potential to 300.
 And, GOOGL is still closing in on its 1.618.
 FB held its neckline overnight, but has not held its SMA200. It continues to look quite weak.
 And, COMP continues to intrigue me. Note that its SMA200 is just about to the purple channel top — offering an interesting backtest opportunity a la SPX.
 I’m going to take the rest of the day and dig into the economic numbers a bit. I’ll check in if something important happens. But, for now at least, markets are safe as long as ES remains above 2838.66 and SPX remains above 2834.09. If either falls below, I’d want to be short.
Are they being artificially propped up? Of course. Can it continue? Maybe.
UPDATE: 10:50 AM
ES and SPX are backing off their .886s. Initial support for ES is the midline and SMA10 at 2819.05. Below that, there’s the formerly broken channel at 2810-2813. Once that fails, there isn’t much support until the .618 at 2753, followed by the SMA200. If things should fall that far, the SMA200 is currently above June’s lows and will reach the .886 around late August. So far, VIX is confirming. But, I’d keep a close eye on it.
 CL and RB are also looking weaker, but have not broken down.

 COMP: so far, so good.
 UPDATE: 12:40 PM
ES has dipped below its SMA10 and is closing in on the channel bottom around 2813. SPX’s SMA10 was 2814.21 based on yesterday’s close, and is 2815.84 if it were to close here. The low so far is 2816.50, meaning we could get a bounce any minute.
 VIX has broken out and has reached its red midline and SMA50 at 13.51. It could reverse here, but if it doesn’t the SMA200 is up ahead at 14.35. After that, I like 16.41 and 17.48.
 This midline has stopped plenty of equity selloffs — essentially all of them between Sep 2017 and Jan 2018.
 COMP is coming along nicely, will face horizontal support at 7637.27.
 I’d keep a very close eye on VIX. RB/CL haven’t broken down yet, could make a huge difference if they do.
 UPDATE: 1:05 PM
ES just tagged the white channel bottom — which should offer some support. Not a bad place to take profits (aka, the “easy money”) or at least reset your stops.
 VIX got very close to the SMA200. Any push through it, along with a drop by VIX through 2810, would be a solid signal for our lower targets.
 I have to jump on a conference call for the next hour or so. More later.
UPDATE: 3:40 PM
VIX is slowly settling lower, suggesting a partial recovery in the next 20 minutes. We’ve seen so many instances of VIX getting pummeled in the last few minutes. These sorts of closes are always problematic. Hold short only if you can handle the risk of a weekend gap higher, but my gut says SPX is heading to at least 2800 and potentially 2703.


Comments
One response to “Q2 GDP: Jul 27, 2018”
DOW held up well.