Posts

  • Update on Gold: May 15, 2013

    Our last update [Apr 15] devoted to gold came in the midst of a huge meltdown.  Gold had lost channel support, horizontal support at the psychologically important level of 1500 and was dropping like a rock through 1335.

    Never one to shy away from an opportunity to embarrass myself, I gave my best guess:

    we [should] get a nice bounce between here [1337] and 1309 and a backtest of one of the broken channel lines — say the white midline around 1410 or even the 1450 level.

    GC shed another 14 points to 1321 the very next day, then rebounded strongly to 1404. Another two weeks on, GC nearly reached 1500 before fading once again.

    Now, at 1373, it has reached a critical juncture that should result in either a sharp rally to 1560 or a plunge to 1141 in the coming month or so.  If that sounds like an impossibly wide margin of error, there is a way to invest without getting fleeced.

    GC has risen via the giant red channel since 1999. The plunge to 1321 took it to the brink of another $200 breakdown.

    It bounced at the channel bottom, though, and made a nice comeback… until May 3, that is.  At that point — having retraced a Fibonacci 61.8% of the damage done by the fall from 1590 — it did another about face.  It’s now only $11 from tagging the .786 retracement (1357) of the rise off the 1321 bottom.

    The Harmonic Pattern could go either way.  The 1487 high on May 3 came at the .618, so a Gartley, Bat, Butterfly or Crab Pattern could result in a climb back to 1532 – 1756.   Though, that would mean a breakout of the falling channel its been in since last September (in white, above.)

    Long positions could be played from the .786 (1357) or .886 (1340) as long as stops are watched very carefully and updated frequently.

    The downside case is probably stronger.  If the current plunge continues past 1321, there are only a few key levels of support before things get really nasty:

    • horizontal support at 1302-1309
    • potential Fib targets of 1276 (the 1.272) or 1219 (1.618)
    • Fib support at 1141-1157
    • Fib support at 947

    I don’t have a dog in this fight.  But, if I did, I’d be watching very closely to see if GC can catch a bounce north of 1300.  If not, it might easily form an inverted cup and handle and continue to be a great shorting opportunity.

    If that should happen, look for the large white channel to influence the drop. The white .618 at 1155 is tantalizingly close to the bottom of the channel in mid-July.

    GLTA.

  • To the Moon?

    Stop me if you’ve already heard this one…  Ugly economic reports, US dollar shooting higher, euro and yen breaking down, equity markets selling off after huge uninterrupted gains…

    What could go wrong?  I’ll play along on the downside… again…  but can’t help wonder if this merely proves I’m the most stupid person alive.


    Bad news is good news, right?  There’s plenty here.  With the EURUSD continuing to slide…

    …and the dollar soars, testing the July 2012 highs…

    …in the midst of a downturn in US manufacturing as evidenced by falling Empire State Manufacturing numbers (big miss), declining PPI, declining industrial production, declining capacity utilization (smaller misses)…

    Needless to say, a rising dollar won’t do much to help US manufacturing.  Simply put, our stuff will be more expensive to foreign buyers, and their stuff will be less expensive to US buyers.

    It’s great if you have your eye on a new Prius or HD TV.  Not so great if you’ve recently hired a bunch of factory workers for the economic rebound everyone’s talking about.

    On the off chance that it matters, this chart sums up the May Empire State manufacturing survey.

    There are few bright spots in the entire report.  Pretty much every category shows weakness.

    The stock market, however, thinks this is just fine.  As long as truckloads of cash continue to be injected into the markets, no problem.  The lack of inflationary pressures, continued weakness in manufacturing and employment… these factors play nicely into the doves’ hands.

    UPDATE:  10:20 AM

    SPX sold off almost 4 points, but has since retraced almost .786 of the losses since yesterday’s high.

    SPX has obviously traded above the latest 2.24 extension (small purple), the 2.24 extension of the 1474-1343 correction last fall (yellow), the TL from the 1994 & 2002 lows (dashed purple) and the red channel midline.

    We should see a reversal at the .786 at 1650.15.  If that’s the full extent of the retracement, we could get some momentum on the downside.  Otherwise, SPX would be pointing to 1652.52 and higher.

    UPDATE:  10:59 AM

    It’s pretty obvious we’re heading to 1652.52 or higher.  Switching to a long position here at 1650, stops at 1649.

    If anyone’s wondering, that whooshing sound is my foot striking…nothing; the football was yanked away once again.

    It makes sense to take stock at this point and figure out the rules of this “new normal” — if that’s indeed what it is.  Some thoughts on trading this market…

    continued for members(more…)

  • Charts I’m Watching: May 14, 2013

    The eminis continue to bump along at harmonic resistance: the red 2.24 at 1626.41 and the small white pattern’s 1.618 at 1631.62.

    ES 60-min…

    The DX is right back to the levels reached on Friday — the white channel midline.  A thrust above would likely kill off the equities rally (or, at least hobble it.)  A retreat would be bullish.

    The fact that it hasn’t yet pushed through has to be bullish in the short run, but the fact that it’s balanced on the precipice is ample grounds for caution.  Tomorrow marks the day on my charts where the white midline and purple midline intersect.

    DX is poised just below both, so a push higher would be very important.

    From a harmonic standpoint, a move above the Apr 4 high of 83.66 kills off a potential downside scenario to the white D.  Today’s high so far: 83.53.

    SPX has opened stronger, completing the small white Crab Pattern 1.618, the red Crab Pattern 1.618 and the larger white Crab 2.24. The only harmonic target left is the white 1.618 at 1642.38.

    I show the top of the purple channel at 1640.34 and the red channel midline at 1640.63.  Remember, 1640.90 was our preferred target.

    It is right next to the IH&S target we identified in April and is a great harmonic fit with the downside scenario.  More on that in a moment.

    SPX just tagged the red midline and purple top at 1640.89 — close enough for me.  I’m shorting here.

    The white 1.618 is still up above at 1642.38 — and it’s a decent looking pattern.  So, we might be a couple of points early.  Any push higher and I’d likely just take an interim long.

    There’s also an interesting Fib extension at 1646.73 — the 2.24 extension of the 1074 – 1292 rally in late 2011 as applied to the 1158 Nov 2011 low. It intersects there with the purple TL from the 1994 and 2002 lows of 445 and 776.

    And, on a smaller scale, 1640.47 was the measured move target from 1626.74 yesterday.

    UPDATE:  10:15 AM

    SPX just tagged the white 1.618 at 1642.38.  As discussed above, if we don’t get a reversal here I’ll add an interim long position.

    UPDATE:  10:28 AM

    Getting a push higher, so I’m adding an interim long position here at 1643, with trailing stops.  If SPX pushes higher than 1648, I’ll consider abandoning the short position.

    continued for members(more…)

  • Update on RUT: May 13, 2013

    RUT has been loitering near the top of a large channel dating back to 1998 and a rising wedge dating back to 2008.  These patterns signaled a possible top.  But, there were some unresolved Harmonic Patterns at slightly higher prices.

    Things got resolved on Friday.

    continued for members(more…)

  • Charts I’m Watching: May 13, 2013

    We’ll be watching to see what, if any, fallout there is from the Hilsenrath article on Friday after the close.

    The eminis are looking weak this morning.  Recall that they reached the combination 1.618 and 2.24 extension Thursday, and are still down from that level.

    Back test or breakout?  Until we actually see a thrust back into the white channel, I’m assuming back test followed by a decline.

    We’ll go short on the opening, but be ready for a breakout if/when.

    The dollar fell out of the steep, narrow channel – but has yet to react much as it exceeded the previous Apr 24 high.  Not much rationale from a harmonic standpoint to reverse after doing that.

    It was the tag of that white channel midline that had me thinking Friday that we’d see a pullback when it reopened, but so far it’s not much of one.

    The EURUSD is still showing weakness post the purple channel breakdown, but has still only retraced .618 of its rise from the Apr 4 bottom.

    In the absence of a reversal — a distinct possibility given the latest falling wedge — we can expect at least .786 on the red grid (1.2850.)  But, that might be all the weakness we see if the rising white channel holds.

    The USDJPY hit both our IH&S and Crab Pattern targets on Friday, but still not much of a reaction.

    SPX has put together a really messy topping pattern these past several days since its Mar 9 high a few days prior to our target date of today.  And, it never quite tagged our targets of the yellow 1.618 at 1635.25 and the white 2.24 at 1637.15, let along the IH&S target of 1641.

    It closed just below the .886 at 1633.65 on Friday, leading me to think there was a Crab Pattern extension in its future (a Bat Pattern would have required a Point B < .618.)  All we’d need is a reasonable Point C, which I think we just got courtesy of this morning’s little sell-off.

    The opening price just fell, so I’m going to try a long position this morning and see if it can rally.  Going to take a stab here at 1630.

    The key to the upside is breaking 1633.65 and then 1635.01.  Key support on the downside is 1626.74 and then 1623.09.

    UPDATE:  1:55 PM

    SPX broke the 1535.01 high, and then backed off some. An .886 retrace of the last leg up would be around 1627.80 — not a bad neighborhood for a stop as it intersects with the red .25 channel line in the next hour.

    For reference purposes, the bottom of the red channel is currently about 1617, and it intersects there with the next lower purple channel line (the .75) in the next hour or so.

    SPX reached the yellow 1.618, so the Crab Pattern can be considered complete.  Recall that 1635.25 has been on our radar screen since Apr 23 [see: CIW Apr 23] when it first appeared SPX might be setting up a Crab Pattern.

    It was confirmed on May 3, when the 1597 high was topped.  The reasons for a downturn then are just as valid today.

    continued for members(more…)

  • Charts I’m Watching: May 10, 2013

    The market bounced back a little into the close yesterday, and recovered further overnight.  ES retraced a Fibonacci .886 of the initial plunge, and is hanging in the small channel established over the past week.

    We shorted SPX at 1635 yesterday, but weren’t sure whether or not the upside was completely done. This morning, there’s still some question.

    The dollar, which we remarked yesterday morning looked “ready to rumble” did just that — completing its largest move in the last 16 months.  It retreated just a bit off the .786 before zooming up to tag our .886 target at the purple channel midline.  How it handles this price level will determine whether or not we see any follow-through on equities this morning.

    We would normally see a pull back at the .886 — a Bat Pattern.  But, Bats can and do go on to become Crab Patterns — which would mean a move up through the channel midline to the 1.618 extension at 84.522.

    Daily RSI arrived at a 4-way “stop sign” overnight — three channel midlines and a channel top.  Though it might ultimately push through, this supports the idea of at least a pause and more likely a pull back, meaning stocks should rebound from here.

    The question, of course, is “how much?”  The EURUSD, which we remarked yesterday was “hanging by its fingernails,” wasn’t able to hold the purple channel.  It completed the small scale Bat Pattern we were expecting overnight (purple), and has potential to the red .886/purple 1.618 down around 1.28.

    The daily RSI supports this move, as it fell right through its nearest support overnight.

    All eyes are on Bernanke this morning, as he speaks at the Chicago Fed.  Evans and Plosser’s semi-public debate regarding QE has ratcheted up a notch the past couple of days. It’ll be interesting to see whether Bernanke can reassure the markets that economic conditions remain “just right” for continuing to pump $85 billion monthly into the markets: getting better every day, but not able yet to stand on its own two feet.

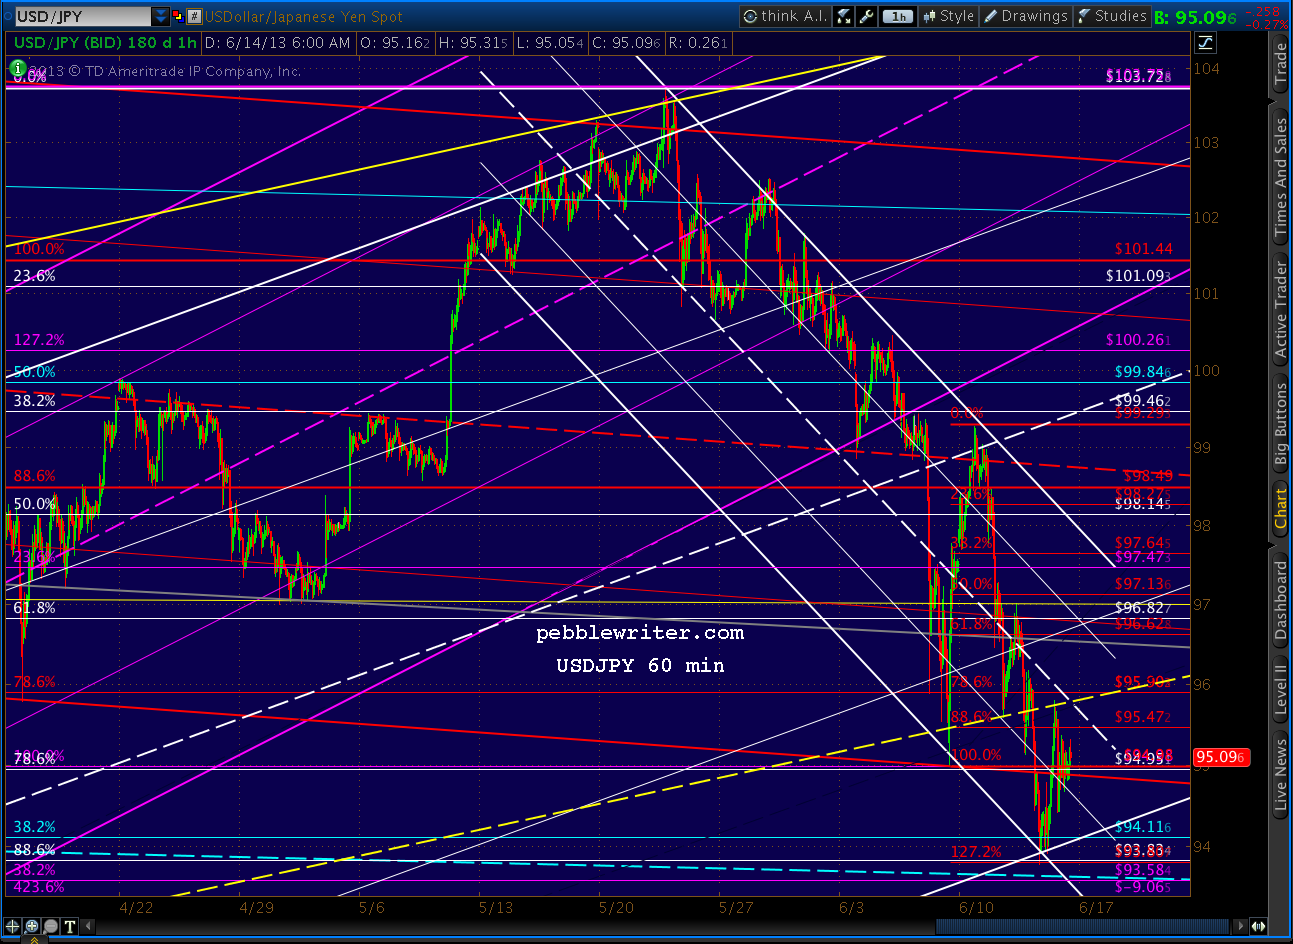
    The other big story, of course, is the yen. We discussed yesterday how it was a moment of truth for the USDJPY.  It was threatening an Inverted H&S Pattern, but had run into an important channel line.

    The pair sliced through it like it wasn’t there, completing the IH&S, then reaching the IH&S target and a Crab Pattern near 102 in one fell swoop.  In the process, it reaffirmed the dominance of the rising purple channel from 75.56 in October 2012.

    A quick pullback could reassert the white channel; but, if not, the next stop is 105.57-106.98 as soon as May 21.

    But, the daily RSI suggests a very good chance of a quick pullback.

    The Nikkei 225 has loved the yen implosion, zipping through the .618 retracement of the 2007 crash and a well-defined channel top on May 3 and threatening to top the Dow.

    But, the collapse in JGB (and spike in yields) gives one pause.  This is what Abe wanted, but is he prepared for the currency wars he’s unleashed with neighboring Asian countries?  Sri Lanka, Vietnam, Thailand and South Korea have all either cut rates or are about to.

    I wonder whether Japan, with government debt at 240% of GDP, will survive the cure for its economic malaise.

    UPDATE:  9:30 AM

    I’m taking an interim long position on the opening, but will be watching to see what happens at 1631.  My core short position will remain in place unless we get a push up through the red channel midline. Stops on the long at 1626ish.

    I would have been more than content to close out the short at yesterday’s close, but the low for the day was slightly lower than the previous “bottom” of 1623.30, leading me to believe we might see another leg down.

    We’ll see what Bernanke has to say, then check back in.

    UPDATE:  10:00 AM

    A bit of a snoozefest in Chicago.  Bernanke’s giving a history lesson, not saying anything yet about the topic on everyone’s mind: QE.

    SPX just reached the red channel midline mentioned at 9:30, just shy of the .786, and is deliberating next steps.

    The dollar continues to strengthen, making a series of smaller waves higher while remaining above the .886 Fib discussed above.  And, the EURUSD continues to leak lower — just reaching the .236 of the 1.37 high In Feb.

    UPDATE: 11:5 AM

    I’ll be closing the interim long here at 1626 due to the triangle breaking down. Full short for  1613-1617 (favored target about 1614.) Confirms with a drop through 1623; should get a bounces around 1624 and 1622.

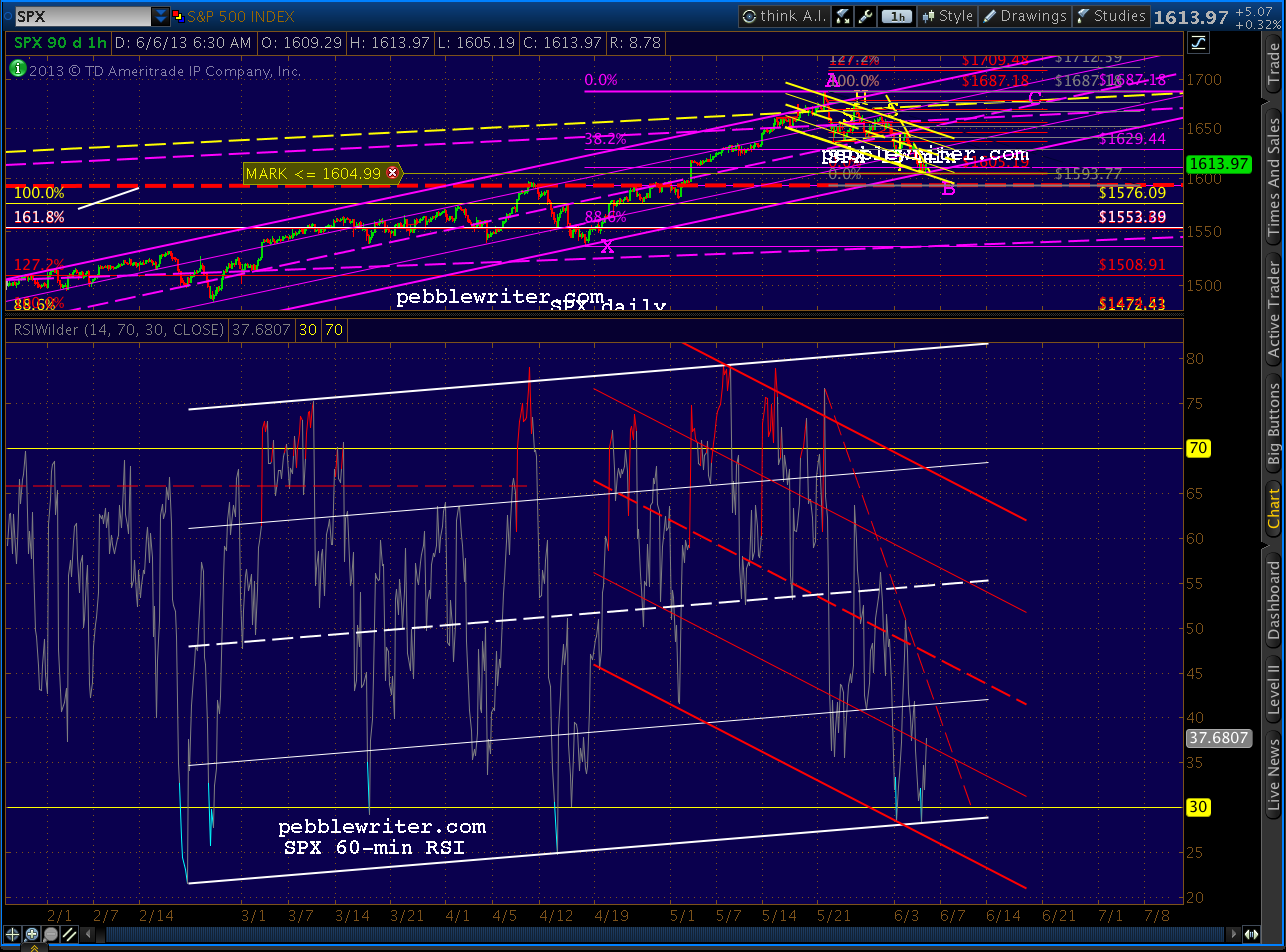
    60 min RSI shows a little room to run.

    Watch out for a possible backtest of the triangle to around 1627.75.  Stops on the short at the top of the triangle, currently about 1629.

    If there’s something that could derail any further downside, it’s the EURUSD.

    It reached the .618 of the 1.2743 to 1.3242 rise this morning (small red pattern), and can be expected to bounce.

    It’s also getting dangerously close to the bottom of the light blue channel that rises from July 2012.

    Technically, the .618 is enough of a retracement for this wave to be finished.  But, it certainly doesn’t look finished.  I think it’s more likely we’ll get an intra-day push down to the red .786 (1.2850) or even .886 (1.28) before all is said and done.

    A sustained break of the channel bottom, needless to say, would be exceedingly bearish for the euro and for equities.

    UPDATE:  1:30 PM

    Based on my best stab at placing the falling white channel, I believe SPX just topped out on the day.

    Next stop should be around 1622 at the midline, but ultimately the green 2.618 should come into play where the white channel bottom and red channel bottom intersect — probably around 1614 on Monday.

    The next major support would be the purple midline — around 1593 on Monday — and then the previous high and purple .25 of 1576.

    If I’m wrong, stops at around 1630 ought to do it.  I have to run out till 3PM ET, but will post more when I return.

    GLTA.

    UPDATE:  3:44 PM

    SPX just moved up past my comfort zone — not to mention out of the channel — so I’m switching sides here at 1630.  Next stop 1641-1642?  It’s the 1.618 extension of the fall from 1635 to 1623 and the approximate level of the IH&S.

    Best of all, it will happen on the 13th, which is when we originally had the interim top scheduled.  All is right in the world again.

    Legible chart coming up…

    I wouldn’t normally stay long over the weekend, but I imagine we’ll gap up to 1641-1642 Monday morning, so it’s worth a shot.

    Looks like we’ll probably close at the .886.  We might get a small reversal just ’cause, but Point B in this case was almost the .786, so that technically rules out a Bat Pattern.  Instead, it’s a Butterfly/Crab that should extend to the 1.272 or 1.618.

    Of course, things don’t always go according to plan; but, I like where the currencies are finishing up.

    More in a few

    UPDATE: EOD

    The revised view from the treetops:

    And, a little closer in…

    “D?” doesn’t work as a Bat Pattern because “B” is higher than the .618.  We could use the reversal at the .500, but “A” is the lowest low, so that doesn’t work.  That leaves a Crab Pattern with roughly a .707 Point B — if it follows the rules.


  • Anticipation

    It certainly looks like we’re almost there.

    The eminis seem to be already there…

    The EURUSD is clinging by its fingernails…

    The dollar looks ready to rumble…

    The USDJPY is making a bid for an IH&S, but has run smack dab into that yellow channel midline again…moment of truth for the yen…

    This morning’s dip in SPX is appealing, but look how many times over the past several sessions the red channel midline (now around 1627.25) has come to its rescue…

    A break below 1626.46 and it’s probably game-on.  But, we haven’t quite hit our 1635+ target.  I’m inclined to believe this is a fakeout to buy a little more time, shake out a few weak bulls before the final thrust.

    UPDATE:  12:25 PM

    SPX continues to bump along.  It recovered from the first plunge down to the red midline, and is back at it only 2 hours later.  This time, however, there’s a small Head & Shoulders Pattern at stake.  It would complete at 1627.33 and target around 1621.30.

    Remember, we’ve seen more than a normal number of H&S Patterns not play out over the past couple of months.  So, odds are that this is another shakeout brought to you by your friendly neighborhood market makers.

    As always, use stops — and update them frequently to keep them where you’re comfortable.

    continued for members(more…)

  • USDJPY Update: May 8, 2013

    USDJPY has continued to slide since our Apr 8 call for a top [HERE.]   It back-tested the broken purple channel midline on May 6, and is signalling a sell-off to at least the bottom of the purple channel (96.25 – 96.66) where it intersects with the white channel .75 line in the next day or two.

      But, if the most obvious harmonic patterns play out, we could easily see the purple channel break down and the white midline come into play at the intersection of the .886/1.618 at 93.40/93.26 towards the end of May.

    Remember, it was the white channel that confirmed the harmonic pattern reversals at 100 last month.

    “…there is growing risk of a downturn as it approaches 100… it appears the pair might have hit at least interim resistance at today’s high.”

    April 8, 2013

    continued for members(more…)

  • The Melt Up

    The market continues to melt up, enjoying the lack of any meaningful overhead resistance — for now.  As discussed yesterday, that should change around SPX 1635-1643.  Until then, at least, I remain long.

    Meantime, the dollar continues to bounce around the channel lines, refusing to commit one way or the other.  We’ve been watching for any breakout that would signal an equity sell-off.

    In the past, thrusts towards the channel midlines has been trouble for equities: the dips to 1042, 1173, 1074, 1266 and 1343.)

    The recent completion of the purple Bat Pattern at the midline of the rising red channel also thrust past the white midline — but, produced only a 46-pt (3%) correction in SPX.

    So, we’re left to wonder whether something bigger is coming: perhaps a run to the white .786 (85.47) to complete a big Gartley Pattern and tag the purple midline.

    Note that the purple 1.272 is at about the same level, but there’s no argument for a Butterfly Pattern on the purple grid, only a Crab Pattern up at the 1.618 extension (also the white .886) around 87.

    I’ll be watching to see whether or not the small rising purple channel holds.  If it does, the potential white harmonic pattern won’t play out and DX will remain above the .25 red channel line.  If not, there’s potential to the bottom of the red channel at 79.93.

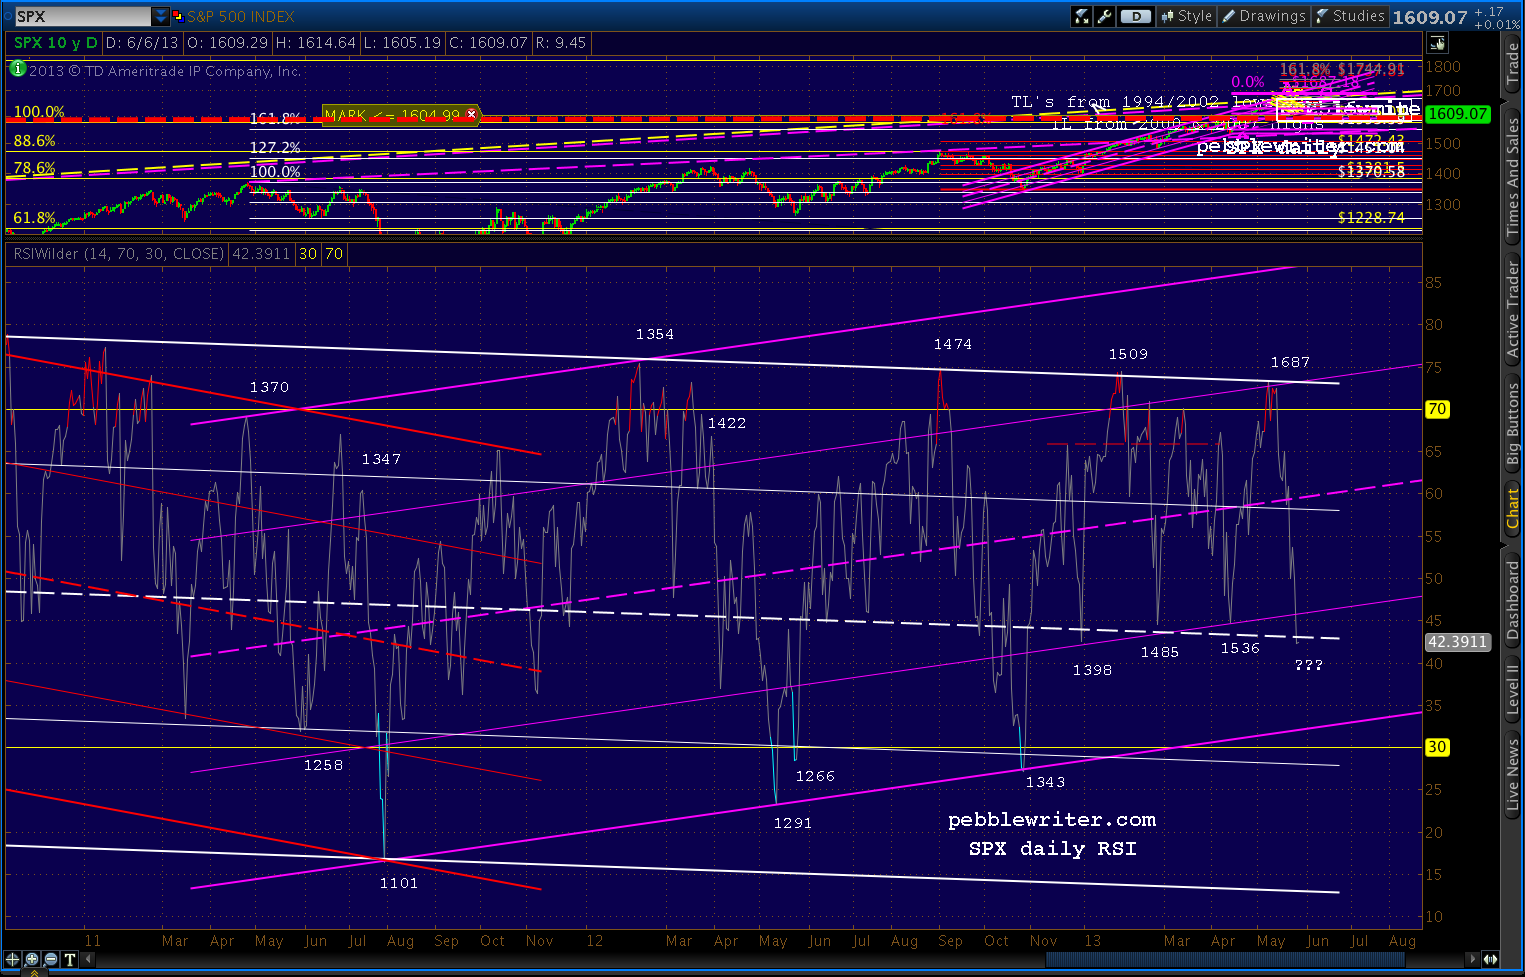
    The daily SPX RSI channels offer a bullish scenario if SPX can push through resistance at 1635-1641.

    The past two days saw it break the TL connecting the last three spikes higher, and today’s value has topped the previous peak — so, a potential break in negative divergence.

    But, the daily chart can be deceiving on an intra-day basis. The current push above the yellow TL and red channel midline could be erased with a reversal later in the day.  If RSI is repelled at the red midline, the white midline or lower would be back in play.

    Will SPX push through?

    continued for members(more…)

  • Charts I’m Watching: May 7, 2013

    Markets continue in a consolidation mode post breakout.  The EURUSD seems to have found its footing, with a couple of choices still possible for the operative channel and harmonic pattern in the near term.

    The USD appears to have found support at the intersection of the rising white channel and the .382.  If it’s able to hold these levels, look for a return to test the yellow channel midline and the .618 at 82.577.

    SPX just reached a small scale 1.618 at the midline of the small white channel.  We have been waiting for a backtest of the IH&S neckline (yellow, dashed) and/or broken TL’s that would confirm the operative rising channel.

    This price level has potential. But, given the strength of many of the European markets, such a pullback might have to wait until SPX reaches our next target.

    We’ll keep an eye on 1622, as a reversal through it would likely mean the back test is on.  I’d probably try an interim short there, with the most likely target being the intersection of the red channel midline and the IH&S neckline around 1614.09 around 12:15 ET.

    continued for members… (more…)