Posts

  • Update on USDJPY: May 29, 2013

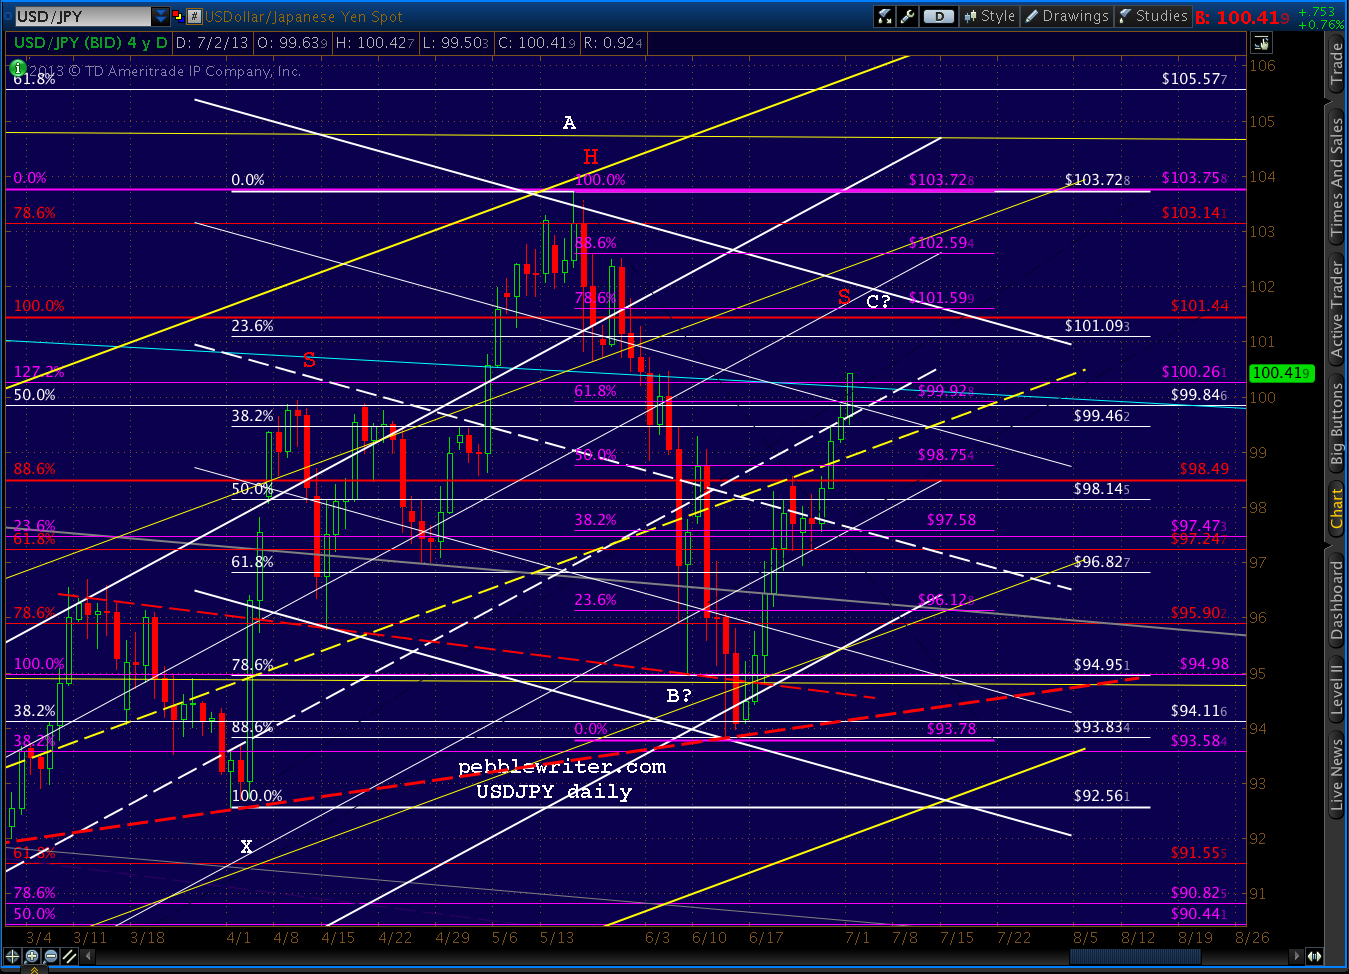
    After recently completing a Crab Pattern at the 2.24 extension, USDJPY fell back through the purple channel midline to the 1.272 Fib level, where it is staging the backtest of the midline we forecast last week.

    While I expect the backtest to be successful, meaning a leg lower is in store, the 部屋に象 is the .618 at 105.58. Note that this is the 61.8% retracement of the 39% crash from the 2007 highs.  It happens to coincide with a number of significant channel lines, so tagging it could be a very big deal.

    continued for members(more…)

  • Update on NYSE: May 28, 2013

    NYA recently reached an important turning point.  More than any other index, it suggests that a significant downturn has arrived.  The only hitch?  Its Harmonic Patterns have typically been overruled by SPX.

    In April 2010, NYA was still 3.4% away from its 61.8% Fib level when SPX, 0.7% away from its 61.8% retracement, reversed sharply.  The Gartley Pattern that SPX missed by only 0.7% in May 2011?  NYA was still a good 3.7% away (though both completed a well-formed Crab Pattern set up by the 2010 drop.)

    On May 22, NYA reached several important Harmonic Pattern targets, completing a Bat Pattern and three Crab Patterns.

    • the .886 retracement of the 2007-2009 crash
    • the 1.618 of the Jul – Oct 2011 correction
    • the 2.618 of the Sep – Nov 2012 correction
    • the 2.24 of the Apr – June 2012 correction

    Recall that when SPX hit its .886 retracement of the 2007-09 crash last September, it dropped almost 9% from 1474 to 1343.  The next lower major Fib level had been the .786 at 1381.  What can we expect from NYA, especially when the investing world expects that the Bernanke put will prevent a correction of more than a few percent?

    continued for members(more…)

  • Just Another Manic Tuesday

    If the 3-day weekend ramp job can hold, it’ll be 20 positive Tuesdays in a row.  But there’s a catch: ES just tagged the .618 Fib retrace at the top of what looks like a decent falling channel and a backtest of the rising purple channel’s .75 line.

    A close up:

    In short, holding these levels could be difficult.  I don’t think there’s any value in chasing this rally, and will look to short into it at the .618.

    SPX will play catch up with the futures on the opening, perhaps up to its own .618 at 1667.45.  But, DX is showing strength and EURUSD is showing weakness.  This is likely a bounce on the way lower for equities.

    UPDATE:  9:38 AM

    That should about do it for SPX.  Shorting again at 1668, stops around 1670 — the bottom of the recently broken red channel.  The .786 is just above at 1676.13 if it should push higher.

    It makes a difference which level SPX reaches on this initial push.  A rally to the .786 is much more likely to be the terminus of the corrective wave, while the .618 potentially sets up a move to 1681 to complete a Bat Pattern.

    UPDATE:  9:46 AM

    Looks like the .786 is in play.  I’ll continue to play along on the upside, with stops at 1667.  Since we got a bump last Thursday up to the .382, there’s the possibility SPX has the .886 in sight for a Bat Pattern.

    Many of the recent tops have been followed by a .886 retracement.  But, it’s usually after a drop of more than 3%.

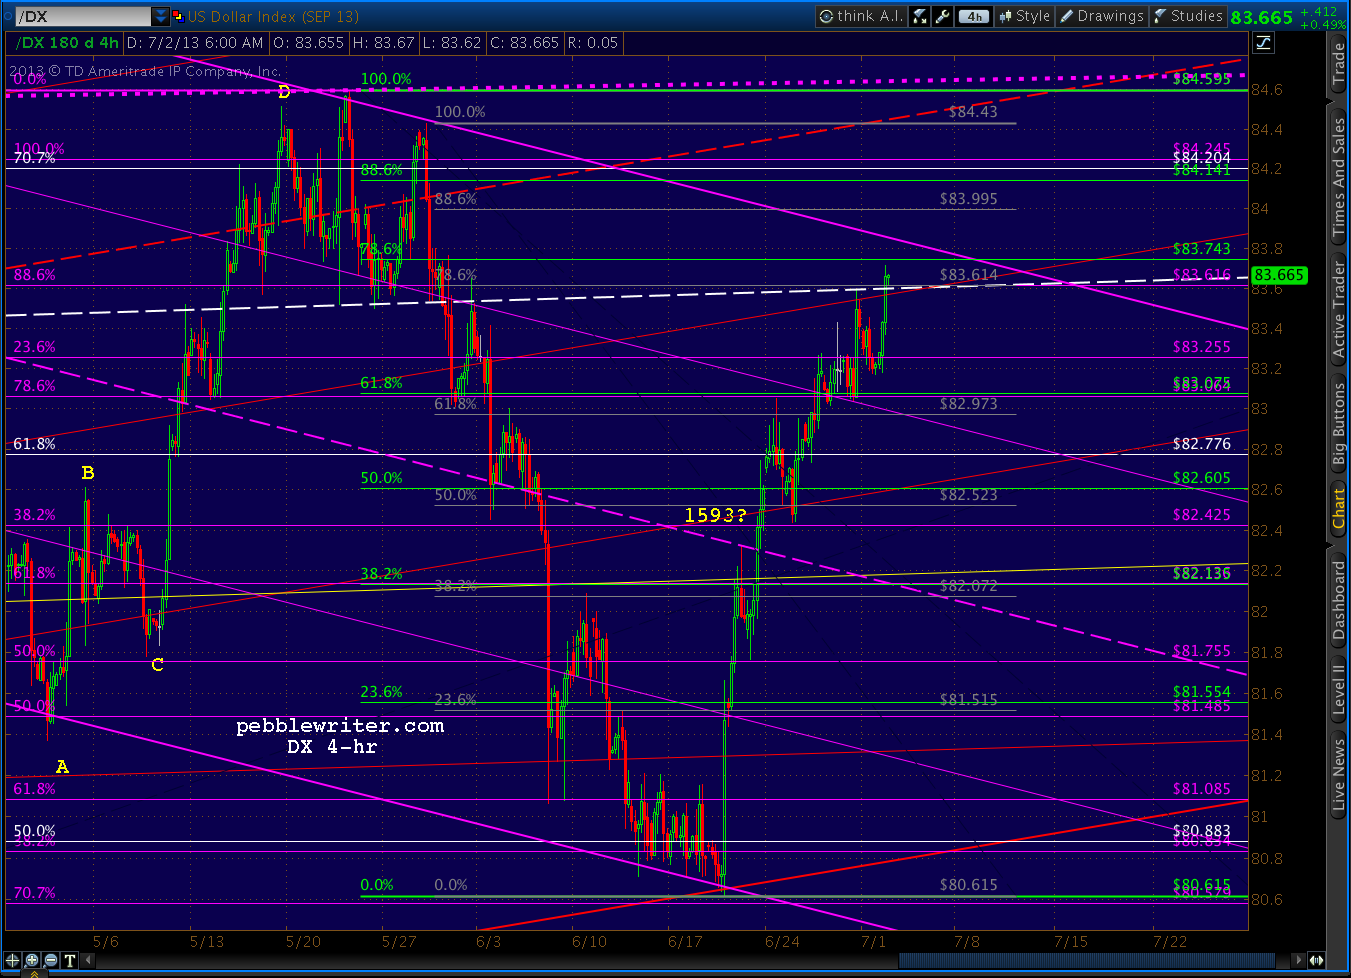
    The dollar has held the large white channel midline thanks to renewed weakness in the yen and continuing weakness in the euro.  A push through the red channel midline should see the index up to the white .786 at 85.471 in the next few days.

    The USDJPY recently completed a Crab Pattern to a 2.24 extension at the .75 line of the purple channel that’s guided the pair higher since last August.  It fell back to the 1.272 level, and is currently back-testing the channel midline.

    Though the .618 at 105.57 is definitely on my radar, I believe it won’t happen until the pair first retreats to the bottom of the purple channel channel — probably around 99.30-99.50 early next week.  This suggests continuing weakness in equities before any new highs can be expected (look for an updated USDJPY forecast after the close today.)

    The EURUSD is selling off nicely this morning, with our target of 1.28 – 1.2775 looking better by the hour.

    If 1.2744 should fall, however, there is much lower potential.  I’ll post the pair’s updated forecast after the close today.

    UPDATE:  10:45 AM

    SPX is currently backtesting the bottom of the red channel (1670ish.)  The likely target is still the .786 at 1676.13.  I’ve redrawn the falling purple channel, which intersects with the .786 in the next couple of hours.

     continuing

    UPDATE:  11:35 AM

    SPX pushed below the .618 Fib at 1667 and continues to leak a little lower — triggering our 1667 stop.  I’ll pick up an interim short position here, but this is likely a backtest of the yellow dashed TL from the 1994-2002 lows.  Keep an eye out for a reversal around 1665.  If it pushes through, the next lower support is around the broken purple .75 line around 1662.

    Remember, not every retracement has to be to a Fibonacci level. This morning’s rally got to 1674.21, less than 2 points from the .786.  It’s a perfectly acceptable corrective wave 2 if, as I suspect, there is additional downside ahead.

    The question came up the other day regarding the likelihood of Harmonic Patterns completing.  While certain patterns point to or suggest a subsequent move, they say nothing about the odds of reaching an ultimate goal — only the odds of a reversal upon reaching a goal.

    We had a potential Point B at the .382 on May 23.  It opens up the possibility of a Bat Pattern at the .886 of 1681.29.  If I saw corroborating patterns such as a channel top or midline, another Harmonic Pattern, etc. I’d definitely give it extra consideration. It increases the odds, but never ever becomes a certainty.

    At the end of the day, that’s the essence of my charting/investing technique: playing the odds, trying to find agreement among Harmonic Patterns, Chart Patterns and other technical analysis means to anticipate turning points — and being on the right side of the trade if/when they arrive.

    UPDATE:  1:00 PM

    The top of the falling purple channel, which is pure speculation on my part, intersects with the .786 in about 45 minutes.  It would make for a nice A-B-C corrective wave.  Right now, SPX is lurking around the yellow TL and the midline of a rising channel (white) I’ve drawn off the 1635 low.

    UPDATE:  1:22 PM

    SPX just broke down below the midlines/TL intersection.  I’ll likely close the long position and go short only with any push below the purple .75 line — currently around 1663.  I like the idea of a tag at the intersection of the rising white channel bottom and the .382 around 1655 in the next 45 minutes.

    UPDATE:  1:29 PM

    Full short here at 1663.  Watch for support around 1655.50.

    continued for members(more…)

  • Charts I’m Watching: May 24, 2013

    Staying short this morning. The short-term and longer-term pictures are turning more negative, and aside from bounces and/or Bernanke going on CNBC and yelling “psych!  It’s QE forever!” this slide could gain even more momentum today.

    In looking at some of the bigger picture charts, the daily and weekly RSI picture is rather gloomy.  The weekly RSI has downside momentum and won’t find channel support for quite some time.

    While the daily RSI has lost channel and TL support.

    Even the 15-min RSI promises at least another leg down.

    Note that SPX completed all the H&S Patterns we were watching yesterday, but which didn’t complete by the close — inserting just enough uncertainty into the equation to make me too nervous to stay short overnight.

    Ordinary market?  Sure.  No problem.  A market where even a hint of amping up Fed action could turn things on a dime…not so excited about that.  Naturally, that’s what the market makers were after by propping things up in the last few minutes.  The latest pattern actually completed, but quickly got bounced back above the neckline.

    All we need this morning is a push below 1635.53 to loosen things up a bit.

    DX tested the large white channel midline again.  Remember it broke out on May 13, and has now back-tested it three times.  It’s also reached the bottom of the rising purple channel.

    The large white channel is incredibly important, as it dates back to 2007-2008.  The peaks and valleys in the stock market are easily identifiable based on whether DX approached or exceeded its midline.  It’s in the lower right corner of the 20yr chart below:

    UPDATE:  11:07 AM

    SPX just nudged above the purple channel midline.  I’ll take a protective interim long position here at 1642, tight trailing stops.

    Note there have been many midline incursions, so this could be just another one.  Tight stops are very important on this position — with the key being not a price, but the midline itself.

    The purple channel is young, so there’s a possibility it’s not the operative channel at all.  I speculated yesterday that the corrective move might backtest the red channel up at the point marked “C?”  But, that point is no longer achievable within the falling purple channel.

    So, either the purple channel is wrong, or the rally is headed towards the purple .75 line (where it intersects with our falling purple channel) at 1660, or the rally is over and just doesn’t know it yet.

    This morning’s low pushed below the big purple channel’s midline momentarily, and has since bounced 6-7 points.  So, we can’t ignore the possibility that it will respect that support going forward.

    There are two basic possibilities for the corrective wave: (a) it ended at the purple C yesterday afternoon and this morning’s low was wave 1 of the next impulse down (which would be a 3rd wave); or, (b) we’ve only completed waves A and B, with C still to come — probably up at 1660, the intersection of the top of the falling purple channel and the rising purple .75 line (the white A-B-C.)

    If the falling channel is right, the white C has only till about 12:15 ET to play out.  After that, the top of the falling channel starts forcing the upside lower.  There’s a fan line that comes from the 1687 top (dashed pink, below) that, if broken, could open up that 1660 level in a hurry.)

    UPDATE:  1:05 PM

    Still walking it up… 1648.39 looks good for a short-term target (the next 10 minutes or so.) It could also be the full extent of this corrective wave, so I’ll likely revert to full short there.

    UPDATE:  1:38 PM

    That’s close enough.  Full short here, stops around 1649ish.

    Just went back and studied the previous purple channel midline tags in the previous corrections over the past six months.

    In Dec 2012, note it was 2 bounces, followed by a .618 retrace of the second, then the drop through the midline in the 11th hour.  The total 4.4% correction went from the top of the purple channel to the very bottom — and, in fact, established the bottom going forward.

    The smaller 3.1% correction in Feb 2013 went from the .75 line to the .25 line of the purple channel.  It got a big .786 bounce at the channel midline, then fell straight through to the .25 line.  It then retraced that entire move, dropped back .618 to establish a right shoulder, then polished off an inverted H&S pattern that kicked off the next leg of the rally.

    The last correction, at 3.9%, took SPX from the .75 channel line to the bottom in 6 sessions.  Its passage through the midline was quick and painless, though it took several tries and an overnight ramp job to break back above it on May 3.

    Of these three corrections, the closest in form and size to SPX’s current travails was the one in December: two bounces, 11 hours over 3 sessions, a .382 retrace of the initial drop to the midline from near the top of the channel.  It occurred over Christmas week, with Christmas day right in the middle, and the other shoe dropping on the 26th.

    UPDATE: 2:20 PM

    SPX just moved up through the .618 Fib and our 1649 stop level.  It might be a little overshoot designed to trigger stops, or it could be going to the .786 at 1651.52.

    The purple TL from 1994/2002 is also right there.  Adding a long for the extra 2 points seems kinda silly.  I’ll just sit tight with the short.

    UPDATE:  2:28 PM

    Looks like the .618 is backtesting, so I’ll try another interim long at 1648.43 and see if it can get up to 1655 by the close.  Stops at 1648.30.

    UPDATE:  2:34 PM

    SPX just ticked down below the stop, but the better place would the bottom of the little red channel.  Will hold the interim long until that’s broken.

    UPDATE:  2:46 PM

    That was a smart move, as the bottom of the red channel held without any trouble. I’ve added an alternative channel higher, shown below in white.  Its top and the red midline intersect at the .886 at 1653.38 on Tuesday morning, so I’m going to go with that scenario for now.

    It also provides a place for SPX to go if it pushes through the red channel bottom.  If it occurs around 3:05-3:10, it would make for a nice backtest of the falling purple channel .75 line around 1645, stopping out a few longs before the last push higher.

    UPDATE:  3:18 PM

    Dropping through the red channel bottom.  Selling the long position here at 1648.60, full short again.  But, watch for the white channel bottom at 1645.50 or 1646.19.

    The 60-min RSI shows an inflection point here — the .25 of the white channel and the midline of the yellow.

    Unfortunately, it doesn’t tell us whether those channel lines will hold.

    UPDATE:  3:48 PM

    Going into the final 15 minutes, and SPX just bounced back from beyond the bottom of the white channel.  Fakeout or are they going to close it positive on the day?

    I’ll go back to where we started today’s discussion: the dollar.  The white channel midline is still standing.  The USDJPY is also looking positive, and the EURUSD is looking weak.

    We might get a little spurt up to 1651 by the close, but I think we have at least 50 points of downside from here.  I’ll hold short over the weekend.


  • More?

    As vicious as yesterday’s reversal seemed, it was only a fraction of size of the three previous downturns.

    • -4.4% over six sessions in late December 2012
    • -3.1% over four sessions in February
    • -3.9% over five sessions in April 2013

    SPX should catch up with the futures this morning, reaching the purple midline around 1632-1633.  We should get a bounce there, but we’ll wait for a clear sign of a reversal first.

    The bounces on the way down were only about 5 points each.  Be careful about jumping on just any reversal.  Make sure there’s a compelling chart pattern or Fib level.

    I shorted yesterday at 1687, which was as nice a setup as you could ever hope for.  We tried shorting the day before at 1674 [see: If It’s Tuesday], which was the 2.618 Fib extension of the 1422-1266 decline from Mar-Jun 2012 — a big, beautiful Crab Pattern.

    But, Bernanke’s remarks sent SPX spiking higher and we were stopped out at 1475.  This opened up the other 2.618 extension we’d been watching: the one established by the 1474-1343 decline from Sep-Nov 2012 at 1686.73.  The chart looked like this:

    So, we had the other 2.618 right at the top of the red channel — where it intersected with yet another 2.618.  It was a high percentage opportunity that worked out very nicely — about 3% on the day, and probably 5%+ on the week.

    The only hard part is watching the news at the end of the day — the talking heads description of the reversal:  “all of a sudden, without warning, etc. etc…”   Not one of them discussed the red channel or the Crab Pattern!

    It also helped that DX tagged our downside target, and EURUSD tagged our upside target at the same time.


    UPDATE:  10:05 AM

    I’m going to assume that the channel midline has been restablished a little higher as a result of yesterday’s throwover and is more like 1635.  I’ll update that in a few…

    Taking a long position here at 1640 for what should be a decent bounce.

    UPDATE:  10:35 AM

    Not quite as much as I expected, but good enough.  I’ll close the interim long position and revert to full short.

    My only hesitation is the wave structure.  On the 1-min chart, looks like 5 up, 3 down…maybe need another 5 up for wave C?

    Might take another interim long at 1638-1639 if we get more support there.  I’d really been expecting a bounce more like 1557-1558 — the next higher purple channel line and a significant Fib level.

    UPDATE:  10:53 AM

    I’ll try another interim long here at 1643. But, would rather it be 1637.94.  Tight stops on this – 1641ish.

    BTW, I’m not going to tweet these intra-day bounces of 5-10 points.  It’s too distracting for me, and anyone playing them should be at their computer all day, not trying to trade while performing an appendectomy, landing a 787 or even teeing off at Cypress.

    UPDATE:  11:40 AM

    At this rate, SPX is aiming at 1653.16 as the extent of this bounce.  It’s a .886 retrace of the move down from 1655 (red pattern) and almost .382 of the drop from 1687.

    It would also set up a nice falling channel from the top.

    UPDATE:  12:12 PM

    Just tagged 1653.16 and then some.  I’ll close the interim long here at 1653.80 and revert to full short.  Stops at 1656 just in case it’s focused more on the purple channel .75 line or red channel back-test.

    The nice thing about chart patterns and harmonics is they give you discreet measures of correctness.  If we change sides because the market has arrived at a point where it should reverse, but it doesn‘t reverse, then we know we should be back on the other side.  In other words, the market usually tells us whether or not we’re on the right path.

    Since the little white channel hasn’t broken down, and it’s always dicey to assume a channel is correct so early on, we’ll watch for signs of this latest call being premature.  Like I said before, it’s not much of a retracement.  There are plenty of higher targets that are quite appealing for a bounce.

    The move won’t be confirmed without a drop through the channel bottom — currently around 1450.

    While we’re waiting to see, we’ll take a look at where SPX goes next.  First likely stop: 1637.63.  But, there’s a hitch that could spell 1663 instead.

    continued for members(more…)

  • Charts I’m Watching: May 22, 2013

    NOTE:  Most of you outside the US are now able to access the site, aside from a few in Europe and Asia.  So, the propagation should be nearly complete.   Apparently the links on previous posts need to also convert over from https to http. 

    There’s a process that will do this automatically for every one of the links in the past 700 posts, but I’m hesitant to try it until after the close today.  In the meantime, I’ll go through and update charts on various index pages, which should deal with the more immediate problem.  

    On a positive note, Disqus is working much better now with the elimination of SSL.  You can not only edit comments, but attaching charts is a snap.

    *   *   *   *

    Futures are pointed higher this morning, but there shouldn’t be too much action until Bernanke’s comments.  I won’t chase it without a break of 1675.

    The dollar has channeled higher since bottoming at 83.735 overnight.  I would still like to see a little further downside — to the bottom of the purple channel in order for the downside to trigger in equities.  The white .886 is at 83.678 and intersects the channel bottom around 7pm ET.

    Our target was 83.609, as that established a 1.618 extension at an intersection with the 1.618 of the decline from Apr 4.  Interesting that the dollar is trending up in advance of Bernanke’s testimony…

    …especially in light of the EURUSD’s push higher. The small falling channel in the pair would argue for a move slightly higher – perhaps to 1.2993 or so.

    continuing…

    UPDATE 10:00 AM

    There’s the push through 1675, so an interim long position is triggered here.  I’ll probably close it if/when DX hits 83.609.

    Charts in a moment

    DX is closing in on 83.609, but hasn’t quite tagged the channel.  Perhaps at around 83.57.  If that doesn’t hold, the white midline is around 83.52 and offers great support.

    EURUSD is closing in on 1.2993, though the 1.618 at 1.3011 is also a good possibility on an overshoot.

    I would imagine SPX is heading towards the 2.618 and red channel top at 1686.73.  But, keep an eye on the currencies.  The updated SPX chart:

    UPDATE:  10:20 AM

    DX just tagged the white channel midline at 83.52.  Should get a very nice bounce here.

    EURUSD just tagged the top of the purple channel, slightly overshooting our 1.2993 target to 1.2997.  Look for a strong reversal.

    And, SPX is back-testing the red .75 line, likely on its way higher.  I’ll likely close the long position at 1686.73 as long as the currencies are behaving and not breaking out/down.

    UPDATE:  10:28 AM

    Closing the long position here at 1687 and will revert to full short.  We have reached the top of the red channel and the 2.618 extension of the drop from 1474 to 1343 last fall.

    Note that SPX is well above the purple channel line.  So, we should see a sharp reversal.

    continued for members(more…)

  • If It’s Tuesday…

    Will this make 19?  It seems a little ridiculous to focus on the day of the week, when in fact the market has been up almost every day for the past six months.

    Since the Nov 2012 low, we’ve seen three corrections of any consequence on the eminis:

    • -4.4% over six sessions in late December 2012
    • -3.1% over four sessions in February
    • -3.9% over five sessions in April 2013

    If ES tags 1675 today, it will have gained exactly 25% in a little over 6 months.  Interestingly, the beginnings of those three downturns have lined up fairly well with a time Fib grid, seen below in red.  And, the lows have come at fairly regular intervals.

    If the pattern holds, we could be nearing the beginning of the fourth downturn, with a low to come around June 3-4.  Could it be more than a whopping 4%, or is that all that’s programmed in?

    *   *   *   *

    The dollar is back-testing its channel midline…


    While the EURUSD is pushing up against its channel midline…

    The futures point to a higher opening.  So, we’ll play along on the upside with an interim target of ES 1675.

    Note that this is the intersection of the 2.618 extensions from both the 1419 to 1262 decline from Mar – June 2012 and the 1468 to 1340 decline from Sep to Nov 2012.

    We’ve certainly seen more than a few Fib patterns bust lately.  But, these two offer the benefit of intersecting there with the top of a relatively significant channel – shown below in purple.


    UPDATE:  10:10 AM

    SPX just completed a Bat Pattern at the .886 of the small white pattern and is reacted fairly strongly.  Yesterday, SPX didn’t quite reach the 2.618 established by the Mar-Jun 2012 decline:  1672.84 v 1674.21. But, it might have been close enough.

    SPX also came very close, but didn’t quite tag, the IH&S target of 1673.50.  I’m leery of a fakeout, but we’ll see.  A drop through the previous low of 1663.52 would be a good sign.

    I’ll take a short position here at 1670 just in case, with stops right at 1670. Charts in a few…

    UPDATE:  10:35 AM

    Are we in for a 4% decline over the next 7-10 days?  And, if so, how might that play out?  Is there any chance of a bigger decline?

    SPX just pushed below the red channel midline.  So, this downturn is definitely in play. The bottom of the red channel is very close to the purple TL from 1994/2002 later today at 1650 — which would be a great start and a .886 retrace of the 1648-1672 rally (red pattern below.)  This is also the location of the purple channel .75 line.

    We should expect a bounce there, as the red channel dates back over 30 days in its own right.  A bounce back to the yellow TL or so (1665) would be quite normal, and would set up a Bat Pattern on both the purple and yellow grids.

    The purple midline, purple .786 and red 1.618 all intersect Thursday at 1633-1634.  Here, we would expect to see another bounce.   And, if this correction was to be smaller than the rest, this could be the end of it.

    If it bounces up to, say, the purple .75 line, it will have set up a Bat Pattern on the yellow grid and a Butterfly on the purple.  The purple 1.618 and yellow .886 intersect at 1591-1592 early Thursday morning, so this would be a more severe sell-off than the move in the paragraph above.

    Otherwise, we might look for the yellow .786 which intersects with the bottom of the purple channel around the 30th at 1600.87 — a 4.3%, 8 session decline from 1672.84.

    UPDATE:  11:40 AM

    Well, that was exciting.  Not.  SPX is back above the red midline, retracing .618 exactly of this morning’s decline.

    Interestingly, the dollar got whacked by this retracement.  Prior to this morning’s opening, I was expecting DX to sell off to 83.609 by tomorrow’s opening.  It would set up a 1.618 extension to 85.075 — same as the light blue 1.618 from the decline from 83.66 on Apr 4.

    It appears likely that this tag, if it occurs, would come at just after midnight tonight (EDT) — at the intersection with the bottom of the purple channel.

    UPDATE:  12:11 PM

    SPX is coming up on 1670, the .786 of the drop from this morning’s high.  As such, I’m hesitant to blow out the short position, and will give the stop a little more leeway — up to 1672.

    UPDATE:  1:06 PM

    Getting a push through 1672, so I’ll take an interim long position and see if we can get a proper tag at 1674.21 or 1686.73.  Note that 1674 is the 2.618 of the Apr – Jun 2012 drop from 1422 to 1266.

    1686.73 is the 2.618 of the 1474 – 1343 drop from Sep – Nov 2012.  Unlike the eminis, these two patterns for SPX do not coincide.


    UPDATE:  1:09 PM

    Didn’t take long.  Closing the long and full short again unless SPX can push through 1675.

    With that said, it’s becoming more and more difficult to see the downside scenario. The bounce off 1662.67 came right at the yellow TL from 1994-2002, which I have though was an important line in the sand. A day or two push above wouldn’t necessarily guarantee a continued rally, but the longer we spend up here, the more established the trend becomes.

    UPDATE:  3:45 PM

    I have no idea what might transpire tomorrow that might be negative for the market.  Well, I do…but, I can’t imagine it actually happening…

    If the market reacts negatively to whatever Bernanke has to say, here’s my best guess as to the next few months. Here’s the close up through the end of June:

    And, the bigger picture:

    I have a lot of fine tuning to do, but I’ll wait until the direction is clear.  If the market likes what it hears, of course, we could shoot up another 10% without the drop to 1600 in early June, bounce to 1666, then drop 1576 in September.

    I have to get on the road for a meeting and won’t get back until very late.  So, I’ll catch up with everyone in the morning.  I’ll hold short into the close, with stops still around 1675.

    GLTA.


  • Charts I’m Watching: May 20, 2013

    NOTE:  If you found your way to this page, you know that the correct page is now https://pebblewriter.com rather than https://pebblewriter.  The “s” was dropped is the course of the transfer from GoDaddy to Hostgator because it’s been many moons since memberships were paid for directly through this website.  Now, new and renewing members go directly to PayPal’s website, and they have their own SSL security (and more.) 

    I found that the SSL capability didn’t play well with Disqus and a number of other features that we all like.  More on that later.  In the meantime, some of the links within posts and on menus might still point to an “https” page — landing you on an error message instead of the content you sought.  These are being converted over, but if this should happen to you simply go up to the address bar and remove the “s” from the page you’re on and refresh.

    I have already been impressed with Hostgator’s speedy and superior customer service.  I think once a few bugs are ironed out, the site will run much faster and reliably.

    *   *   *   *

    Nothing much has changed since Friday’s close.  There’s a slight negative bias, which could be nothing more than consolidation after Friday’s rally.  We’ll play along on the downside, with the understanding that 1673 is still on the table either intra-day with a reversal, or on the way higher. In other words… tight stops.

    Price has been on a tear, but the underpinnings of the rally have been fading the past several days — as seen on the 60-min RSI chart.

    We went to cash at the close Friday because of the disagreement between short-term and long-term patterns such as are displayed in the currencies.  The euro and dollar have hit short-term targets, but have more room to go before the tide turns.

    UPDATE:  10:10 AM

    SPX just pushed above 1667.  I’m going to switch to the long side with stops at 1667 in the expectation that it’s headed to 1673.

    Note that we’re currently above the yellow TL connecting the 1994 and 2002 lows, and at 1667.50 have pushed above the top of the purple channel itself.

    As I mentioned earlier, this might be nothing more than an intra-day move. But, we can’t ignore the possibility of a breakout here.  It’s visible on both the short-term and longer-term RSI charts — the action immediately ahead of us will determine which it is.


    The most logical move, given the degree to which we’re overbought, would be a reversal off the channel tops.  But, we’ll see…

    UPDATE:  12:47 PM

    SPX got within .16 of our 1673 target and is rolling over.  Watch for the latest even-more-steeply sloped channel (white) to catch it around 1669-1670.  A drop back through the top of the purple channel would argue for 1663 (yellow dashed TL) for starters, maybe lower.

    I’ll likely take a crack at an interim short position with any push through 1669.60.

    UPDATE:  12:56 PM

    Here we go… interim short here at 1669.60.


    I jumped the gun on that one.  Stopped out with a bounce at the top of the purple channel.  Should have been more like 1669.  Too bad, because the dollar’s confirming a drop here — as is SPX RSI.

    I’ll probably just wait for a push through 1669 instead.

    To give you an idea of how silly this has become, the little white channel slopes up through the red channel which slopes up through (and has, for the moment at least, departed) the purple channel.

    This is, by definition, exponential: increasing at an increasing rate.

    UPDATE:  1:19 PM

    Just got the break.  Full short here at 1669.  Charts in a few…

    For the bears, a move back through 1663 is necessary to generate any real downside potential.  Otherwise, this could be viewed as a backtest of the yellow TL.

    As always, watch for the back test of the broken channel/TL — in this case, stops around 1670.50 should be safe.


    UPDATE:  2:40 PM

    Got very close to the yellow TL and bounced.  It’s not clear yet whether that was the extent of it.  But, I’d expect SPX to at least tag the red channel midline — currently at 1663.75.

    UPDATE:  3:55 PM

    Holding short into the close.  The dollar and euro appear very ready to reverse, and SPX is still back below the purple channel top, meaning a reversion to the midline is the most likely scenario.


    more later…

  • Was That It?

    If you just received a text telling you about this new post…it’s not.  It’s from May 17 but was “lost” in the move from GoDaddy to Hostgator.  I managed to retrieve it and am reposting it for posterity sake.

    *  *  *

    With the futures pointing north this morning, we’re left to wonder whether that massive sell-off yesterday (-0.5%) was all we can expect.

    As usual, we’ll play along on the opening.  We’ll go long, but watch for any sudden reversals.

    Why? For starters, the EURUSD continues to crumble.  Here’s the big picture:

    But, the 60-min chart shows an 88.6% retracement of the latest move up — a natural place for a for a reversal. If it doesn’t however, and breaches 1.2744, that pretty much kills off the purple pattern, which is the best hope for an end to EURUSD’s slide.

    And, a tag of the yellow .618 — the most natural place for a reversal and potentially a stronger attraction for the pair than the smaller scale .886 — would kill off the yellow pattern (Point C cannot be lower than Point A.)

    DX is likewise coming up to an important target at the 1.618 extension (Crab Pattern) we’ve been forecasting.

    But, while the yellow pattern signals a reversal, the larger light blue pattern is still not done. Its 1.618 Fib is up at 85.075.

    And, the even larger purple pattern still argues for at least the 1.272 at 85.746 — along with that big channel line up there. Bottom line, DX has thrust up through two channel midlines in the past few days. This is the kind of momentum that’s every bit as powerful as the equities markets. And, it’s hard to say whether the smaller pattern completions can reverse it.

    UPDATE: 9:40 AM

    SPX just hit the neckline of yesterday’s little H&S pattern and almost reached the .886 of yesterday’s push down. I’m going to try switching back to the short side here at 1658 with tight stops.

    We’ll keep a very close eye on those currencies.

    UPDATE:  9:57 AM

    Consumer sentiment just came in at 83.7 vs expected 78 and SPX has leaked up a little higher.  Leading indicators come out in a few…  Key level for shorts is 1660.28 — the .886 of the move down from 1661.49.

    UPDATE:  10:02 AM

    LEI came in at 0.2 vs expectations of 0.3% and the prior reading of -0.1%.  SPX nudged just past the .886, but still hasn’t bested it — so far, just a deep retracement.  I’ll probably switch sides on any move through the previous high of 1661.49.  Otherwise, I’m holding short for now.

    I still like the odds of the currencies punching through resistance/support as discussed above.  Look at the 60-min RSI for DX — a nice clean break through the midline.

    I could be wrong, but we seem to have crossed over into “good news is bad news” land — where suspicions of a strengthening economy stoke fears of the Fed withdrawing the QE IV.

    And, this market needs a correction, as even the die hard bulls would admit.  Do you allow a little reset and allay the overbought condition, or keep it going strong in hopes of sucking the retail investor back in?

    I imagine that very question is bouncing around Washington/Wall Street right now.    My gut feeling is that this spurt this morning was designed to shake out the weak bears and trap a few unsuspecting bulls — using the consumer sentiment results as bait.  We’ll know the answer soon enough, after TPTB position themselves accordingly of course.

    Watch your stops, because my gut doesn’t matter nearly as much as whether SPX leaks past 1661.49.

    UPDATE:  10:25 AM

    SPX just topped yesterday’s high (which I’m sure bugs the EW guys) but still not Wednesday’s 1661.49.  Remember, that high tagged the TL from 1994-2002 — one of the last natural bastions of LT resistance around.

    Meanwhile, the USDJPY just reached an important channel line, but faces a quandary similar to the other pairs. The small scale 2.24 is nearby and might make a suitable target if currencies go sideways for a few days.

    But, the 2.618 and — more importantly — the large scale .618 are also close by. I suspect the pair will seek out 105.57 — where it intersects the purple channel upper bound on Wednesday the 22nd. More on this in a little while.

    UPDATE: 11:00 AM

    Getting a little action on the downside finally.


    The 15-min RSI is looking nice and bearish…

    But, the 60-min RSI chart shows that SPX has climbed back into the broken channel and might take a shot at remaining.

    If so, watch out for a potential IH&S Pattern to set up. More charts in a few.

    UPDATE:  11:15 AM

    Here’s the scenario we need to keep in mind. The target from a completion later today would be right at 1673.50 — the 2.24 of the 1597 to 1536 decline that began on April 11.

    BTW, the larger IH&S, with the dip to 1650 on the 15th as the left shoulder, would complete at a lower price.  But, the target would actually be a point of two lower since the neckline is a little flatter.

    As Matt Bear points out below, today is a massive POMO day with $5.75BB being delivered to Wall Street as we speak.

    It’s also OPEX, which is almost always a lot of fun for anyone betting on a sell-off.  But, corrections that are pumped and primed very often get going on the Monday following OPEX.   Something to think about…

    UPDATE: 12:20 PM

    I just figured out the way the MM could screw over the greatest number of investors — which means, I think I know how the market’s going to play out today.  Doesn’t mean it has to, but remember we have heuristics for these things.

    Most people would agree with Occam’s Razor:

    The simplest explanation is usually the right one.

    And, Hanlon’s Razor is a favorite of mine:

    Never attribute to malice that which can be adequately explained by stupidity.

    But, where market makers are concerned, I swear by Pebblewriter’s Razor:

    Never attribute to random chance that which can be easily explained by market makers’ malice.

    continued for members(more…)

  • What Recovery?

    [NOTE:  This is not a new post, but the 2nd of the two recovered posts from the transition from GD to HG in May.  A portion of it is still missing…]

    Housing starts missed big time, sliding 16.5% in April. Single-family was down 2.1% and apartments were down a whopping 37.8%. CPI also missed, with both total and core coming in at half the expected rate. But, the big news was initial claims, which jumped back up to 360K versus expectations of 330K and last months 328K (revised up from 323K.)

    In a non-QE environment, this news would be good for -15 points on SPX, easy. But, it gives the Fed cover to continue pumping cash into the economy banks’ balance sheets, so SPX is off an astonishing 2 points.

    The EURUSD rallied overnight, breaking out of the falling wedge but quite possibly morphing into a channel (purple.) The immediate downside still looks to me like the red .886 at 1.28 (though the smaller patterns suggest 1.2770-1.2775.)

    At this rate, it’s probably not a bad idea to talk about what happens if 1.2743 falls. That little channel, if it can keep it together, points towards the red 1.618 where it aligns with the yellow .786 at 1.2398. That’s a full .05 below current prices for the pair.

    The red .886 could produce a back-test of some sort, but a drop below 1.2744 (the purple A) would officially kill off the purple harmonic pattern potential (Point C must be higher than A.)

    If that should happen — which it appears to be the case — then the yellow pattern takes control. While the .786 looks like a tasty target, the fact that Point B came in a little less than the .618 means a Bat Pattern down to the .886 (1.2231) is more likely.

    I’ll give DX a matching purple acceleration channel that points to 84.527 (the yellow 1.618)…

    …and we’ll see if SPX can’t manage to top out at 1660 (small white .886) before turning back down this morning.

    UPDATE: 10:20AM

    SPX did, in fact, put in a nice reversal at the .886 as DX was bottoming and EURUSD was topping. But, it hasn’t yet punched through the rising white channel bottom.

    Until it takes out 1650.88, this pattern could serve as the start of a Crab Pattern that completes at the 1.618 (1668.05.) So, we’ll keep an eye on that, and place stops for our short position around 1661.50 just in case.

    On a positive note, it appears the candles printed this morning are more or less parallel to the little red channel from yesterday — meaning we might actually have a falling channel on SPX.

    And, while I’m jinxing the last remaining bearish scenario, let me extend my heartfelt thanks to those bears who formally and publicly capitulated yesterday on these pages. It was your sacrifice that made this 10 point downturn possible. We shall forever be in your debt.

    Please be assured that we will always welcome you back with open arms — even if it spells financial ruin for the rest of us.

    UPDATE: 10:35

    Here’s a quick big picture look at the dollar — which also has bigger fish to fry in the event it can reach our intermediate objective. Recall that it completed that nice little Bat Pattern at the purple D-1. But, the real prize would be if the pattern extends to D-2 (purple 1.618), which just happens to line up with the white .886.

    DX topped out at 84.22 yesterday. A push beyond 84.245 (purple X) officially kills off some important downside harmonic targets and greatly increases the odds of a push to 87.076.

    I’ve been talking about DX 87 for a long, long time. It’s still out there, my great white whale. There have been many crash set-ups that might have propelled the dollar that high.

    There’s another one setting up right now, that should get under way within the next hour. Anyone interested in playing the downside should prepare themselves right now.

    We’ll take a quick look around at other indices to see if they’re in a similar position.

    continued for members(more…)