Posts

  • Charts I’m Watching: Jan 6, 2015

    USDJPY reached the bottom of the white channel — and then some — slightly overshooting our 119 target.

    2015-01-06-USDJPY daily 0615We identified 119.07 as the line in the sand, and it’s hovering right there this morning.  Meanwhile, SPX reached our 2018.78 target.  From yesterday morning’s post [members’ section]:

    As such, I’m looking for an initial bounce at the red .618 at 2038 (also just below the SMA50), followed by a dip to the white TL mentioned above (2018.78 if it happens today or tomorrow, otherwise 2030.)

    We called for a bounce there, and the rebound I’m expecting in USDJPY should accommodate one.  Keep an eye on 118.59 — the purple .886.

    On the oil front, CL reached our 49.52 target overnight. 2015-01-06-CL daily 0700And, TNX is nearing its ideal bounce point — the red .886 at 19.27 (though 19.79 would also work.)

    2015-01-06-TNX 60 0640But, currencies should rule the day.   EURUSD is still hovering above the Jun 2010 lows.  And, DX remains above our 90.272 target in what looks like a channel break out.

    Stay tuned.

    UPDATE:  11:00 AM

    That nice 13-pt bounce was just undone by lower rates, oil’s continued weakness and USDJPY’s drop through 118.59.  Note that PMI, ISM and factory orders all disappointed.

    2015-01-06-SPX 60 0800It’s possible the purple .382 will hold, but it will require a reversal by TNX and USDJPY.  The stronger support is at the SMA100 at 2003.77.

    2015-01-06-SPX daily 0800

    UPDATE:  11:50 AM

    TNX just reached our 19.27 target…

    2015-01-06-TNX 60 0847…at about the same time as SPX reached the SMA100 identified in the above update…

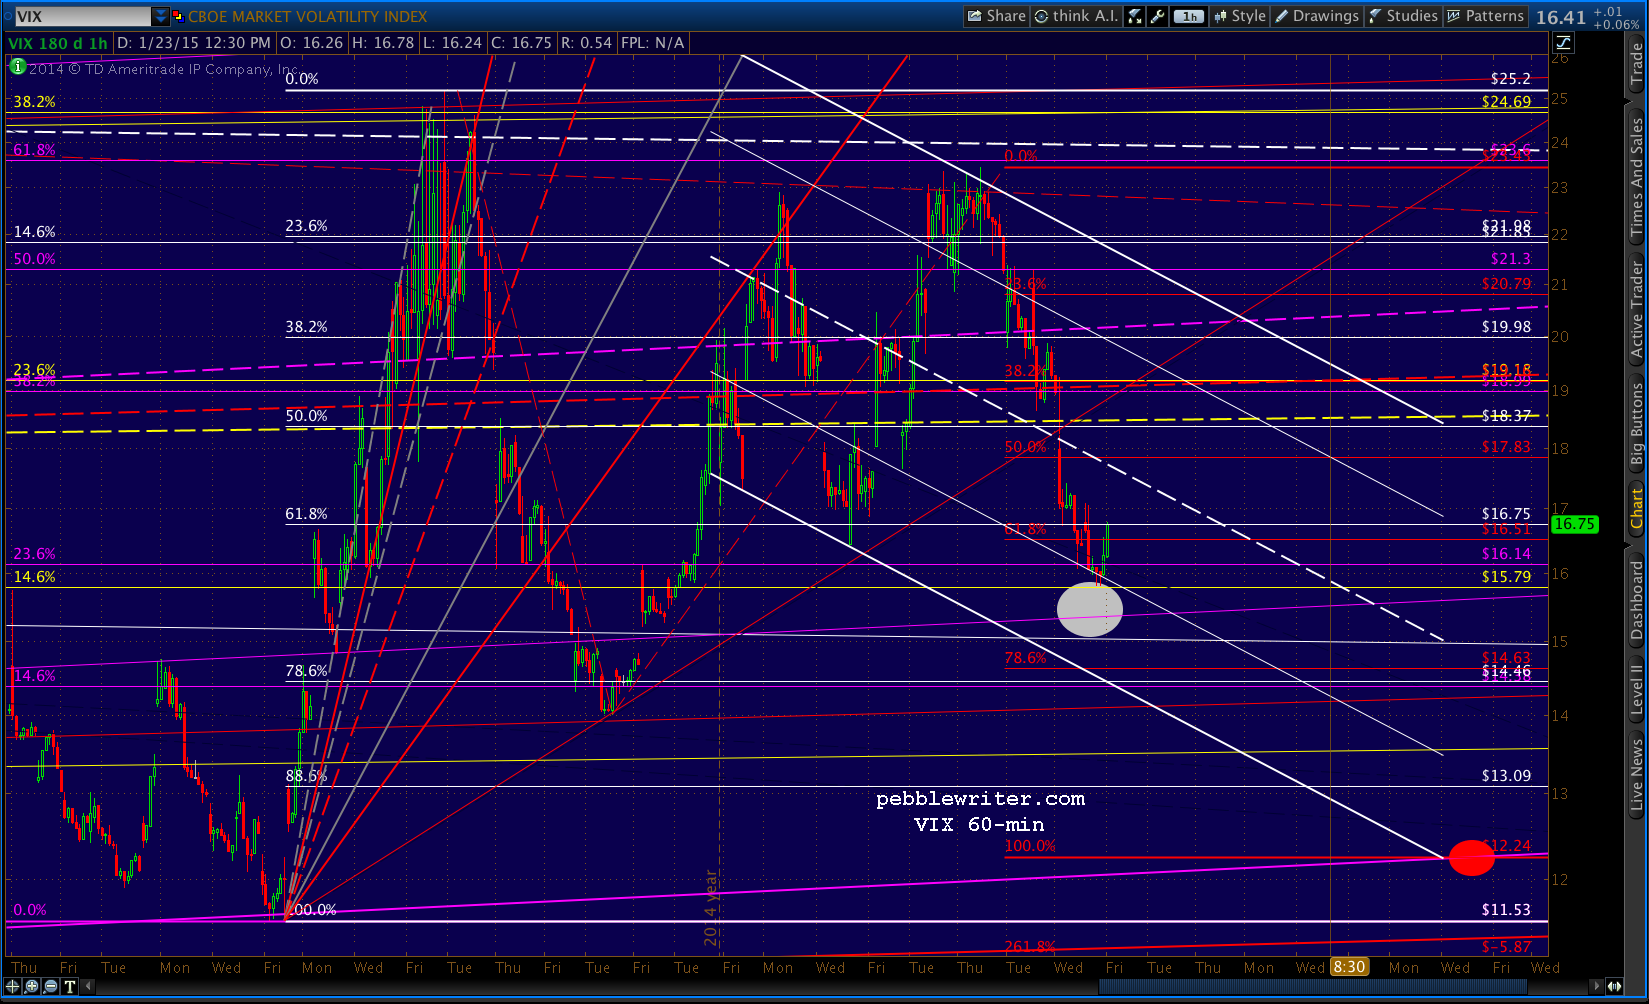
    2015-01-06-SPX daily 0847…and, VIX is nearing the purple channel midline.

    2015-01-06-VIX 60 0848The problem child is USDJPY, which has dropped below the purple .886 yet again.  It’s tough to tell when this highly-manipulated currency pair is producing a head fake or is legitimately in trouble.  Need we remind readers that the pair is now well below the key .618 at 120.11?  The next support is the red .500 at 118.18.

    2015-01-06-USDJPY 60 0848The bulls should be expected to try and hold SPX 2000, but it would require that all the above reverse muy pronto.  According to Bill Gross, who draws a slightly higher readership than yours truly, we shouldn’t hold our breath.  In his just-released annual outlook, he tells investors “the good times are over.”

    I certainly have no qualms with his macroeconomic and market fundamentals reasoning.  I’ve thought the same for quite some time.  But, IMHO, the “good times” can be extended for as long as central bankers are willing to continue shoveling moolah into the banking system (as opposed to “the economy”) and the BoJ is willing to continue trashing the yen.

    The rest is shoulda-coulda-woulda.

    continued for members(more…)

  • Charts I’m Watching: Jan 5, 2014

    The downturn we called for last week has exceeded our expectations — the most bullish target proposed on Dec 31.  Why?

    2015-01-05-SPX 0600Stocks can handle the troublesome economic news and sketchy geopolitical developments out of the euro zone.  They can even handle lower crude prices.  But a USDJPY that’s — again! — back below the key .618 we’ve been watching?  No way.

    2015-01-05-USDJPY v ES 60 0600The futures are currently down almost 10 points, which points to a retest of Friday’s lows at the very least.  Beyond that, we have to wonder whether USDJPY will remain in its rising channel.  The line in the sand looks like 119.07.

    TNX continues settling toward our Dec 31 target.

    2015-01-05-TNX daily 0640And, crude light is closing in on its next target.

    2015-01-05-CL daily 0646

    continued for members

    A failure to snap back above 120.11 at this point would be troubling to the bulls case, and most likely result in a dip to support at 2038 or 2019.  The channel picture is a mess at present, so we’ll stick with Fibs, daily moving averages and the white TL off the Dec 16 lows.

    As such, I’m looking for an initial bounce at the red .618 at 2038 (also just below the SMA50), followed by a dip to the white TL mentioned above (2018.78 if it happens today or tomorrow, otherwise 2030.)

    The dollar is showing plenty of strength, shooting up past the .382 (adjusted for contract change.)

    2015-01-05-DX daily 0700It’s all on the back of the euro’s weakness — which does nothing for the yen carry trade crowd.  The EURUSD briefly dipped below its Jun 2010 lows this morning.

    2015-01-05-EURUSD daily 0646UPDATE:  1:30 PM

    SPX just tagged 2019.28, very close to our 2018.78 target.  We should get a nice bounce here.

    2015-01-05-SPX 60 1037 2015-01-05-SPX daily 1030CL hasn’t quite reached the .786.  A bounce in CL would support a more significant rebound in stocks.  A little more downside to 49.52 would help SPX with a more precise tag of the .618 at 2018.78.

    2015-01-05-CL 60 1042

  • Charts I’m Watching: Dec 31, 2014

    USDJPY continues to bump along the .236 white channel line — working its way back toward the .618 at 120.11.

    2014-12-31 USDJPY 60 0620

    The fact that it didn’t snap back has to be viewed as a bearish development.  Though in the light volume and holiday-shortened sessions ahead I wouldn’t try to take that to the bank.  After all, the one constant from this past year has been the ability of TPTB to turn “markets” on a dime.

    Follow-through on the downside has been awfully hard to come by.  Having said that, there’s still a decent case to be made for lower stock prices based on chart patterns.

    continued for members

    The 10-yr looks like it could be headed back below 2%.

    2014-12-31 TNX daily 0715VIX looks likely to tag the 16.75 mark before the 13.09.

    2014-12-31 VIX daily 0715Oil probably has a little further to fall, with CL 49.52 our next target.

    2014-12-31 CL daily 0715And, DX is long overdue for a tumble after tagging the yellow .382 over a week ago.

    2014-12-31 DX daily 0715At this point, it’s hard to say what sort of reversal, if any, SPX might see from the above.  The most bullish would be to backtest the white 1.272 at 2073.28.  The SMA10 is currently at 2073.19, so that looks like a fairly safe bet.

    2014-12-31 SPX daily 0823If it works its way lower, the broken, red TL connecting the previous tops is now crossing the purple .886 at 2067.28.  A backtest there would make sense, as the previous attempt to backtest it failed (resulting in a 107-pt loss that was quickly erased.)

    The diagonal channel lines running through the above chart are pure guesstimates.  The red one looks fairly legit, but it only goes back to mid-2013.  The purple one attempt to connect the 2009 and 2010 lows, and I’ve had a tough time making sense of it on either an arithmetic or log scale.

    As for the (more likely) upside target, it remains 2138-2145.  The timing has been greatly complicated by the sideways action of the past week.  But, an intermediate reversal at 2108.55 (purple 1.272) would delay a tag until mid-Jan or later, possibly as late as mid-Feb.  We’ll first need to see how much of a decline comes in the week ahead.

    Note: I’m working on a bigger picture forecast for the months and year ahead, and hope to get it posted in the next few days.

    GLTA.


  • Charts I’m Watching: Dec 30, 2014

    USDJPY dropped over 1.25% overnight, so the e-minis (thin purple line) followed right along — to a point.  Note the floor under ES that corresponded with USDJPY reaching the purple .618 and white channel line on the 60-min chart below.

    2014-12-30-USDJPY v ES 60 0600The daily chart for the past year better shows the steepness of the white channel, as well as USDJPY’s overall impact on stocks.

    2014-12-30-USDJPY v ES daily 0600As we’ve pointed out for the past several weeks, the white .618 is a major Fib retracement.  Any meaningful drop below it — such as we’re seeing right now — represents a real threat to the carry trade which has fueled virtually all of SPX’s gains since late 2011.

    The floor (yellow arrow) established under USDJPY for most of 2014 provided regular boosts to ES/SPX.  And, when USDJPY finally broke out of that triangle in July, SPX soared to new highs.

    The mid-October stick save in SPX (thank you Jim Bullard) was facilitated by USDJPY’s  backtest of the January highs (and, an important Fib.)

    And, stocks’ subsequent breakout to new highs was made possible by USDJPY’s massive Oct 31 move (thank you Kuroda and Abe.)

    Looking at the weekly chart below, it’s pretty easy to see where the BOJ’s massive easing began.  Remember the meltdown of July-Aug 2011?

    I wasn’t really watching USDJPY back then, as it was generally in freefall even before Fukushima (the purple arrow.)  But, that floor established by the BOJ at 75 was the very start of the yen’s decimation and an extremely successful campaign to boost stock prices.

    2014-12-30-USDJPY v ES weekly 0630 LTAs one of the only analysts to accurately forecast that 23.8% correction, it never occurred to me that the failure of SPX to reach my 1040 target (SPX fell from 1370 to 1074) was greatly influenced by the Oct 31, 2011 spike in USDJPY — the largest since 2008 and one of only two that exceeded the Oct 31, 2014 spike. Hmm…


  • Charts I’m Watching: Dec 29, 2014

    We’ve been wondering for the past month or so whether SPX would take a shot at pushing through the upcoming major resistance at 2138-2145 prior to year end, or hang back in a “safe zone” until after 2014 was in the bank.

    2014-11-25-SPX daily 0600The key determinants have been a select few instruments and currencies: VIX, DX, USDJPY, EURUSD and 10-yr notes.  In years past, these were secondary indicators — reflections of the activities in global equity markets.  Now, thanks to the dominance of the carry trade and algorithmic trading, they are the tails that are wagging the stock market’s dog.

    As the US dollar has soared relative to the yen and euro, VIX has been beaten into submission, and 10-yr note yields have continued to slump, the carry trade has had the wind at its back.  Stocks have had no trouble ignoring unimpressive earnings, macroeconomic and geopolitical news, and normally reliable chart and harmonic patterns.

    So, we’ve focused instead on the prognosis for these determinants in the hopes they might provide a road map for broader market indices.  Back on Dec 3, we set five year-end targets suggested by the charts, most of which have been reached: EURUSD, USDJPY, DX [see: Update on Currencies.]

    Screen Shot 2014-12-29 at 6.54.04 AMIn chart and harmonic terms, reaching a target usually suggests a reversal.  Yet, EURUSD has dropped through strong support at our initial target of 1.2263.

    2014-12-29-EURUSD daily 0630And, DX and USDJPY are being propped up at our year-end targets (and, important levels of resistance —  DX at 90.272…

    2014-12-29-DX 60 0640…and, USDJPY at 120.11.

    2014-12-29-USDJPY 60 0640A reversal would most certainly mean an end to the current rally.  Therefore, the fact that they are being held at current levels suggests a continued holding pattern for stocks — at least through the end of the year.

    VIX has likely topped out for now, with a backtest of the white channel midline suggesting the next leg will be lower.  As one of the last remaining levers at the Fed’s disposal, look for it to continue sliding — even though the purple .886 has already been tagged twice (though 16.75 would have been more convincing.)

    A drop to 13.09 looks like a foregone conclusion, and a push below 11.53 would easily push SPX above 2100.

    2014-12-29-VIX daily 0800TNX, as we’ve previously noted, reversed at a short-term TL connecting the past month’s tops.  There’s a pretty good argument for completing an A=C move up to 25.70ish. Though a slide to the pale blue .886 at 19.28 looks just as likely.2014-12-29-TNX daily 0840Herein lies the chartist’s dilemma — which indicator determinant to believe.

    continued for members(more…)

  • Charts I’m Watching: Dec 26, 2014

    Wednesday’s last minute sell-off fulfilled our expectation of a small sell-off, though it only got as close as 2081 before the close.

    My expectation is that we’ll get a small sell-off somewhere along the way — perhaps as early as at the close today — just to shake out the weak bulls and set the stage for the last leg.  An obvious target would be to close yesterday’s gap at 2078.73.

    Last night’s ramp job in futures got SPX right back into the channel at the opening bell.

    2014-12-26 SPX 15 0640The latest bullish central bank influence came not from the ECB, nor the BOJ — but the PBOC, which adjusted financial institution deposit ratios in a fashion that should stimulate more lending.

    As expected, USDJPY is holding at above the white .618 — this as more abysmal economic news from Japan hits the wires.

    2014-12-26 USDJPY 60 0625 Zerohedge summarizes it nicely HERE, but the the latest Abenomics accomplishments include:

    • a 0.6% decline in industrial output in November (consensus growth)
    • November consumer inflation slipped thanks to falling oil prices
    • real consumer spending dropped for the eighth straight month
    • real disposable consumer spending reported at -.2.5% YOY
    • real disposable income slid -3.9% YOY (wages -4.3%) biggest drop since 1988

    Recall that DX reached our year-end target at the opening bell on Wednesday: the yellow .382 of the decline from 121 to 71 beginning in 2001.  The reversal contributed to Wednesday’s late-session decline.

    Since then, it has rebounded to the .886 of Wednesday’s high (tiny white grid) — meaning SPX might not get much more help from DX.

    2014-12-26 DX 60 0625

    A close-up (updated 10:30):

    2014-12-26 DX 15 0725

    The other factor in Wednesday’s downturn was TNX, which reached a TL we were watching.  Breaking through that TL could pick up the slack from DX, and reaching for DX’s upside targets would help boost SPX to our year-end target.

    2014-12-26 TNX 60 0625VIX continues to do its part, slowly and steadily approaching our initial downside target.

    2014-12-26 VIX daily 0700Bottom line, while DX and TNX are at least temporarily be of little help to higher SPX prices, USDJPY, EUR and VIX are still very much available.


  • Merry Christmas!

    Wishing all our friends a very merry Christmas.  Whatever your faith tradition, may the true meaning of the holiday fill your homes with peace, joy and hope.

    “Adoration of the Shepherds” by Gerard van Honthorst, 1622


  • Charts I’m Watching: Dec 24, 2014

    Things continue to go pretty much as planned, though there are a few currency-related bumps in the road just ahead.

    DX, having reached our year-end target yesterday, is reversing.  Whether it will amount to something meaningful or is just a head fake remains to be seen.

    2014-12-24 DX 60 0605USDJPY has clearly lost a little momentum in the short-run, giving up the purple channel and stalling at the white channel midline (remember, USDJPY has frequently ignored the rules of channels and chart patterns lately.)

    2014-12-24 USDJPY 60 0605Even EURUSD is on the rise, after pushing below our year-end target.

    2014-12-24 EURUSD 60 0605On the bullish front, VIX continues to slide…

    2014-12-24 VIX 60 0605…and 10-yr yields continue to rally.

    2014-12-24 TNX 60 0605The net effect is a rising channel for SPX that, as we’ve pointed out before, looks more and more like the mid-October melt up.  Prices could continue to rise even as momentum fizzles and the initial channel’s relevance fades.

    2014-12-24 SPX 60 0605For now, we’ll consider the purple channel legit, and watch to see if prices can remain in this uptrend for the holiday-shortened session (1pm EST.)

    2014-12-24 SPX 15 wo 0605My expectation is that we’ll get a small sell-off somewhere along the way — perhaps as early as at the close today — just to shake out the weak bulls and set the stage for the last leg.  An obvious initial target would be to close yesterday’s gap at 2078.73.

  • Three Down, Two to Go

    The third of our Dec 3 year-end targets [see: Update on Currencies] has been reached.

    USDJPY: 120.05
    EURUSD: 1.22635
    DX:  90.272

    DX just tagged our 90.272 target a little ahead of schedule.

    2014-12-23 DX daily 0605Recall that this represents the 38.2% retracement of the Big Drop from 121 in 2001 to 71 in 2008.

    2014-12-23 DX wkly 0620The spike in DX means our forecast for a rally through the major .618 for USDJPY is also playing out.

    2014-12-23 USDJPY 60 0620We’ll have new highs today, of course, but should see a reaction from DX.  We’ll take a look at how our VIX, TXN and SPX targets are coming along after the bell.

    continued for members(more…)

  • Charts I’m Watching: Dec 22, 2014

    Today’s action should be about new highs.  We’ve had USDJPY ramping, and now face the .618 at the white channel midline which remains the line in the sand…

    2014-12-22-USDJPY 60 0615…and, SPX testing its former ATH…

    2014-12-22-SPX 60 0615…all in an effort to leave the 1.272 in the dust.

    2014-12-22-SPX daily 0615One of the major constituents in ramping SPX ever higher is, of course, VIX.  Not too long ago, VIX was a measure of what stocks had done — a reflection of the volatility being exhibited in the market.

    As we’ve discussed many times, it is now a determinant of stock prices — one of the tails wagging SPX’s dog. It’s one of several tools at the Fed’s disposal to ramp stock prices higher.

    As such, it was a bit of a head scratcher when VIX slid below the purple .886 and purple channel line in late November and again in early December.  The subsequent rally above 25 in the middle of the month, however, suddenly made sense of the earlier drops: a falling channel, shown below in white.

    2014-12-22-VIX daily 0650Today, VIX is dropping below the midline of that channel, and should continue falling — at least until our upside targets are reached.

    continued for members… (more…)