Posts

  • Charts I’m Watching: Dec 10, 2014

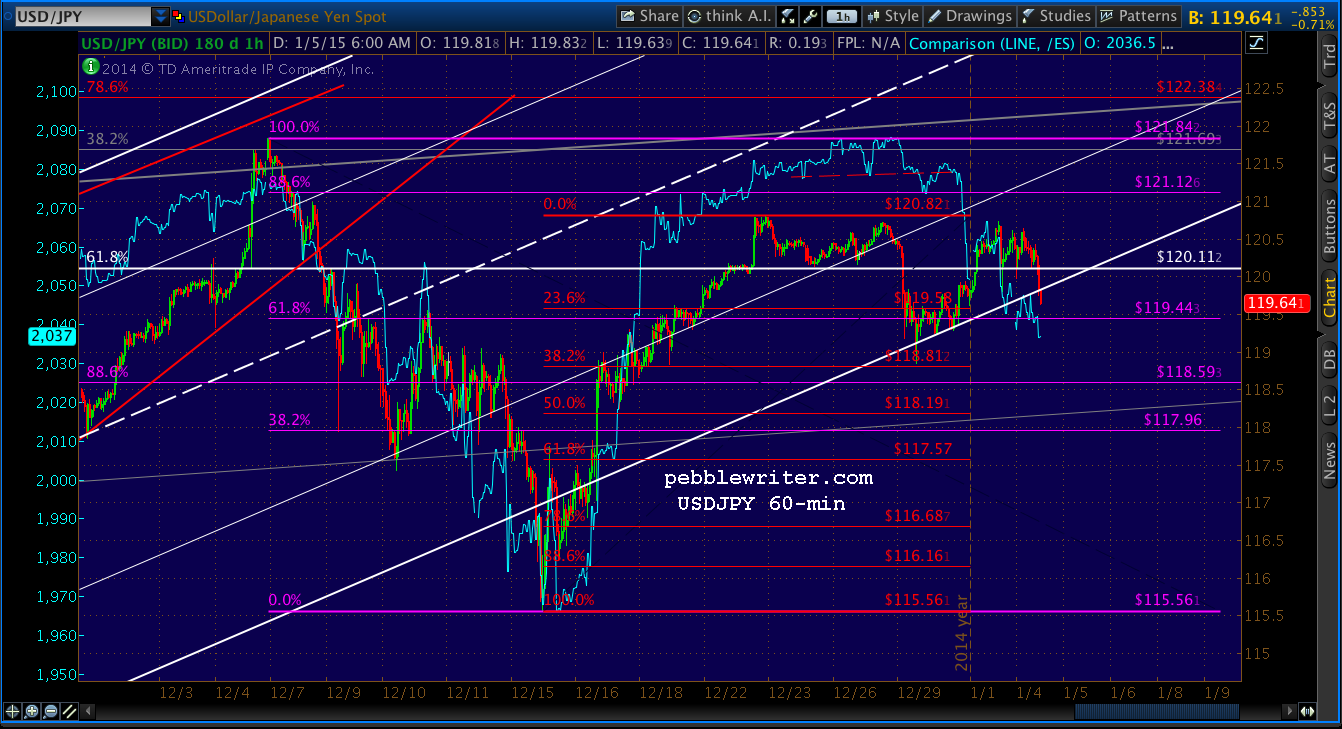
    USDJPY, after reacquiring the purple TL and thus providing the stick save SPX needed yesterday afternoon, stumbled again overnight.

    2014-12-09-USDJPY 60 0608It just goes to show how essential a falling yen (rising USDJPY) is to higher stock prices.  Futures were off as much as 6.25 a few hours ago, but are — for now — safely above their version of the rising red TL.

    2014-12-09-ES 60 0620Unlike SPX, yesterday’s bounce came close enough to call it a tag on the .618.  So, we can legitimately call the overnight weakness a corrective wave.  The only hitch now is whether or not USDJPY will play along.

    2014-12-09-ES 60 0622continued for members(more…)

  • Mission Accomplished

    From this morning’s initial post:

    USDJPY has reached a TL of support (purple, below) so we’ll watch to see if it gets a reversal here that allows SPX to bottom out at 2041 (the 1.272).  If not, SPX’s next support isn’t until 2031 (1.618) and then the previous high way down at 2019.  Key support levels for USDJPY are the SMA10 at 119.239 and the purple .886 at 118.59.

    2014-12-09-USDJPY 60 1300USDJPY rebounded just past the .886 at 117.95, prompting SPX to level off just shy of the 1.618 at 2034 (hey, if rigging markets were easy, everybody would do it!)  From here, the next steps were somewhat predictable.

    The first challenge is to get back above the red TL and regain the rising channel.  It should be the next move after SPX bottoms out this morning, and will probably present itself as a backtest initially.  This would normally be a negative development — setting up further losses.  But, a push back above the red TL is more likely — either later today or tomorrow.

    SPX gained 23 points to backtest the red TL, whereupon it fell six points before taking another shot.  It pushed above the red TL late this afternoon for a 26-point pop off this morning’s lows.

    2014-12-09-SPX 60 1300After being down by 26 points earlier, SPX closed off 0.49 on the day.  After such an impressive recovery, why not another half point to close green?

    Simple.  By closing below the .618 at 2062, it leaves open a significant upside target to rationalize the next leg higher.  Had SPX tagged the .618 during the day, sellers might have shown up to push prices back below the red TL.

    2014-12-09-SPX 60 1300 CUJust as importantly, by reaching 2060.60, SPX closed the huge gap that would have otherwise been left in the wake of this morning’s sell-off.  Instead, traders are left wondering whether the recovery was merely a rebound/gap fill or the start of another leg higher.

    For the Masters of the Universe and their un-rigged market: Mission Accomplished.


  • Update on Oil: Dec 9, 2014

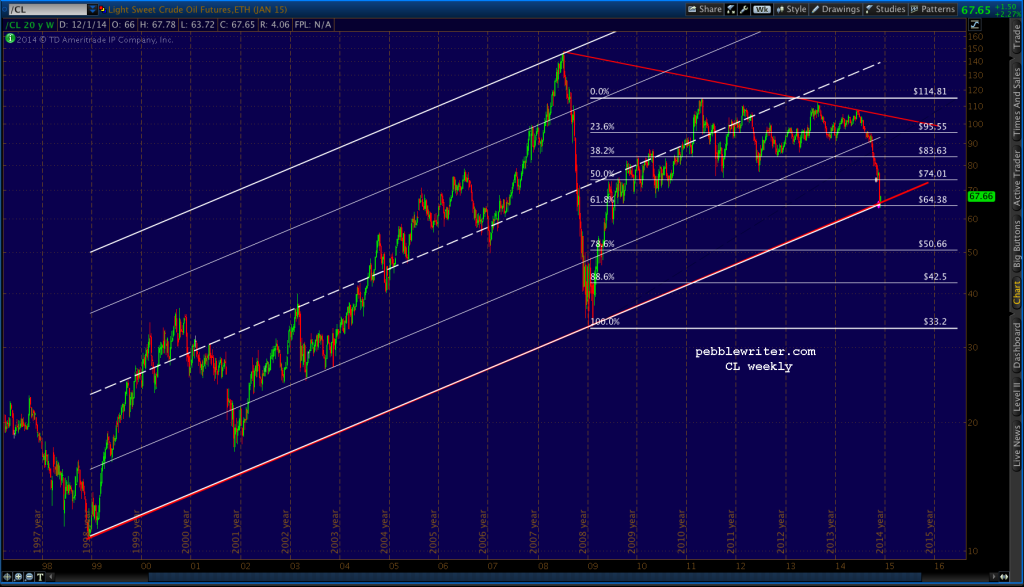
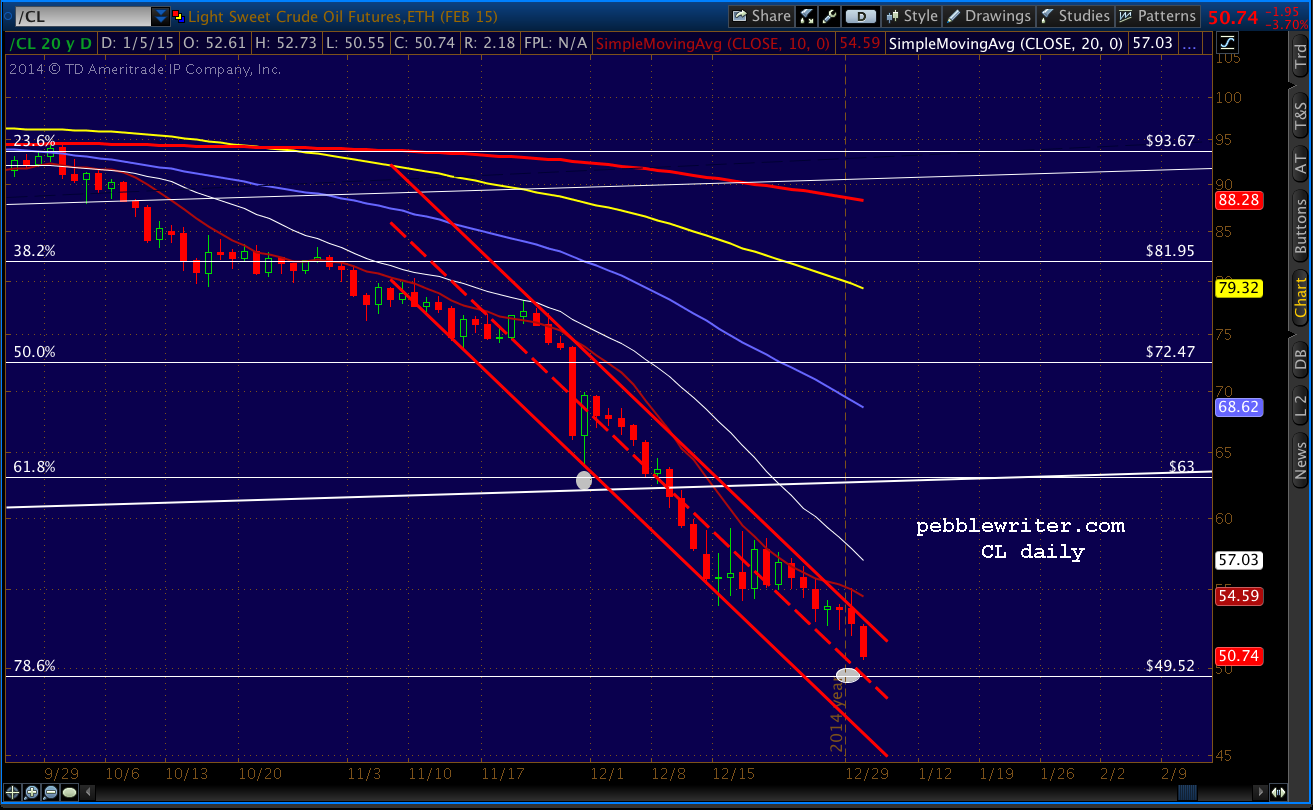
    On Dec 1, Crude Light Oil came close to but didn’t quite tag the .618 we’ve been watching.

    2014-12-09 CL daily 0530Our Fib grid had been placed slightly off.  Today marked a solid tag, meaning we should now get the significant rebound we’ve been expecting. 2014-12-09 CL wkly 0530A sustained drop below the white channel bottom, on the other hand, would be extremely bearish and a clear signal to short oil.

  • Charts I’m Watching: Dec 9, 2014

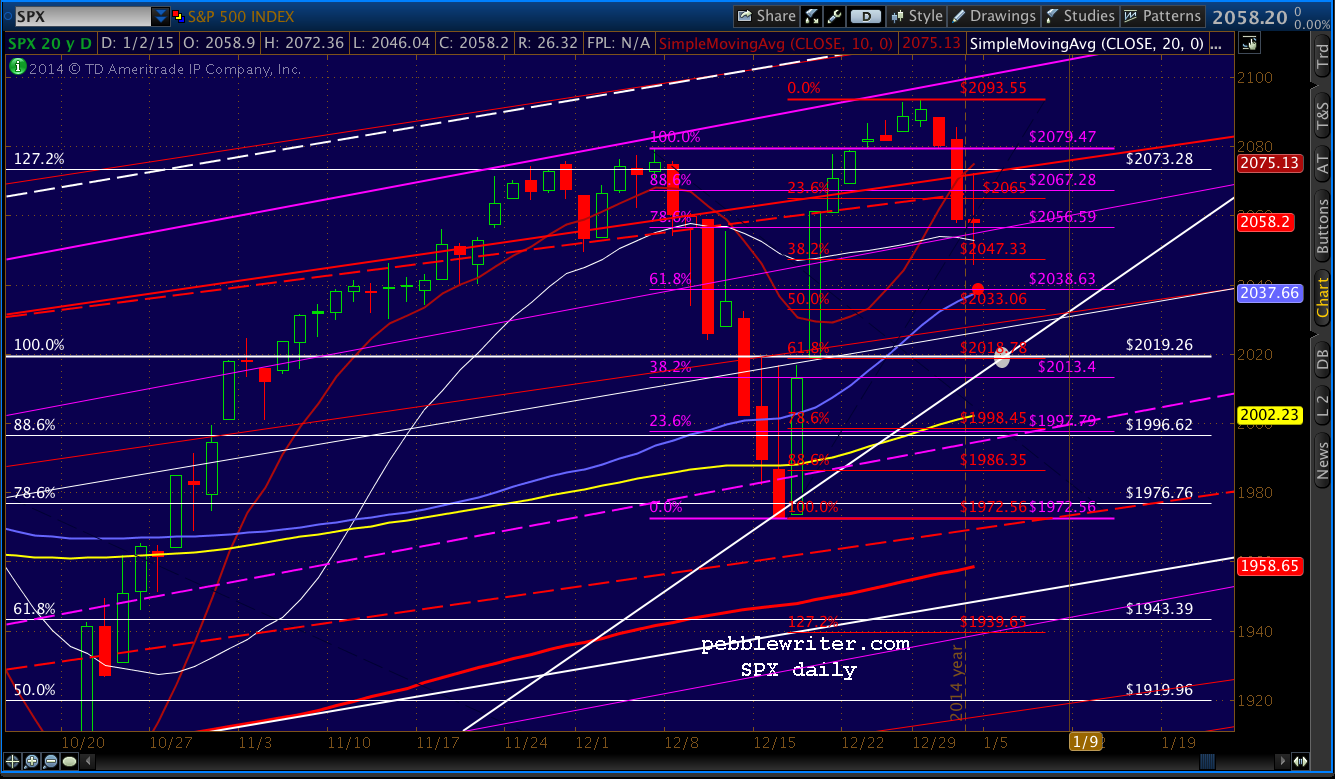
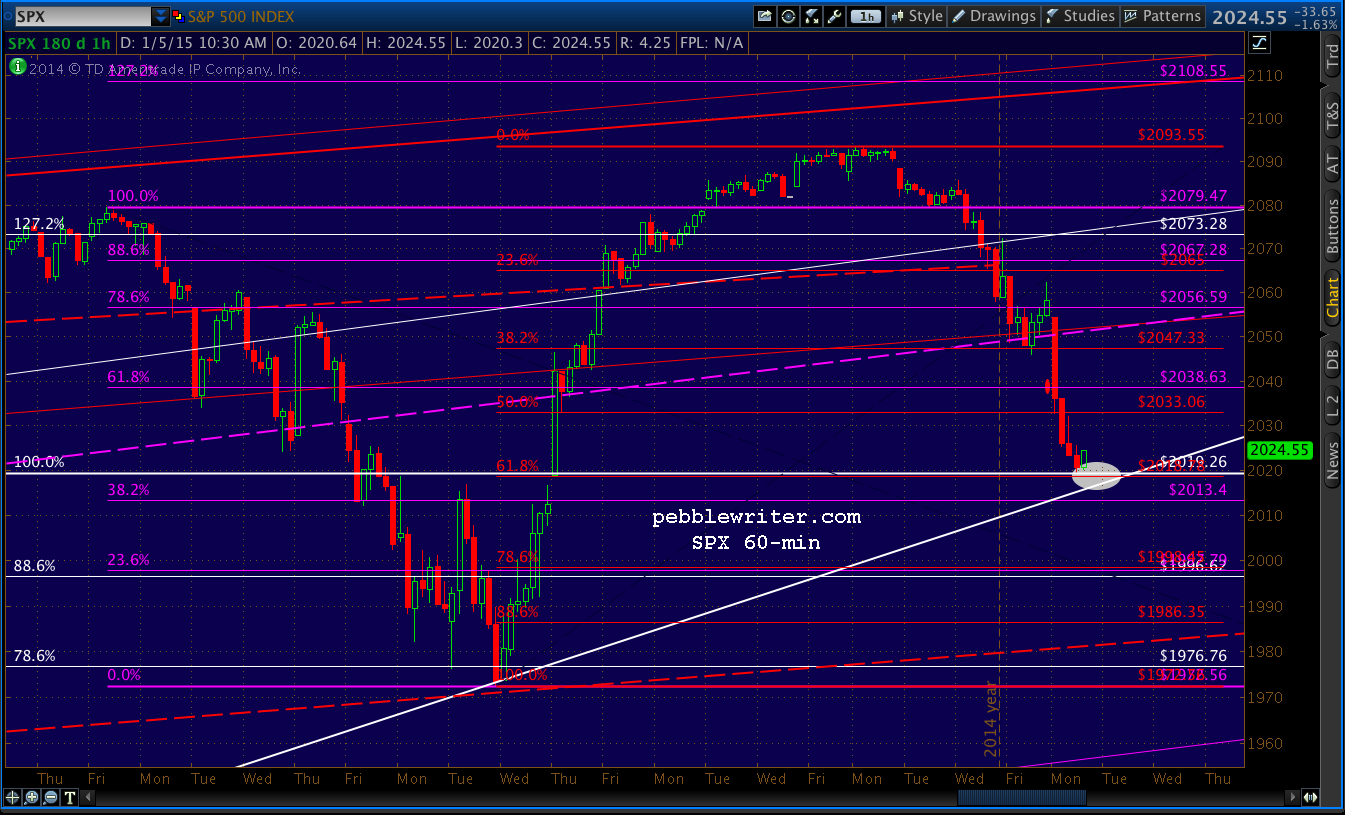
    SPX dipped slightly lower than our 2055 target yesterday, reversing at 2054.27 before a lackluster bounce that reached 2063 before petering out.  From the Dec 5 Update:

    With USDJPY overshooting the .618 to tag the channel top and a small scale 2.618, I wouldn’t be surprised to see its rally fizzle here and SPX drop back from 2077 to set up for some of that chop we’re expecting. Any significant downside should be constrained to 2055 — as the SMA20 is about to cross the red TL connecting tops from the past several months.

    2014-12-09 SPX 60 0530With the futures currently off nearly 20 points, the red TL is certain to fall this morning.  Why?  As we mentioned, SPX would continue to hold its channels if USDJPY could hold its rising wedge — which just broke down overnight.

    2014-12-09 USDJPY daily 0530ES is in need of a stick save.  And USDJPY has usually obliged.  But, China is selling off dramatically at the moment, and there’s a lot of money running for the hills.  For Japan, that means money flowing back into the yen which, when it strengthens, sends USDJPY lower and rattles the yen carry trade.

    USDJPY has reached a TL of support (purple, below) so we’ll watch to see if it gets a reversal here that allows SPX to bottom out at 2041 (the 1.272).  If not, SPX’s next support isn’t until 2031 (1.618) and then the previous high way down at 2019.

    2014-12-09 USDJPY 60 0630Key support levels for USDJPY are the SMA10 at 119.239 and the purple .886 at 118.59.  Coming up, expected moves for the next few days.

    continued for members(more…)

  • Two Down, Three to Go

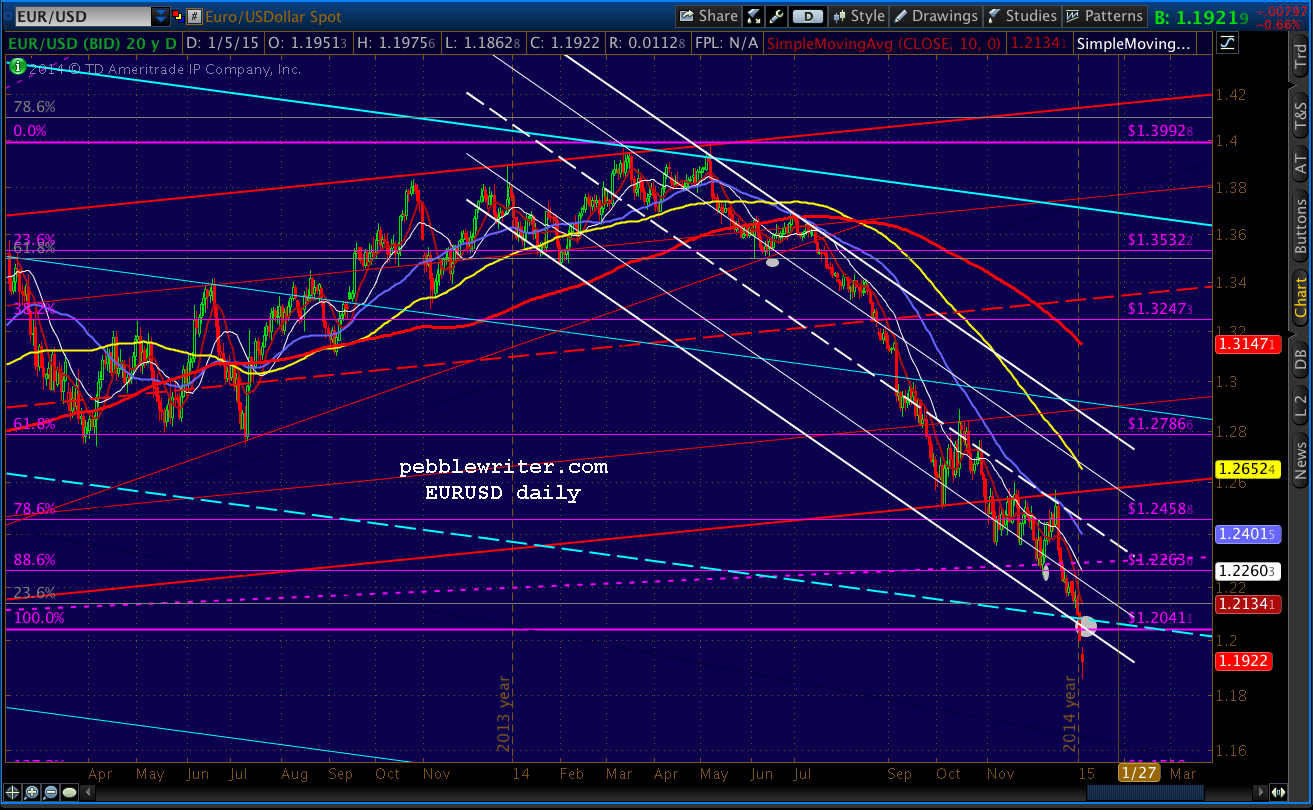
    The EURUSD tagged our 1.22635 target from Dec 3 [see: Update on Currencies] overnight, leaving just three more year-end targets to reach: ZN, DX and VIX.  Note that, like most other coincident indicators, EURUSD prices have diverged from SPX (thin purple line) — particularly over the past six months.

    2014-12-08-EURUSD daily v ES 0600Following news that Japan’s Q3 economic contraction was even worse than originally thought (-1.9% versus -1.6) the USDJPY has also sold off — down .50% so far.  Incredibly, a Japanese government spokesman was immediately in the news saying that “the economy continues to gradually recover.”

    2014-12-08-USDJPY daily v ES 0600

    USDJPY, along with VIX [see: Our Unrigged Markets] provided the usual closing bell boost to equities Friday afternoon, and is now leading futures lower (-6.5 at present.)

    2014-12-08-USDJPY v ES 60 0600SPX reached a little higher (2079.47) than we expected Friday before turning around and sliding toward the close.  The above-mentioned last second manipulation by USDJPY and VIX saved it from a red day.

    With USDJPY overshooting the .618 to tag the channel top and a small scale 2.618, I wouldn’t be surprised to see its rally fizzle here and SPX drop back from 2077 to set up for some of that chop we’re expecting. Any significant downside should be constrained to 2055 — as the SMA20 is about to cross the red TL connecting tops from the past several months.

    2014-12-08-SPX 15 0635If USDJPY can hold the rising wedge lower bound, SPX should hold the small white channel.  If not…

    continued for members…
    (more…)

  • Our Unrigged Markets

    So, you’re sitting at the Citadel trading desk, minding the Fed’s your own business, planning your weekend, when alarms suddenly start ringing. You glance up and notice the market is in danger of closing in the red for the day.  Not good!

    2014-12-05-ES 5 min 1250You scan the monitors, and sure enough, VIX crept back up above last week’s lows!  Jinkies!

    2014-12-05-VIX 15 1238Fortunately, you have at your disposal the ability to turn it all around in a jiffy with just the click of a mouse.

    2014-12-05-VIX 1 1251A few seconds later… VIX monkey-hammered by 5.3%, SPX closes up 3.45 on the day.

    2014-12-05-SPX 5 min 1305The universe is safe for democracy.  The American way of life is preserved for at least one more weekend.  Time to celebrate!


  • Update on AUDUSD: Dec 5, 2014

    AUDUSD has reached a potentially important channel line at an overshoot to a Fib reversal point (the purple .886 below.) While the USD has been on a tear lately, we are looking for it to take a breather.  So, a little rally here for AUDUSD wouldn’t be surprising.

    There was a nice reversal at the purple .786, so ultimately we should consider the possibility of a Butterfly Pattern to the purple 1.272 intersecting with the white .786.  It just doesn’t jibe with the rising white channel bottom, so that might be a stretch.

    2014-12-05-AUDUSD weekly CU 0900IMHO, the big picture focuses more attention on the yellow .786 at .747 as the end of the reaction following the huge Crab Pattern completion — though a backtest of the previous high at .821 is the obvious bullish roadblock.

    2014-12-05-AUDUSD weekly 0900Like just about everything else (except USDJPY), AUDUSD lost its positive correlation with SPX in late 2013 when central planners led “markets” down the rabbit hole.  It’s hard to know when/if this will change, but it’s worth checking in from time to time.

    2014-12-05-AUDUSD v SPX 0900


    A close-up:


    2014-12-05-AUDUSD v SPX CU 0900

  • Update on XLF: Dec 5, 2014

    It’s been a while since we looked at XLF — partly because it’s one of the most frustrating examples of central bank planning obliterating chart patterns and harmonics which are normally highly predictive.  I suppose it’s to be expected, as no sector has benefited from the Fed’s largesse as much as financials.

    At the end of 2013, when the purple rising wedge and two different Fib levels indicated a significant reversal, XLF did just that.  It coincided with SPX’s dip back below the significant 1823.

    2014-12-05-XLF daily 0800But, like SPX, it was rescued by the Fed, ECB and BOJ and was suddenly back in the rising wedge and seeking higher highs on the back of a new TL, shown above in red.

    It lost that TL, too, in the August 2014 mini-correction.  Wouldn’t you know, it popped back above, only to really melt down in the Sep-Oct near-correction of -9.75%.

    For those who don’t live and breathe chart patterns, losing a trend line is supposed to be a big deal.  It’s not normally as easy as the past year has made it seem.  But, then, nothing about the bubble-blowing central bank reinflation of “markets” is terribly normal.

    2014-12-05-XLF weekly 0800Now, safely back above the red TL, XLF is approaching several Fib levels that would, in an unrigged market, matter.  I point them out in the off chance that TPTB let a little air out after the end of the year, and because it gives bulls something to target as they BTFD.

    The most important is theoretically the white .618 at 25.82, which intersects with the white channel .25 line around year’s end.


  • Update on Bonds: Dec 5, 2014

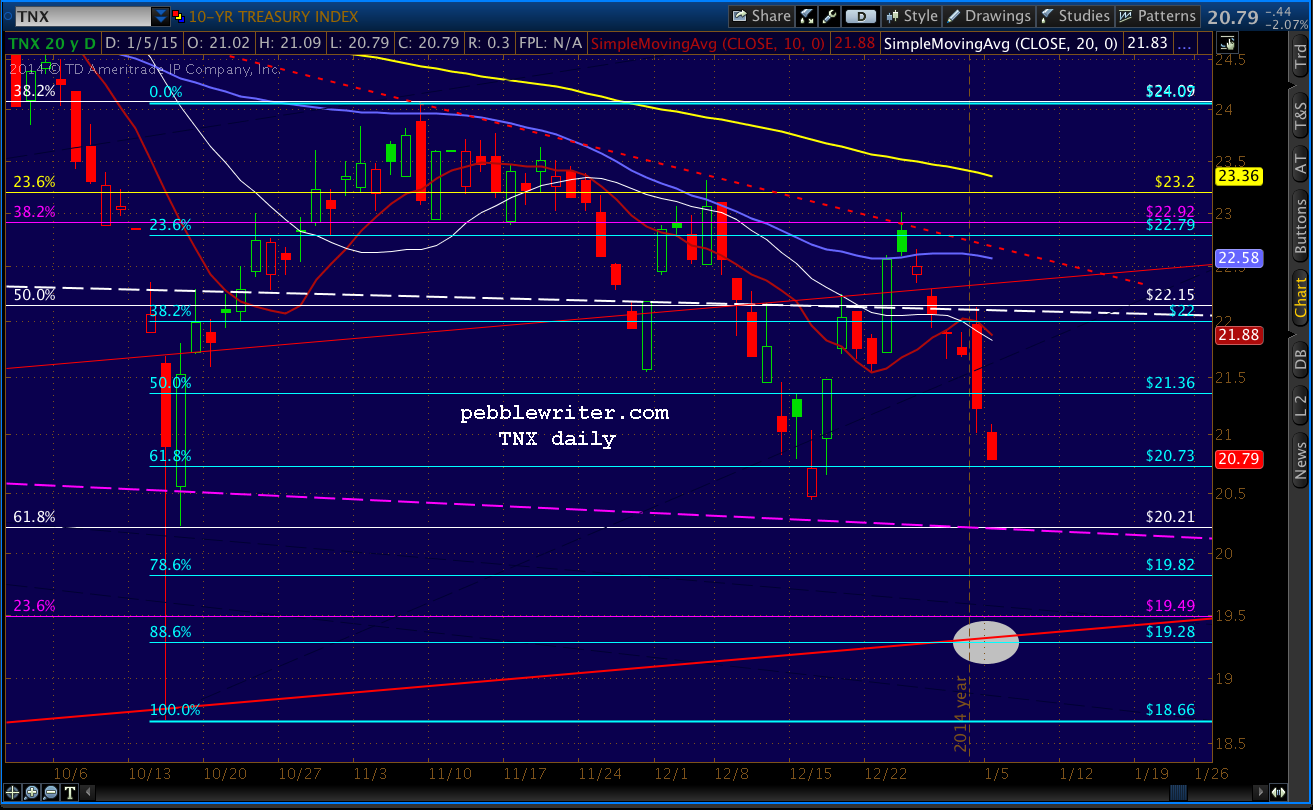
    Yields on the 10-yr have bounced strongly since it reached our reversal target on Monday [see: CIW Dec 1.]  Today, TNX tested both the 20- and 50-day moving averages and are probably ready for a breather, if not outright reversal.

    2014-12-05-TNX daily 0750We got the reaction we were expecting, with SPX having backtested the TL and up to 2077 as of this morning.

    The end result should be that SPX closes back above 2055 (but, below the SMA5 at 2065 after setting a record last week) in order to back test the red, dashed TL connecting the Jul 24, Sep 4 and Sep 19 tops.

    As we look for signals of the chop that should develop between now and year-end, this is a pretty good one.  I wouldn’t be surprised to see a pullback to 22.18 to close the last gap or even 21.80 to tag the bottom of the developing triangle.

    If I’m wrong, the SMA100 is just above at 23.93.  But, I don’t think equities are ready to break out just yet.

  • Charts I’m Watching: Dec 5, 2014

    Futures were all over the map following this morning’s jobs report.  ES spiked to 2077, plunged to 2068.50, then shot back 2073.50 where they look to open green by 1.50.  It was all courtesy of the USDJPY, which has now not only popped above the white .618 but backtested it as well.

    2014-12-05-USDJPY v ES 15 0615The beat was so strong that it, again, raises the question of why ZIRP is still with us if jobs metrics are so important to the Fed.

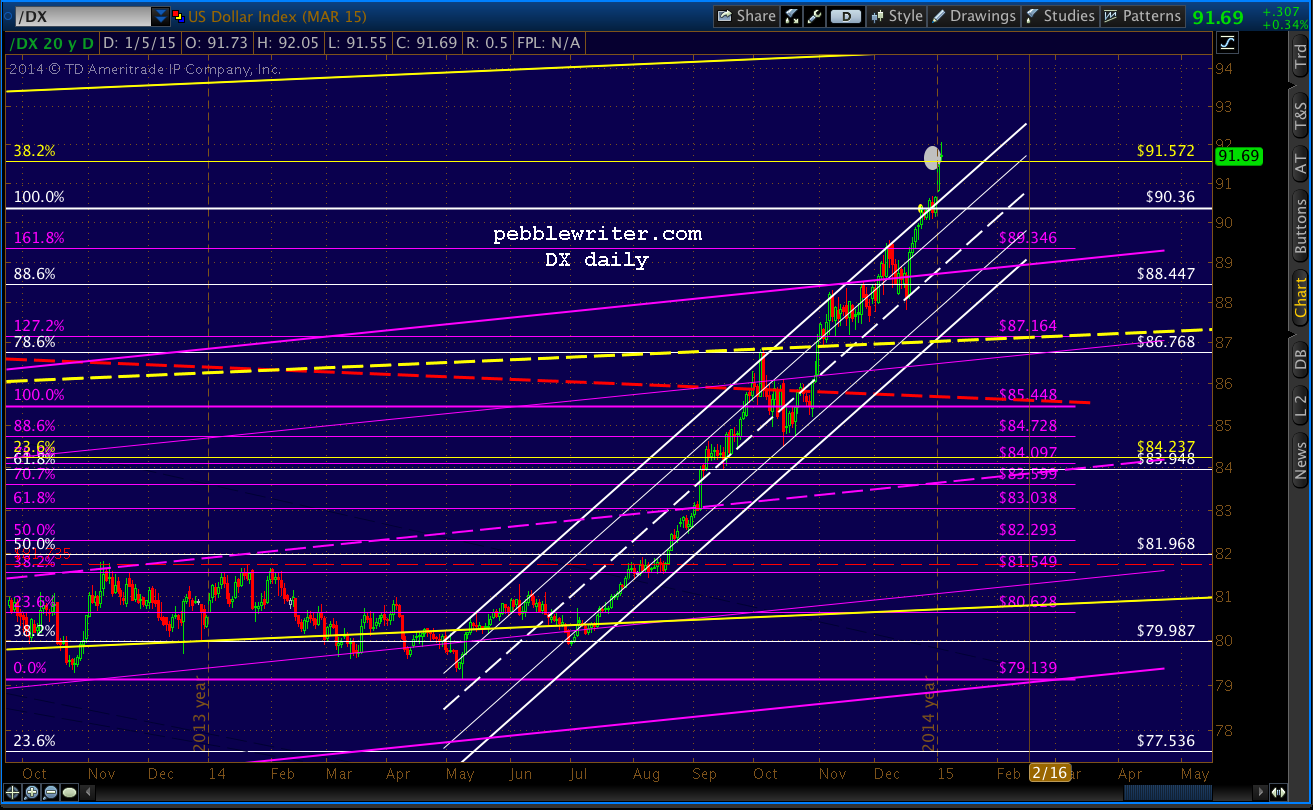
    The dollar continues toward our year-end target, solidly above the purple .886.  Likewise, 10 year notes. The EURUSD again came very close to our 1.2263 target, bottoming out at 1.2278 — probably close enough for anyone wanting to take a shot at a bounce but not quite there.

    2014-12-05-EURUSD 60 0620

    Balance of trade, barely mentioned anymore by the MSM, missed estimates of a bounce higher (less negative) clocking in at -$43.4 billion rather than the -$40.0 billion forecast by Briefing.com.  As we discussed two days ago [see: Update on Currencies], this is hardly a surprise given the USD’s strength.

    Looking ahead for the day, SPX should continue to trade above the white 1.272 and VIX to test 11.91.  But, keep an eye out for Factory Orders at 10:00 EST and, especially, Consumer Credit at 2:00 EST.  And, as always, watch to see what happens with USDJPY and DX reaching important inflection points.

    SPX opened up a few points and seems content to remain in the small purple acceleration channel that points directly at our year-end target of 2138-2142.

    2014-12-05-SPX daily 0635Intra-day, keep an eye on VIX and the previous low of 11.91.  If it slips below, we should expect new highs on SPX/ES.  In contrast, however, USDJPY and DX are bumping up against the top of their acceleration channels — meaning stocks might not get much more support before a reset.  So, traders might want to keep stops fairly tight and exercise caution with respect to long positions over the weekend.

    2014-12-05-DX daily 0715With USDJPY overshooting the .618 to tag the channel top and a small scale 2.618, I wouldn’t be surprised to see its rally fizzle here and SPX drop back from 2077 to set up for some of that chop we’re expecting.  Any significant downside should be constrained to 2055 — as the SMA20 is about to cross the red TL connecting tops from the past several months.

    2014-12-05-USDJPY 15 0730Another hurdle for bulls: the ten year yields have bumped up against the SMA20 and SMA50.  They could, and probably will, punch through — but probably not today, unless the consumer credit number is huge. 2014-12-05-TNX daily 0730

    Again, I think there will be many head fakes between now and Dec 31.  While swing traders should be safe holding long, traders are likely to get whipsawed six ways to Sunday as the mechanisms of the rally will, at times, strain credulity.