As we surmised, SPX made a new high on Friday. By poking through 2093.55, it technically invalidated all those nifty bearish Fibonacci patterns. Though, as we pointed out Friday, the last several times SPX eeked out a new high, there was a significant sell off.
First, the rally from 1982 has been fast and furious and fueled by a rapidly shifting news flow. We’re coming up on a holiday weekend, where big ramp jobs are commonplace — especially when it looked like the market was poised for a drop.
On the other hand, the past two new highs have been followed by large drops. I see no reason in the charts to expect this will be the third, but that will depend on whether CL retreats and/or USDJPY — which is still in retreat mode after tagging that critical .618 at 120.11 — provides its usual ramp.
 We got the new high, but we also saw USDJPY continue its retreat…
 …and CL continue to slide.
 The stage is set, but will CL and USDJPY continue to provide the necessary lift?
continued for members...
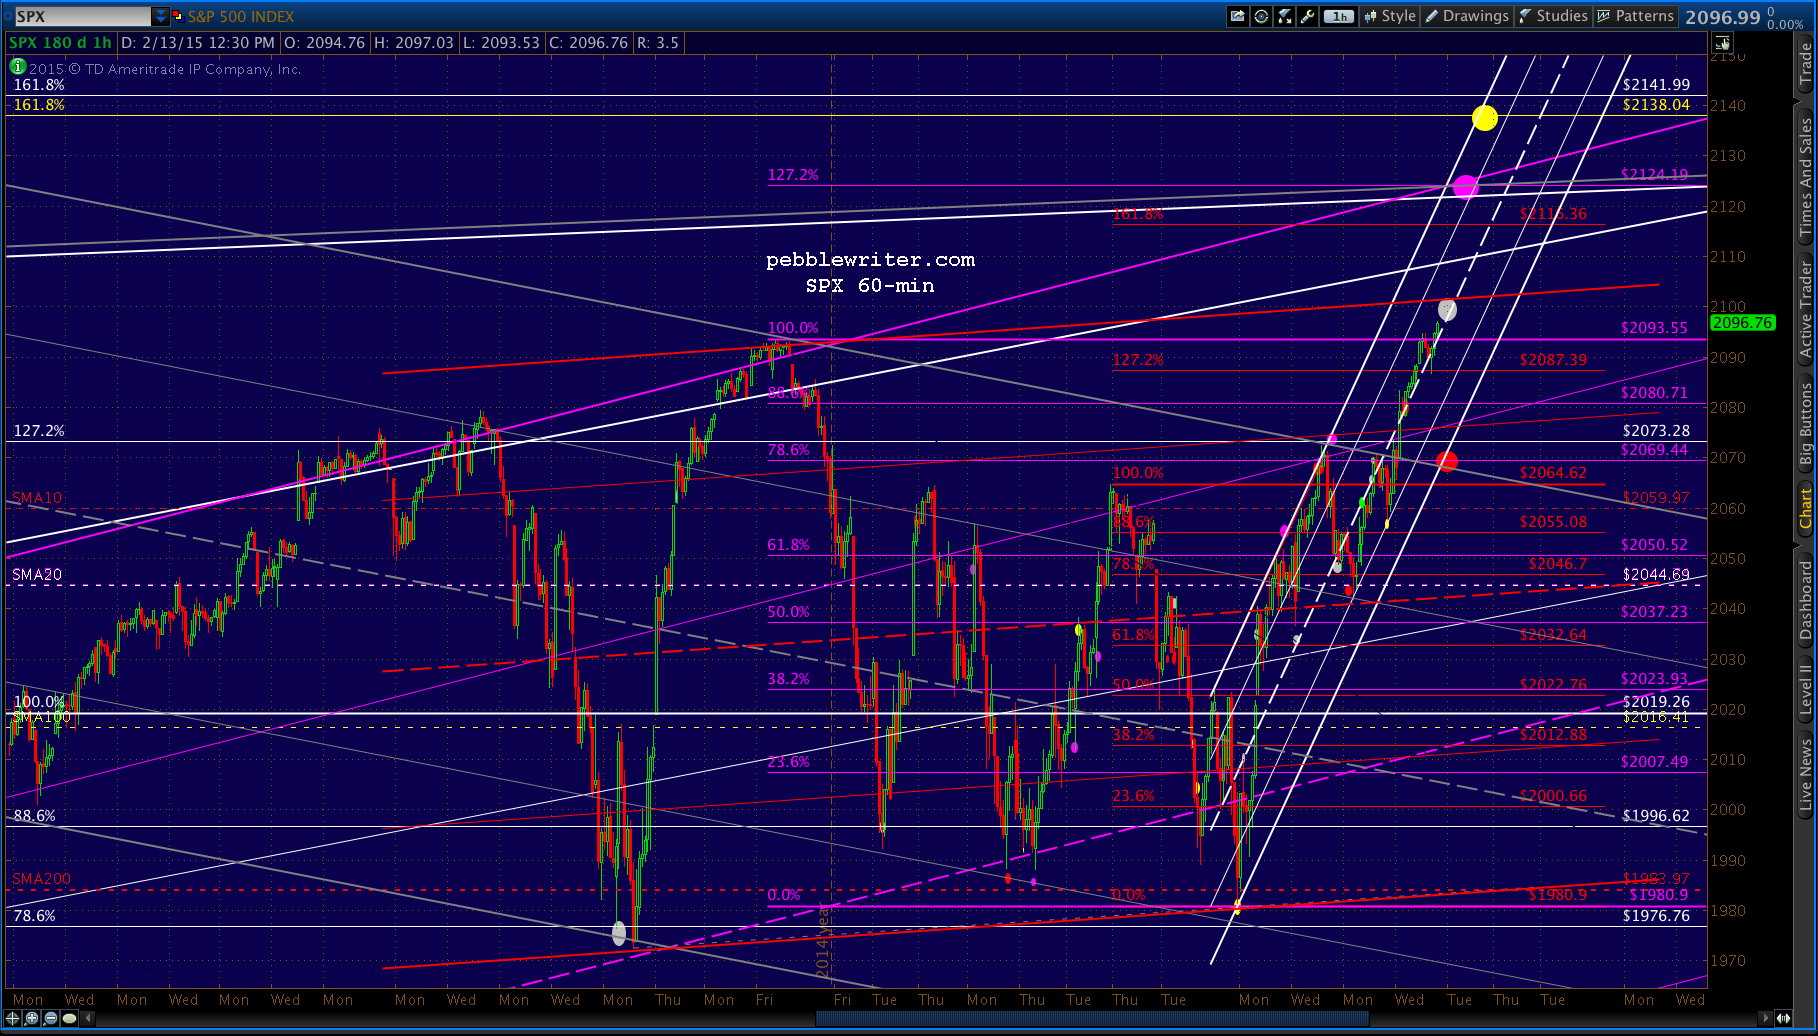
Our 2138 target is easily within our grasp, now. The white acceleration channel reaches it as soon as Thursday — assuming no big backtests or retracements. But, that’s a big assumption. The past six weeks have been full of both.
Note that the nearly horizontal red channel could provide for a quick reversal at present price levels – particularly if CL doesn’t hold at the .618 at 51.72. Given that it just backtested its broken channel without making any new highs, I think CL can get on with its next leg down to 41-42.
We’ll put a target on 2138 for Thursday (in yellow) and an interim target at the purple 1.272 at 2124 in the next day or two.
The natural spot for a downside move would be the purple .786 at 2069 or white 1.272 at 2073.