

Yesterday’s forecast worked out reasonably well. From the members’ section:
I’m looking for a pop in SPX to the purple .618 at 2060.74, after which we might see it retreat.
Then, after reaching 2060.74:
Just reached our first target at the .618. I think it’ll keep going, probably up to the .786 at 2065.87 — though it might not be a straight line.
We took a shot at a short position at 2065, but with the understanding that we might be premature:
I’d take a crack at shorting it here at 2065.72…If I’m wrong, we should see the .886 at 2068.92 instead.
SPX topped out at 2070.86 before closing at the .886 at 2068.34.
 This morning, we have a battle between the ill effects of tumbling oil prices…
 …and the carry trade magic of a rising USDJPY.
  Which will win the hearts and minds of equity investors? Or, more accurately, which will trigger the stronger algos?
continued for members…
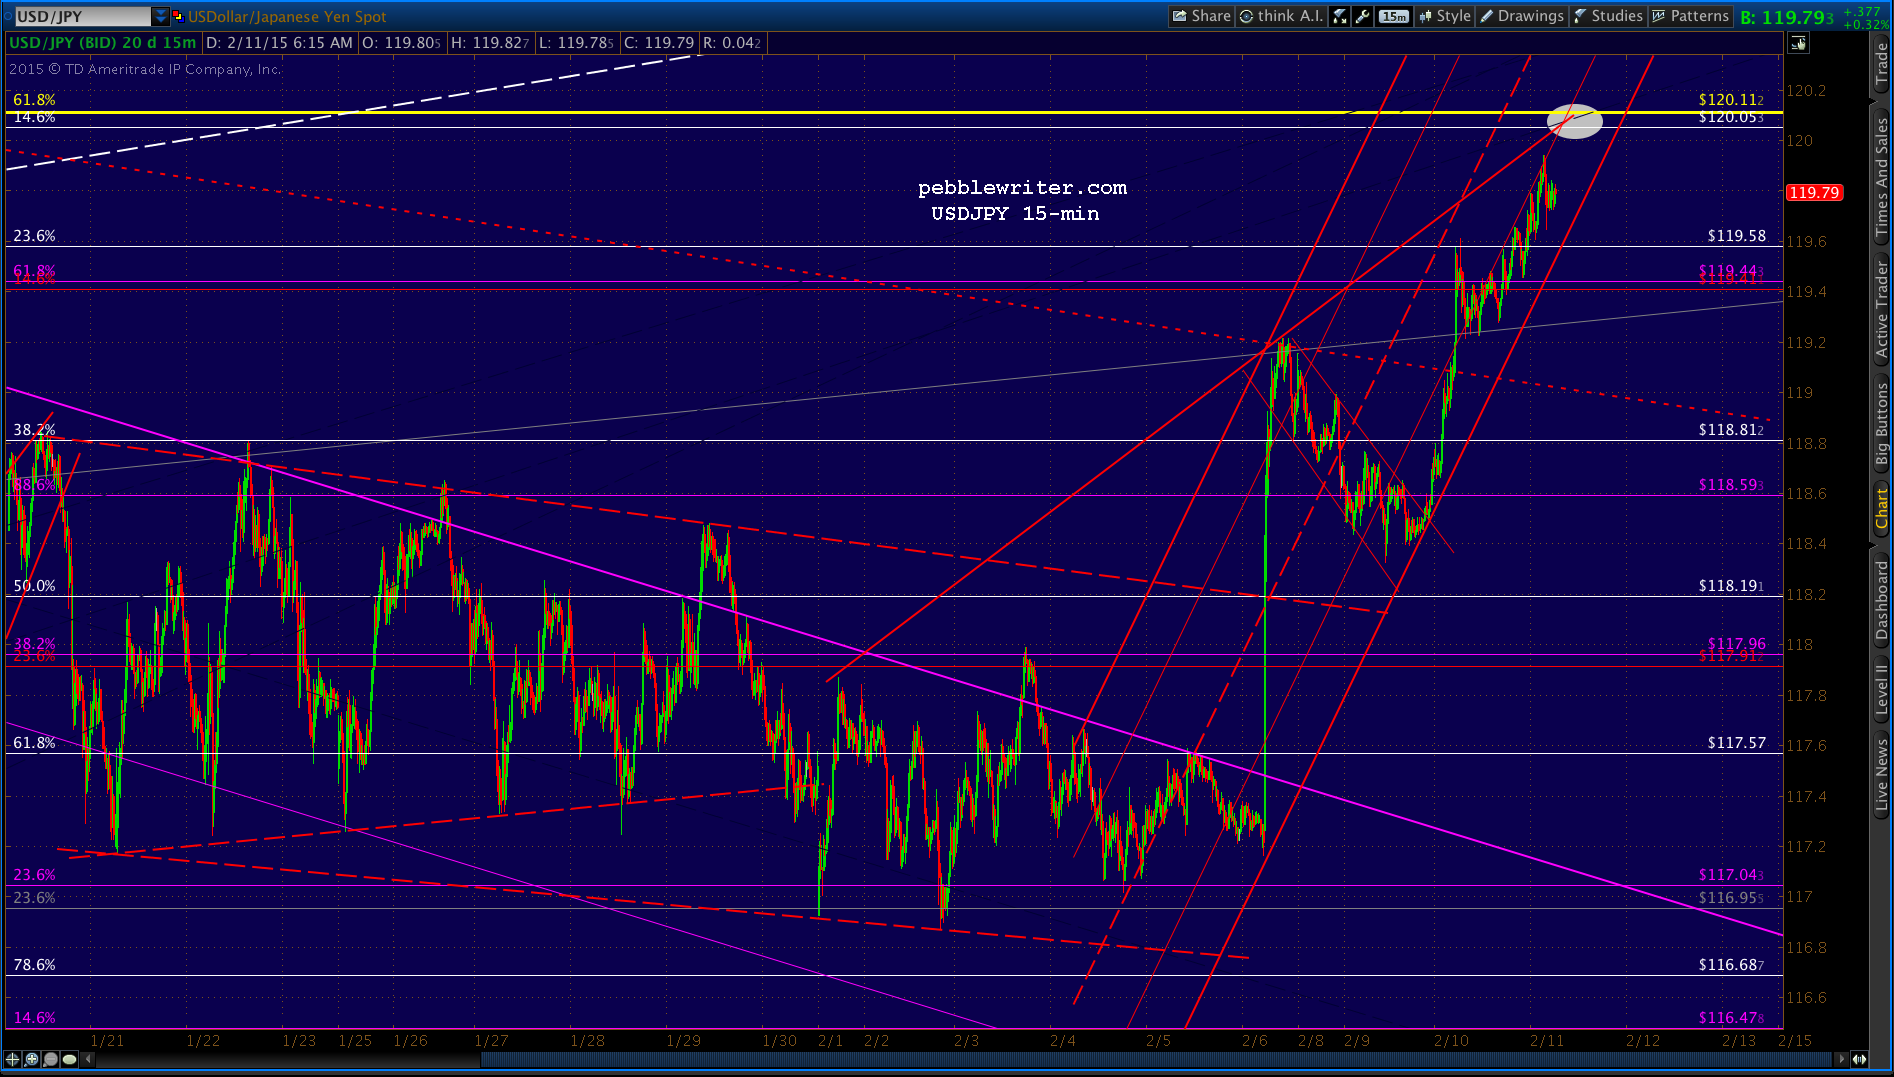
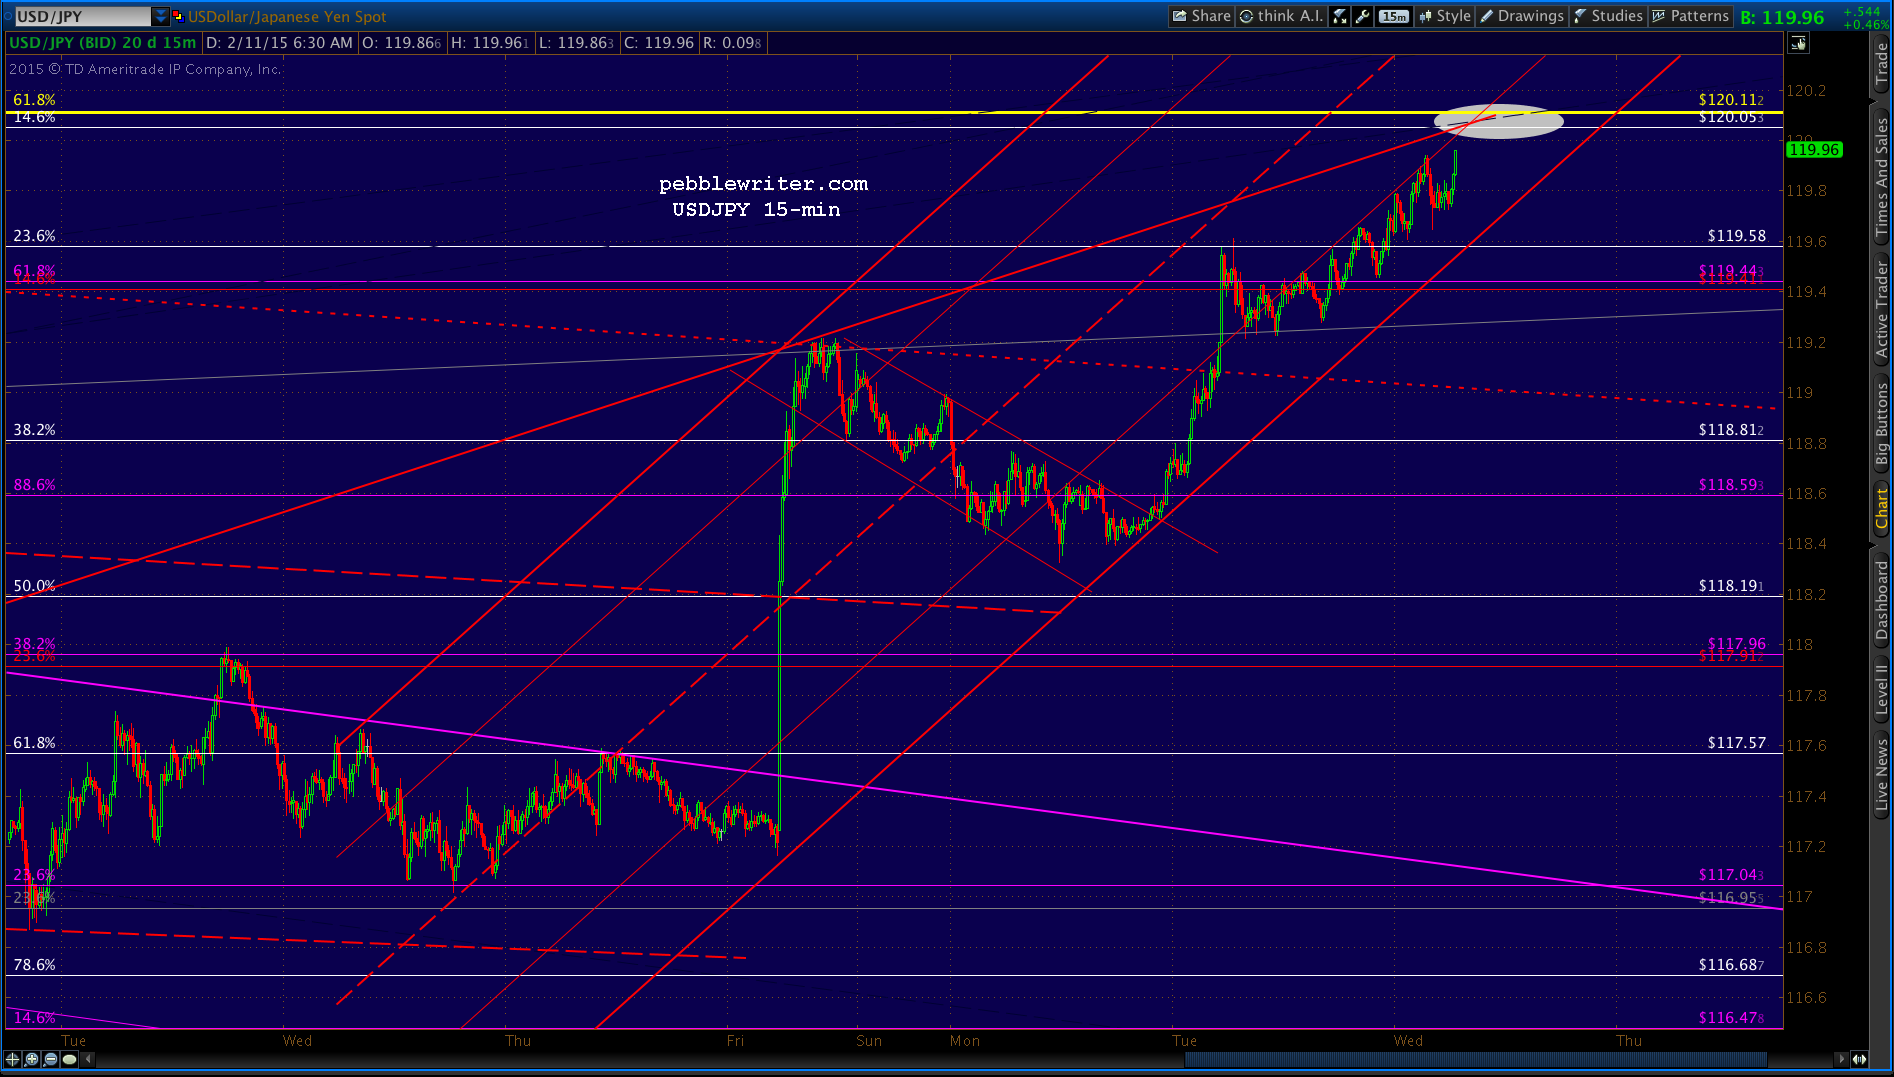
USDJPY has been going fast and furious. If it can poke through the critical yellow .618 at 120.11, then equities will get quite a boost.
 SPX might limit any initial weakness to 2064 or so — particularly if they’re able to hold the line on CL.
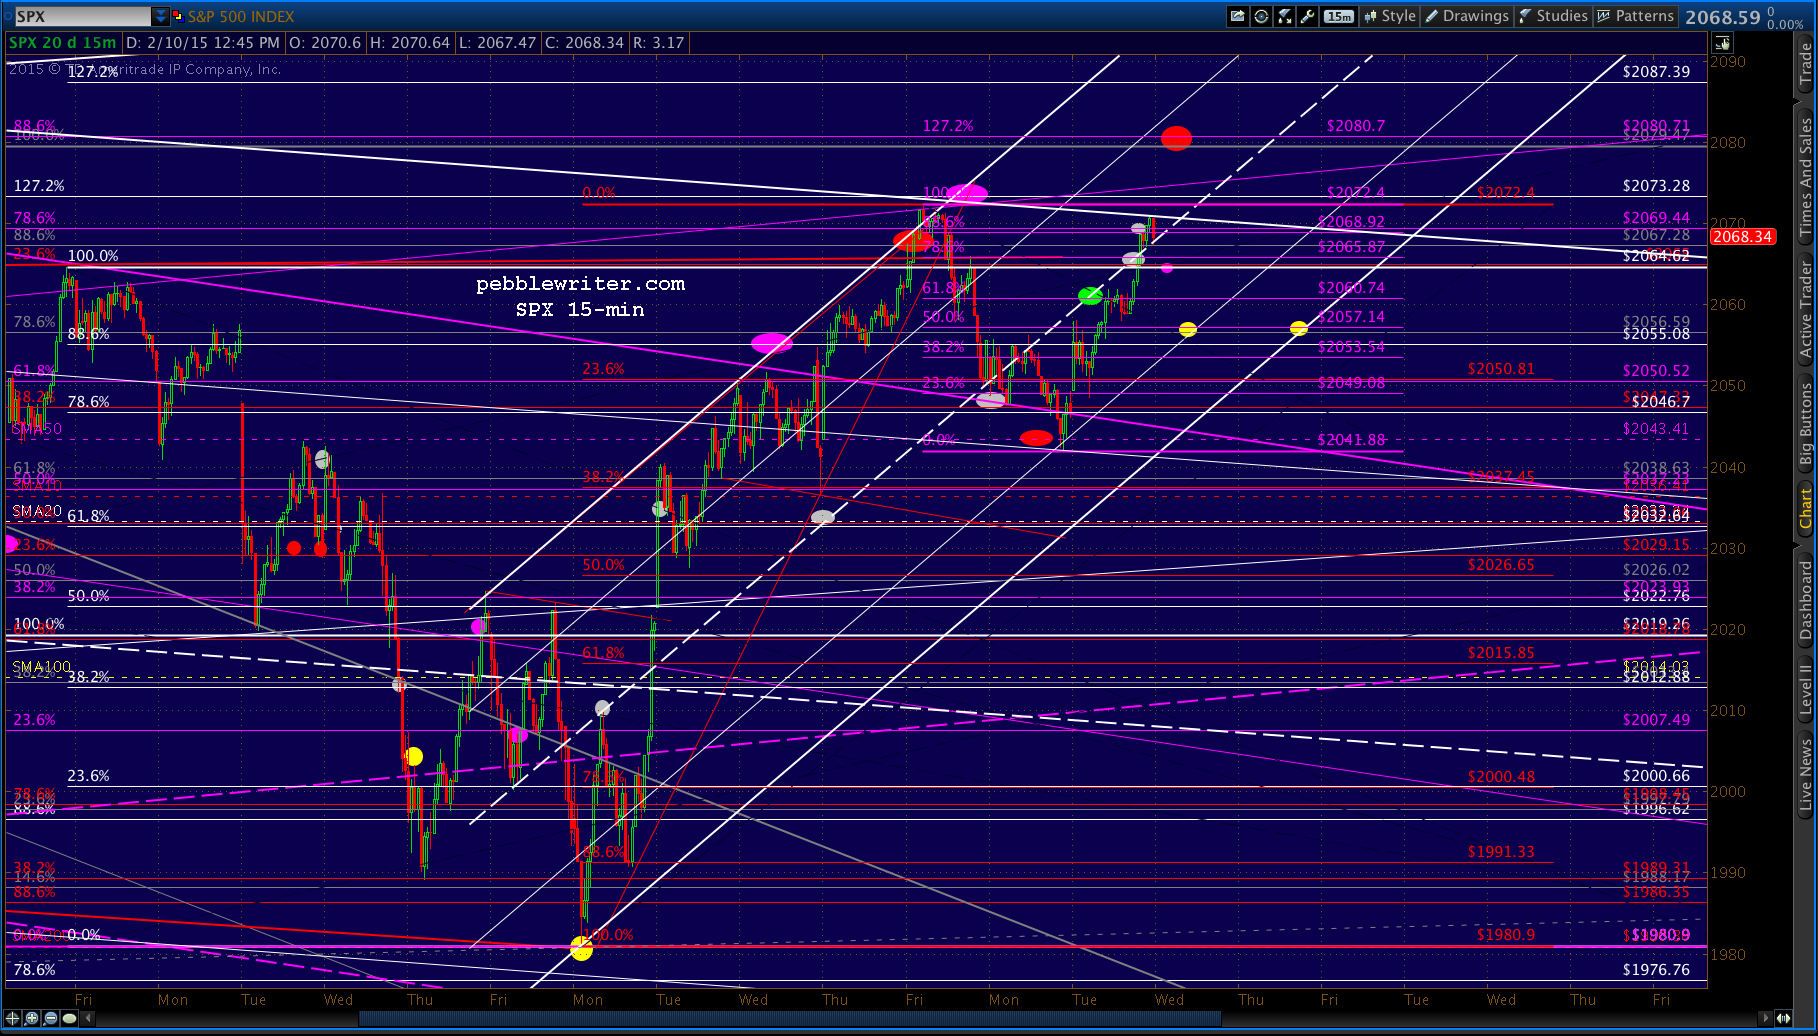 If USDJPY reverses, or CL continues to plummet, then we’re probably looking at 2057 to flesh out the rising white channel. In either case, the goal for bulls is to break through the white channel top and reach 2080 — the purple .886/1.272 combo.
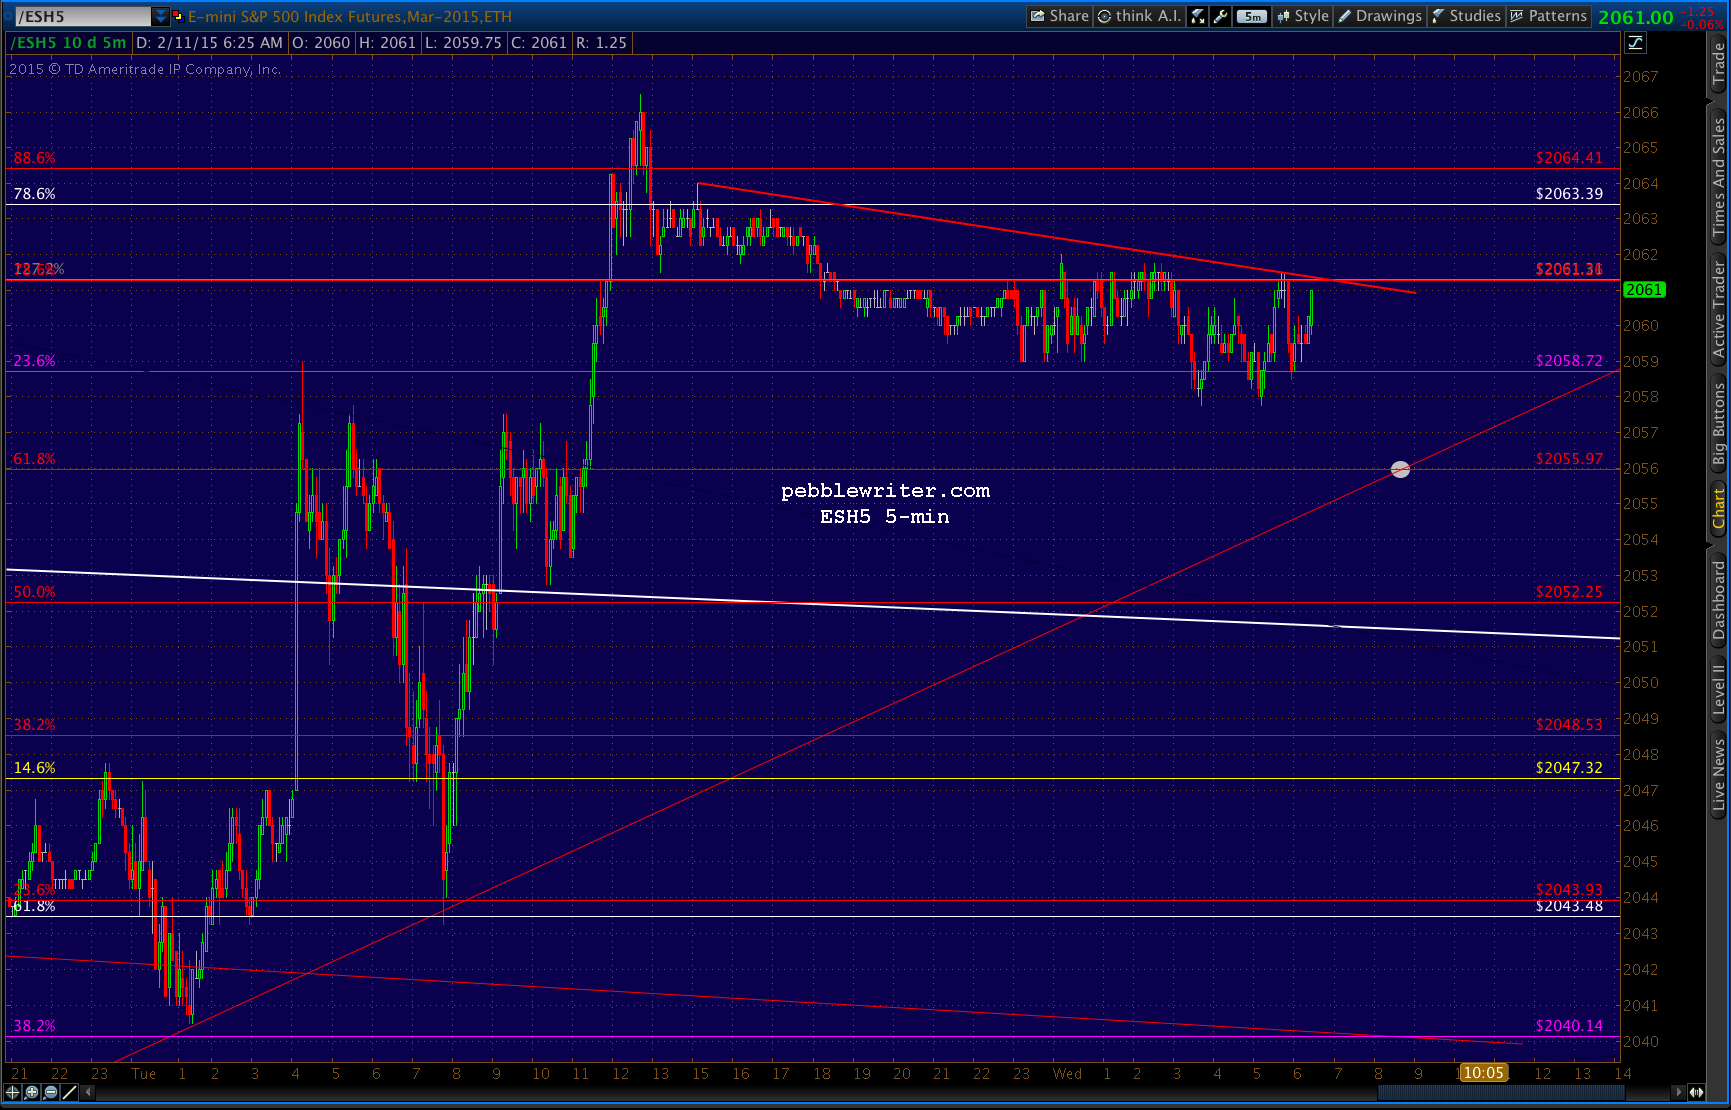
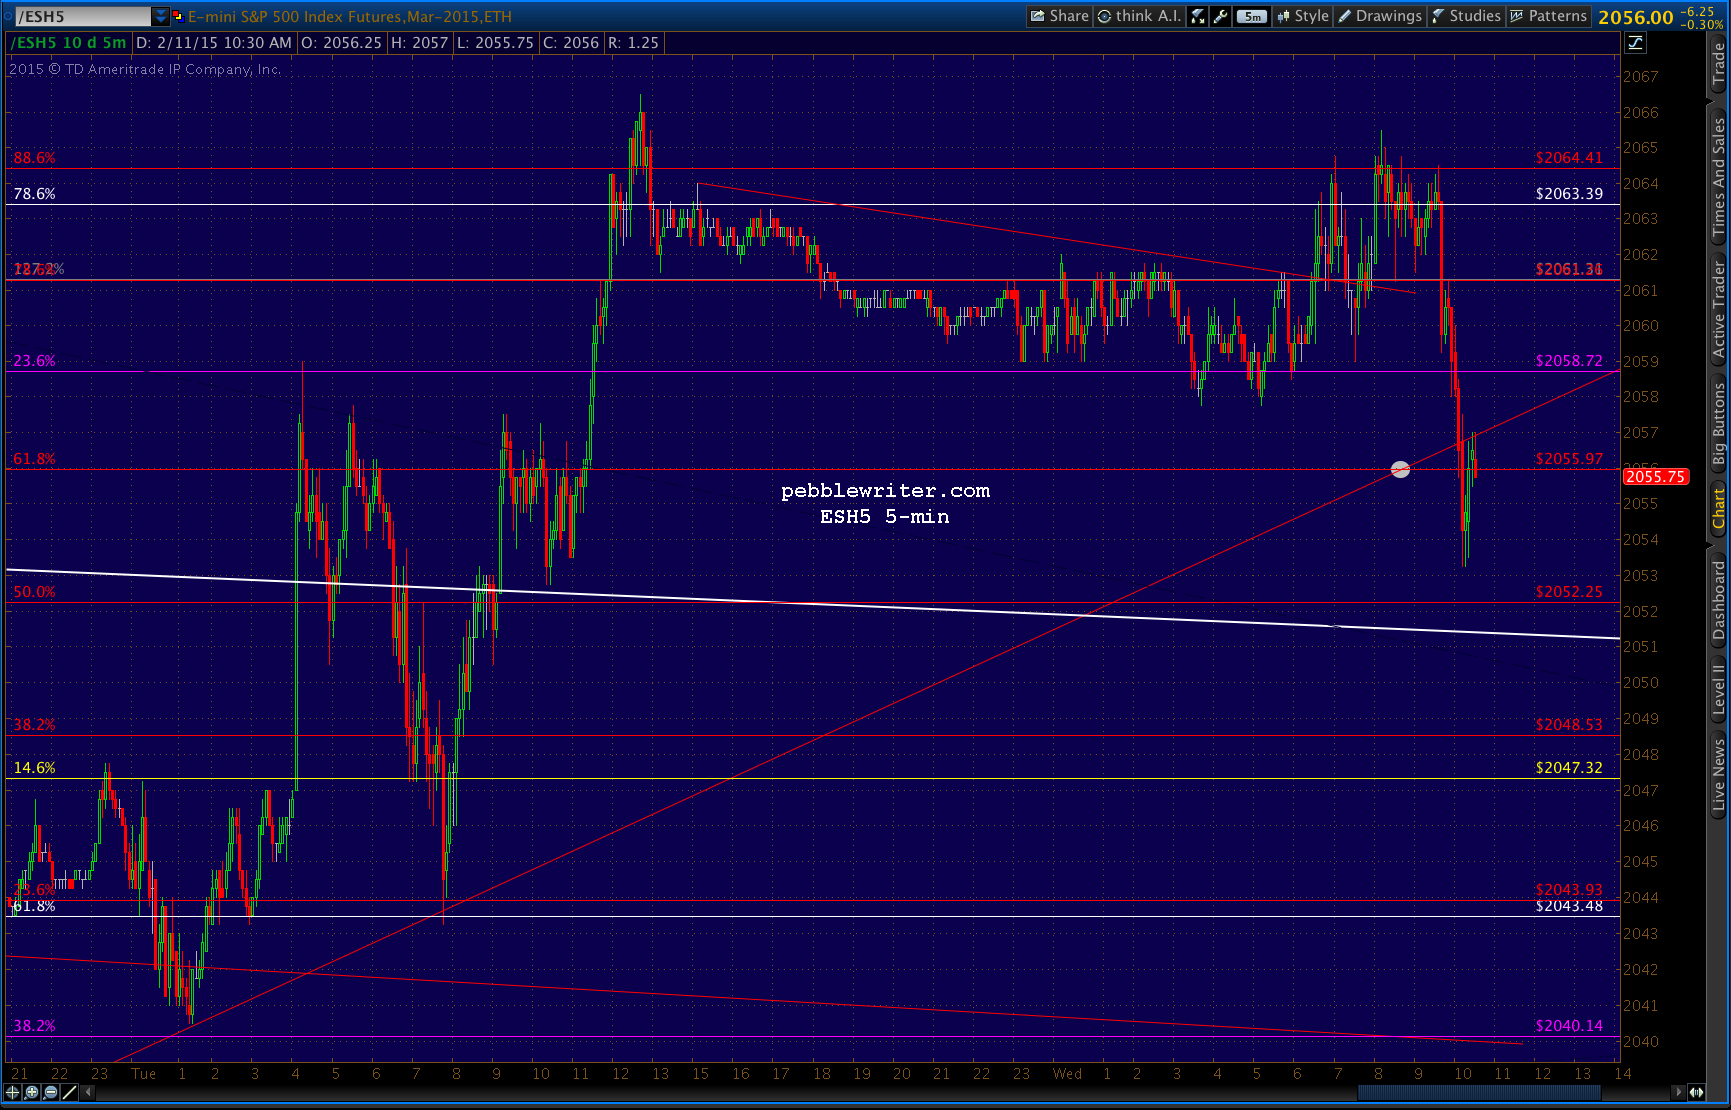
The futures are off only a few points, and seem poised to take SPX higher after a night of sideways action. Perhaps tag the 2055.97 at the rising TL and then a ramp job? Or, maybe just a pop through the resistance…
 UPDATE: 9:33 AM
This is all it took to reverse SPX at our purple target…
 Magic…
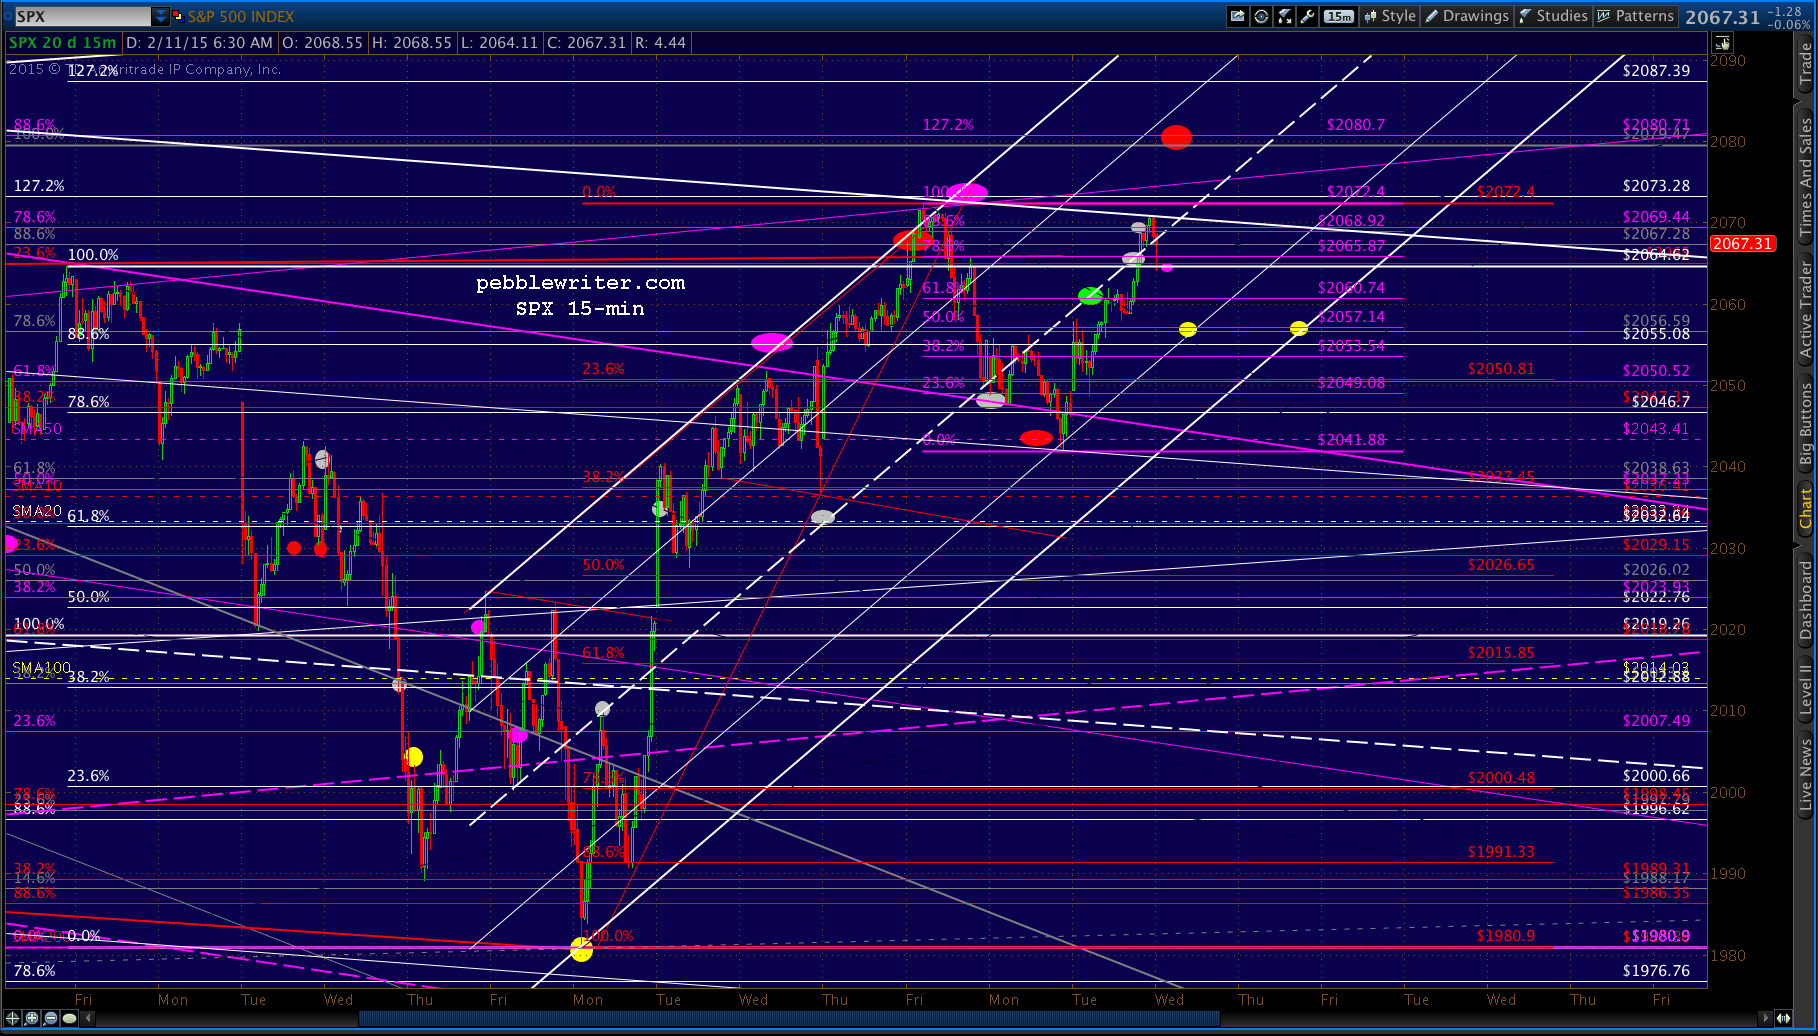 But, USDJPY’s coming up on the yellow .618…so, don’t get too comfortable with this bounce unless it pops right through.
 For newbs, and those who might have forgotten, 120.11 is the .618 retrace of the big drop from 147 to 75. It is quite literally the single most important Fib line on any chart one might be watching at this point in time.
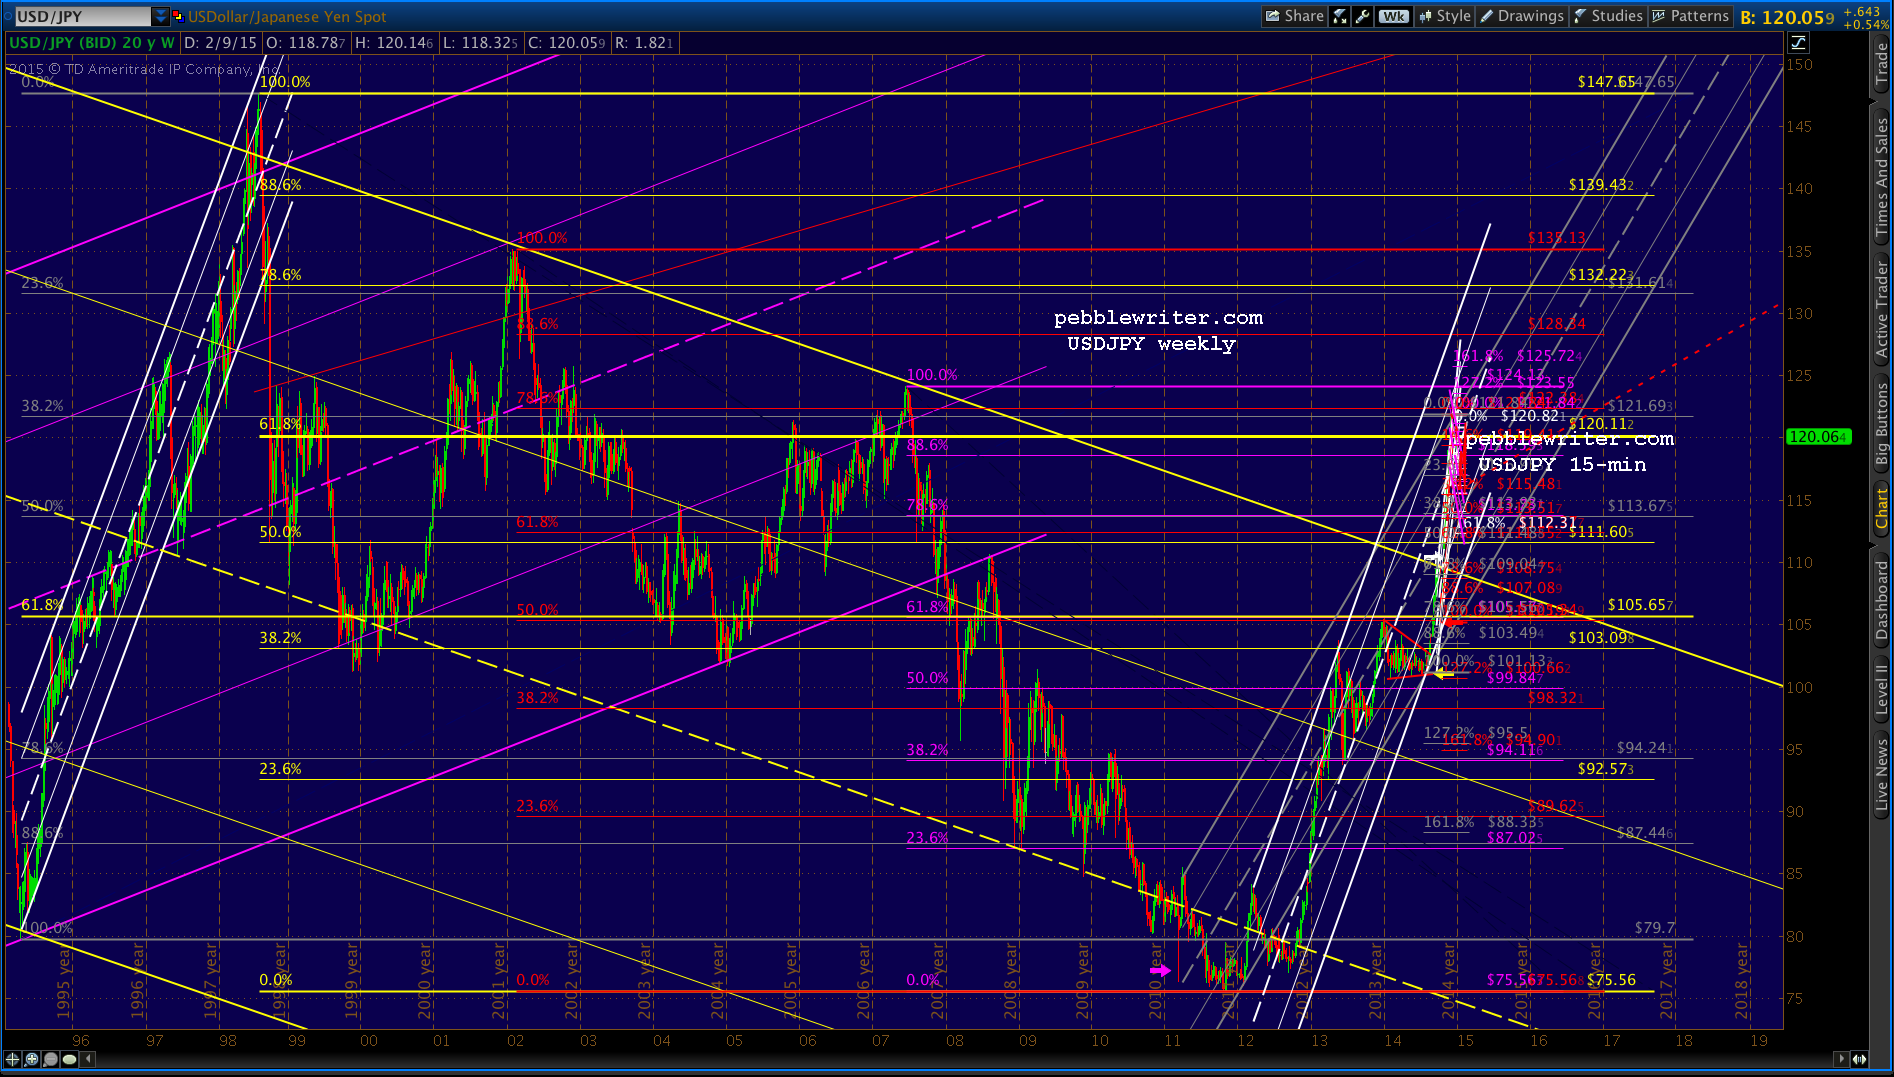 It was the drop below this line on Dec 9 (white arrow) that sent SPX into a 100-pt freefall. The subsequent (but, very brief) rise back above on Dec 23 provided a 115-pt recovery — and, so forth.
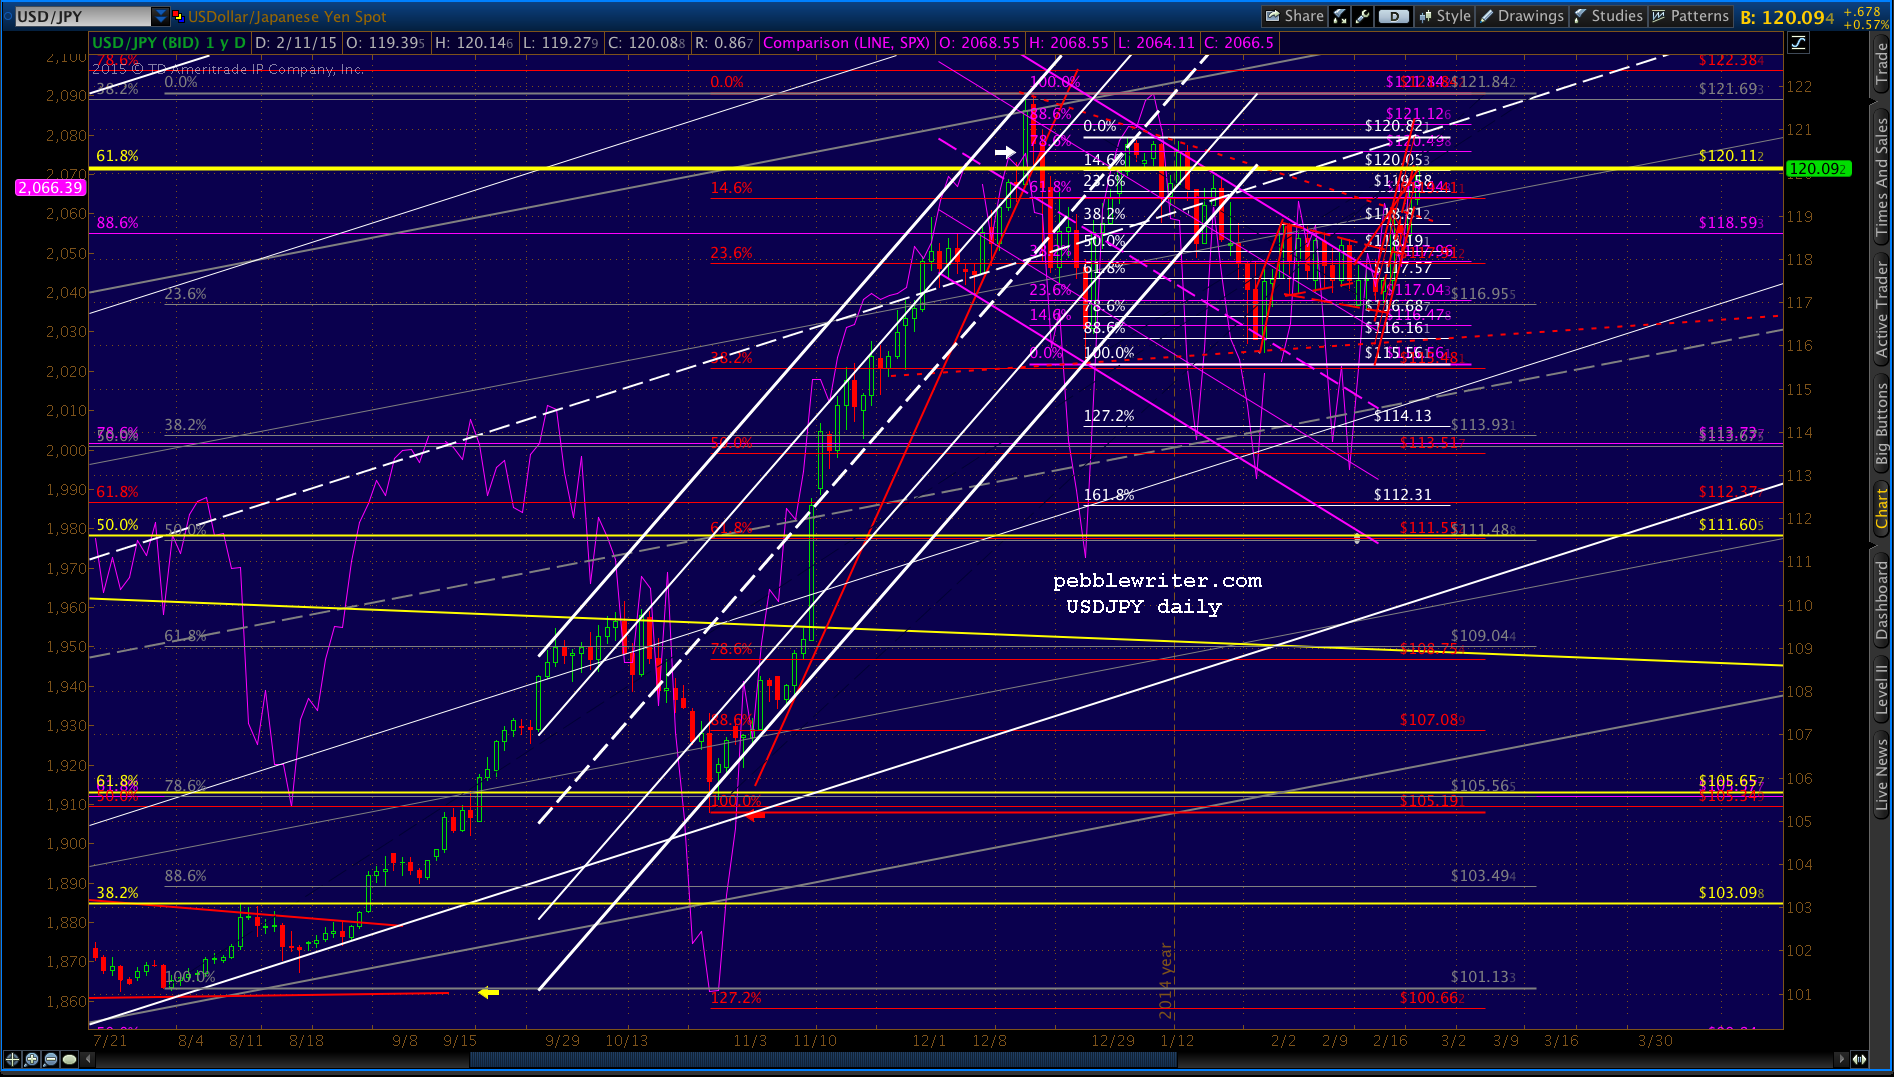 As USDJPY has continued sideways in a triangle, SPX has, likewise. Simply put, a breakout in USDJPY should produce one in SPX. While, a reversal would be most unhealthy for stocks.
GLTA.
UPDATE: 11:53 AM
USDJPY did, indeed, pop through the .618. But, SPX is waiting to see if it’ll will go anywhere, or is another head fake as in late December/early January. SPX is currently off 1 point.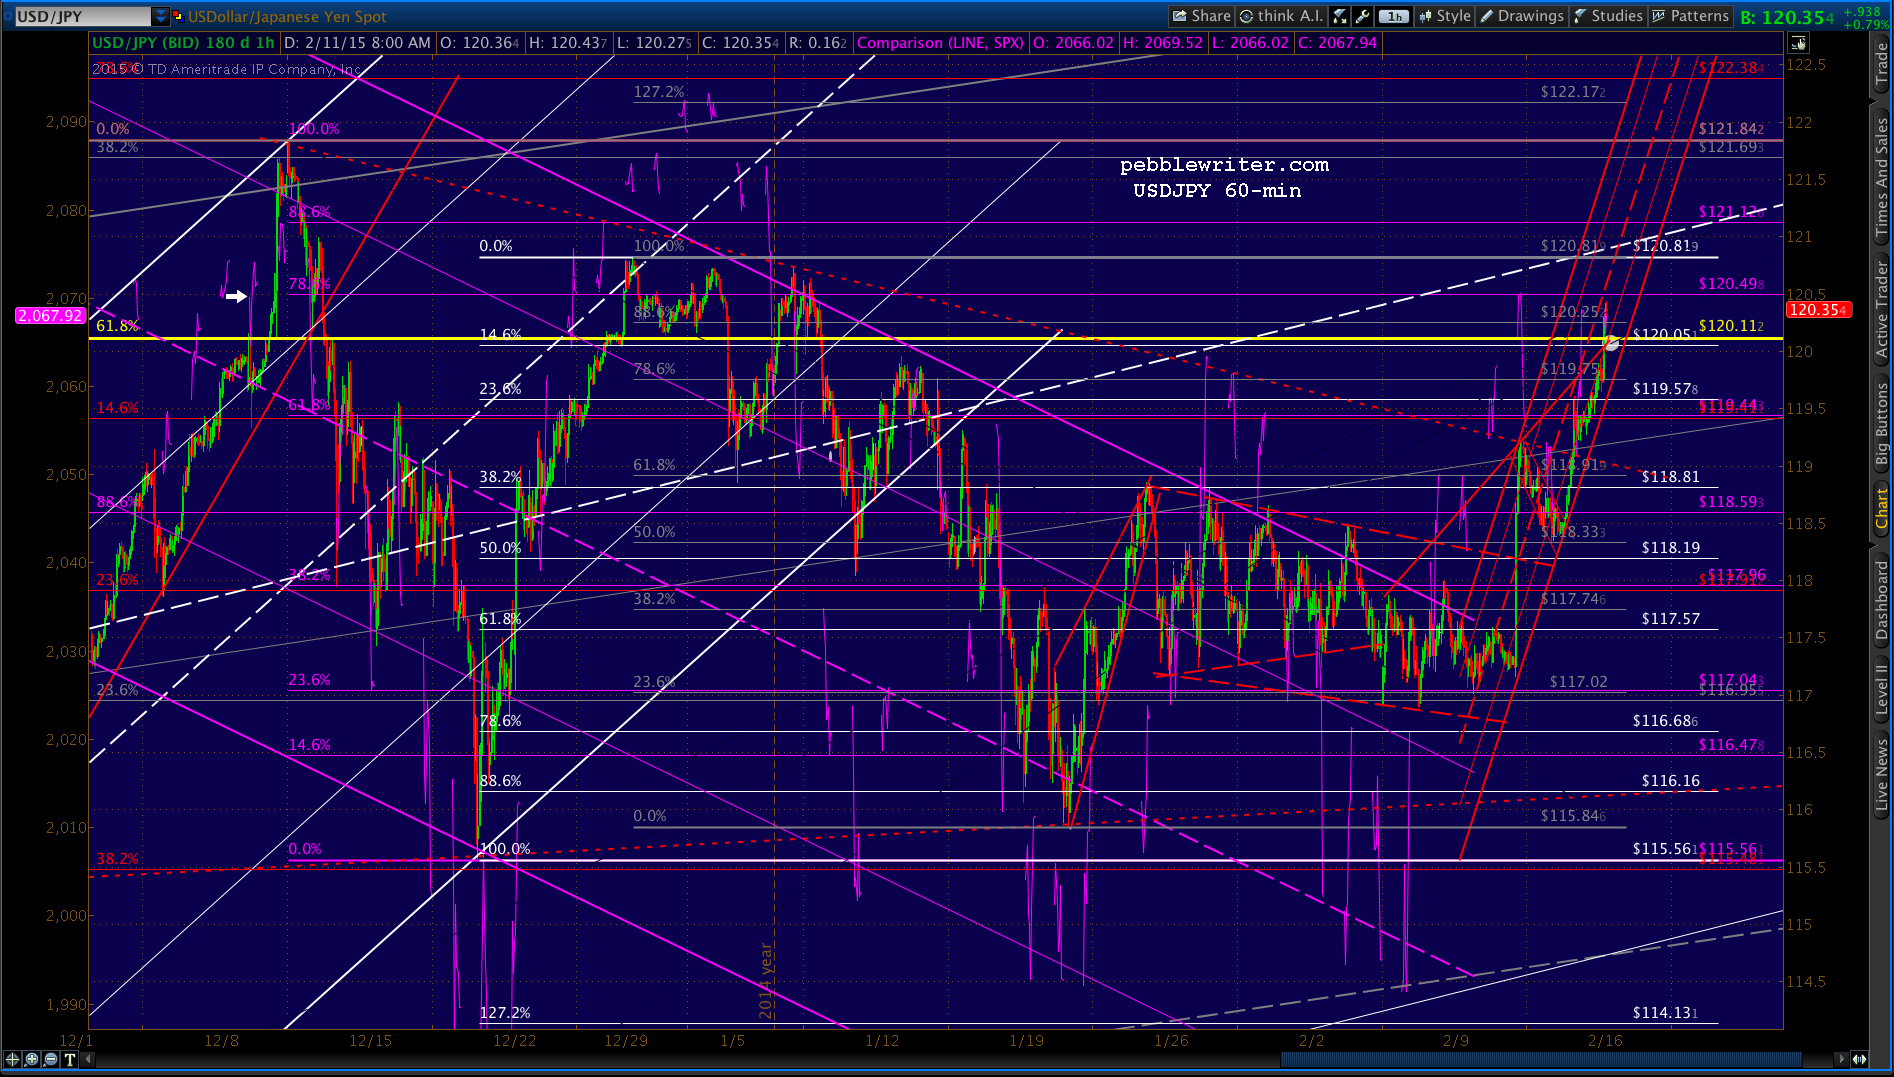 I think it’ll probably go up and slightly exceed 121.84 (the Dec 23 high) in order to establish a series of higher highs and higher lows. It might well fall back at that point, but the (technically) bullish pattern would have been established.
It would help a lot if CL could put in a strong backtest of the rising white channel, or at least break out of the falling red channel. Note the reversal at the red .886 Fib.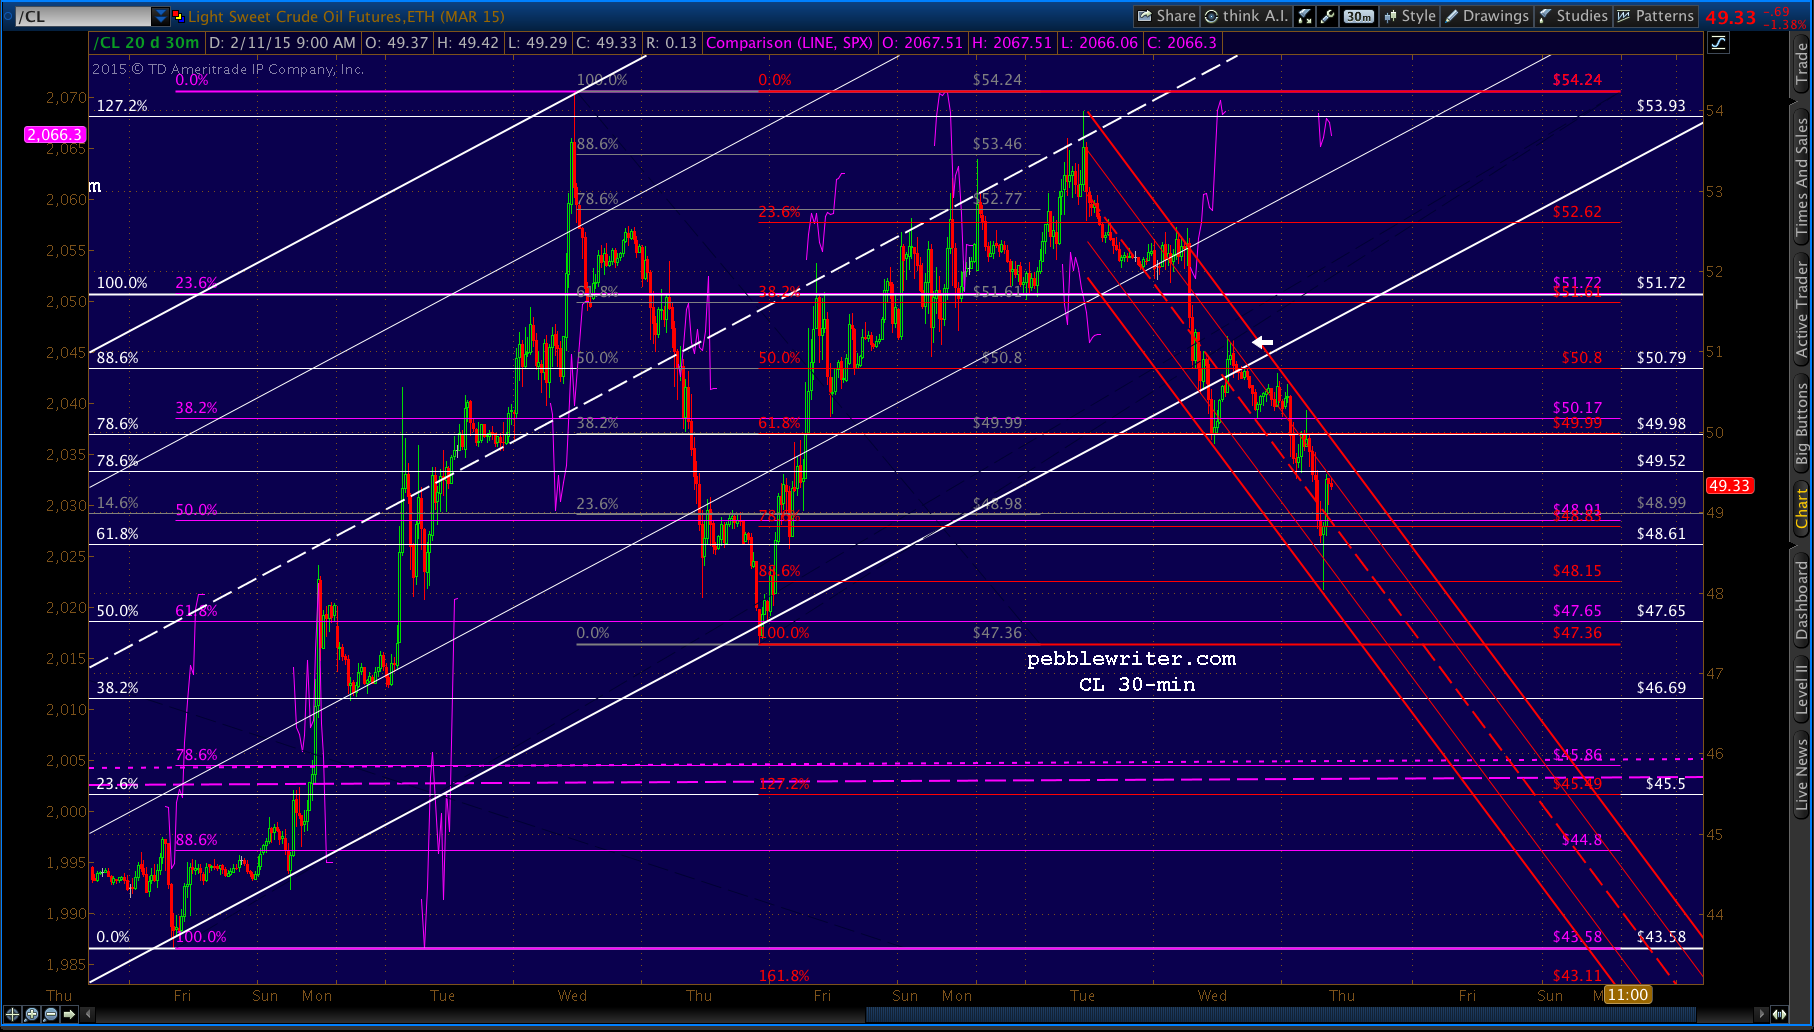 Interesting Zerohedge article about the spoofing that took place in WTI yesterday around 18:14 EST — an effort to regain the lost channel, shown above for CL in white.
UPDATE: 1:30 PM
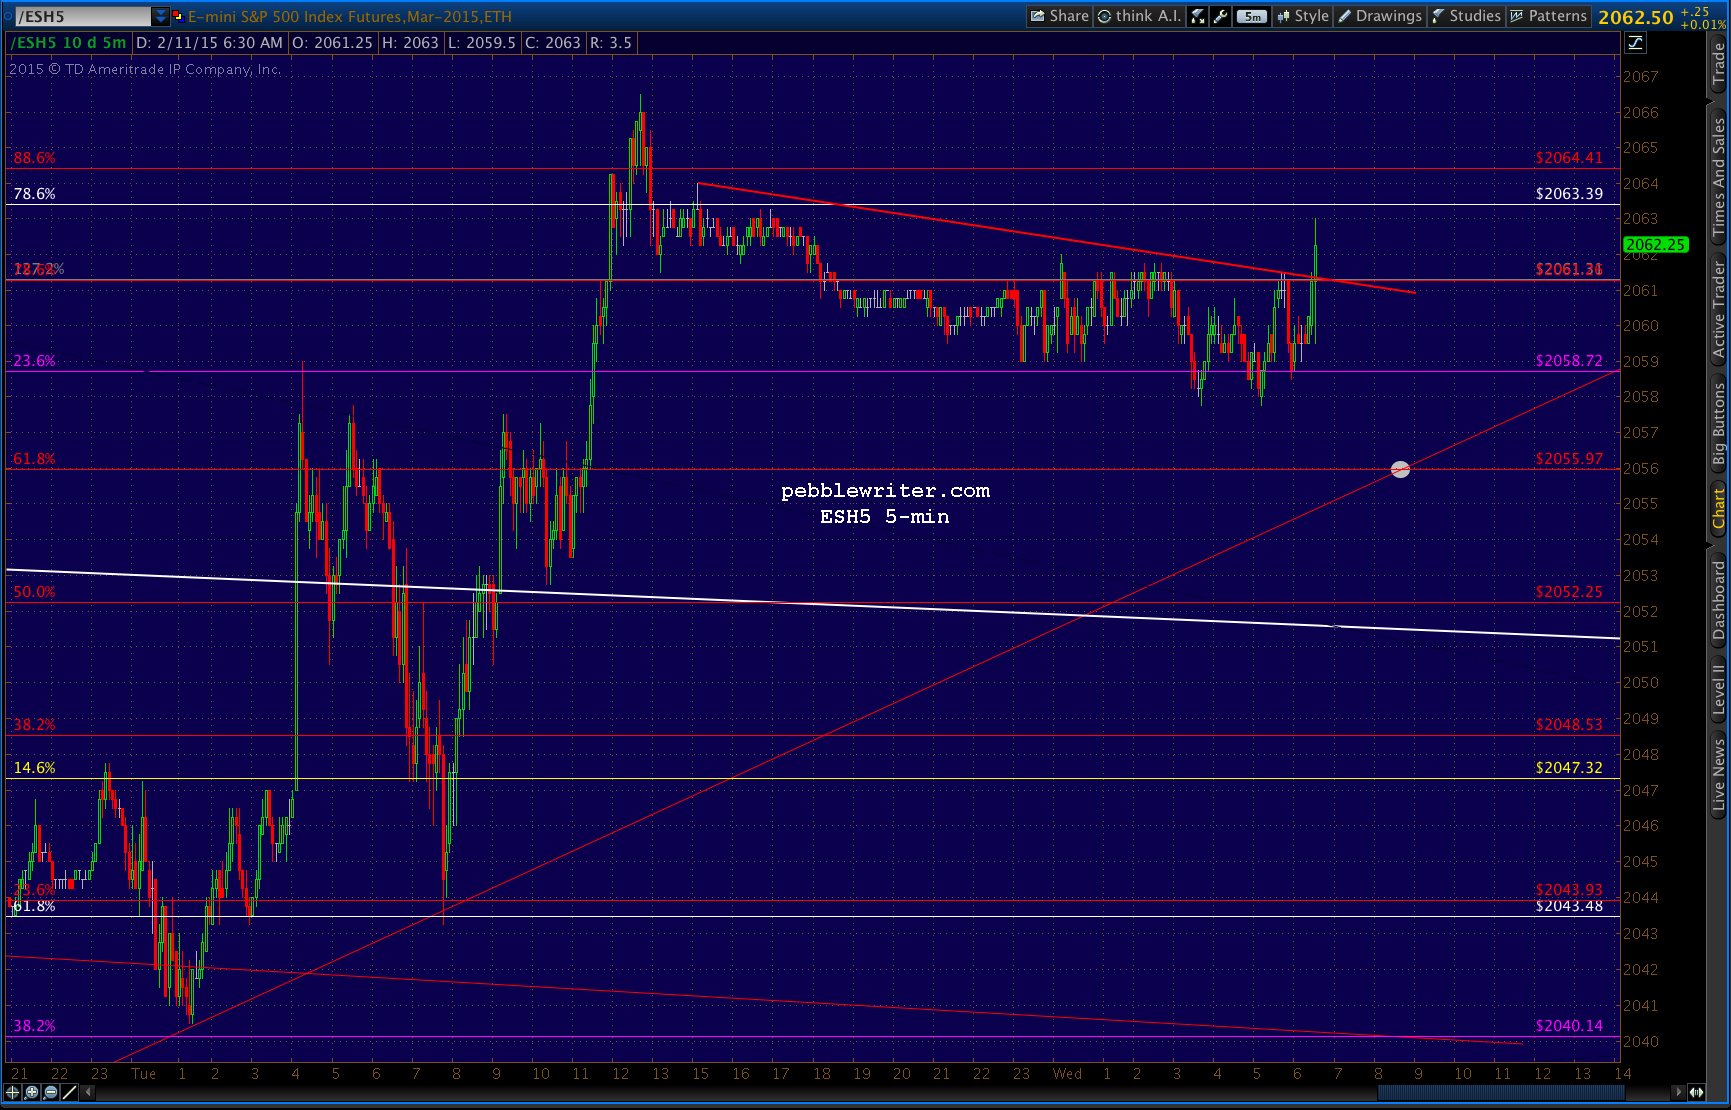
SPX just tagged our initial yellow target (I had been uncertain as to when it would happen, so drew two yellow targets this morning.) I’ve moved the upside red target over to tomorrow morning, and added a the purple dot at 2053.54 as a potential downside target.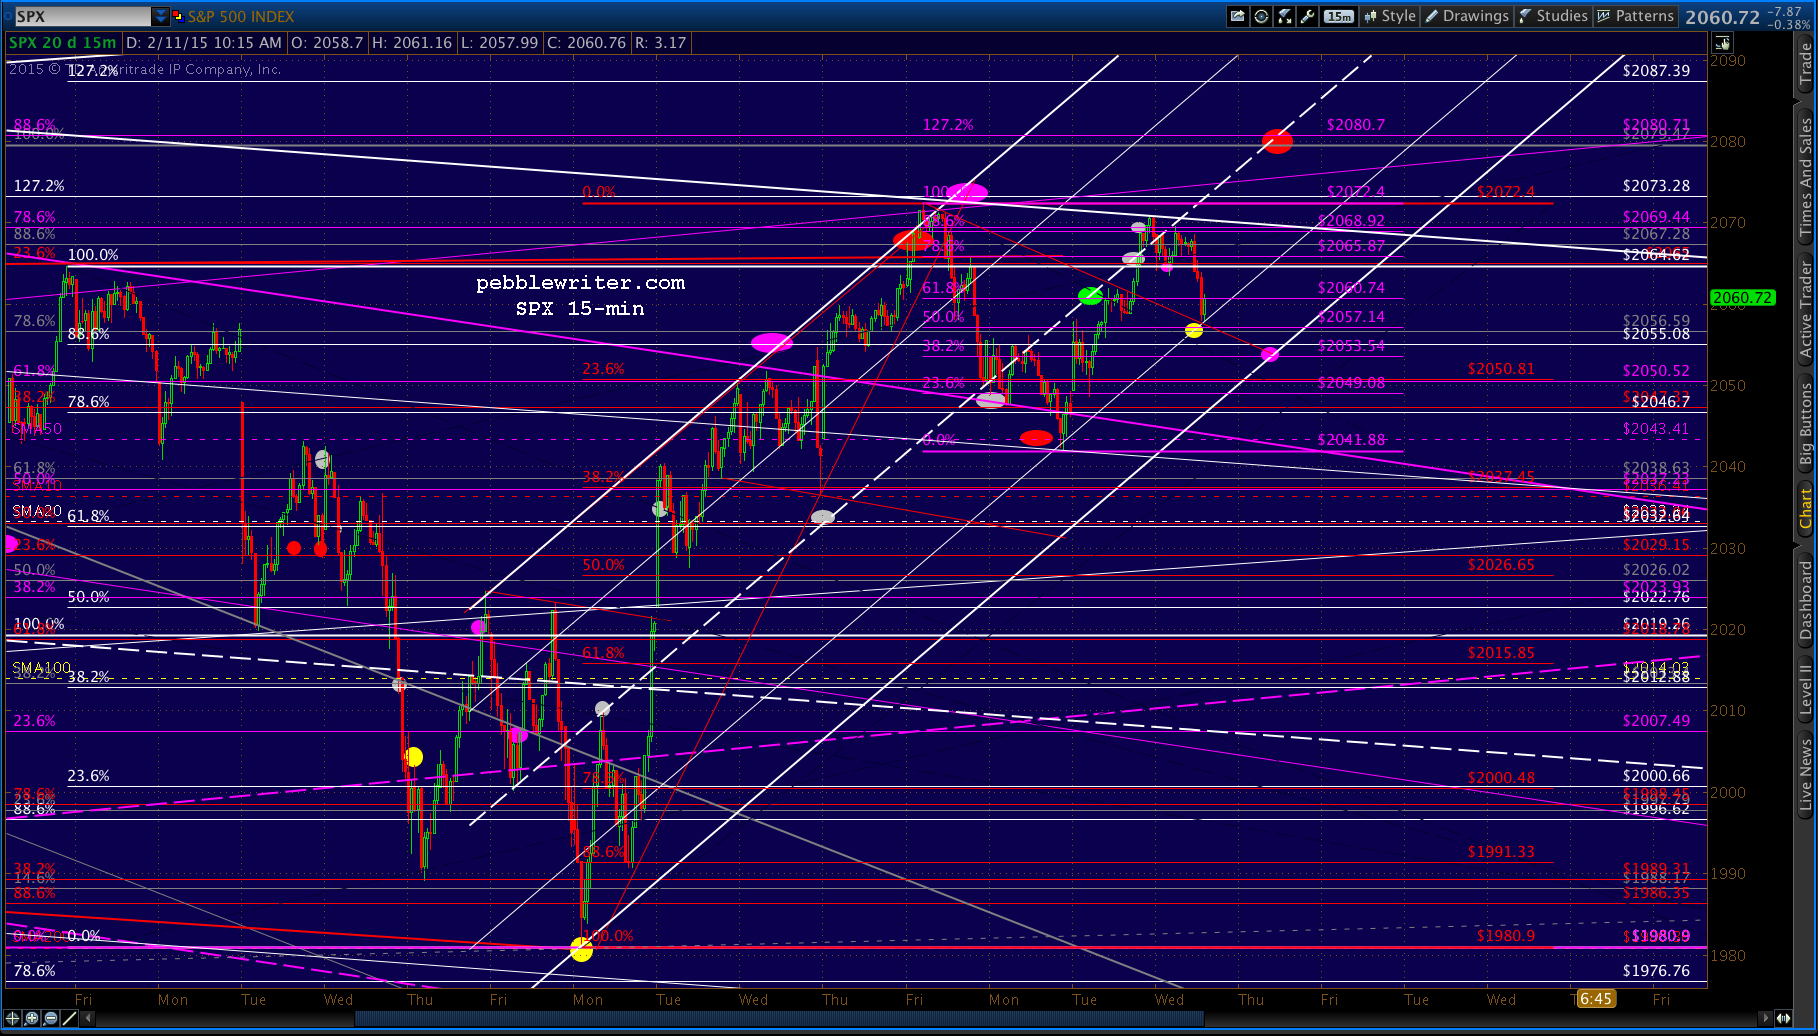 I don’t see it as very likely, but it all depends on what ES, CL and USDJPY do at this juncture. ES is backtesting the broken TL we drew this morning.
 While CL tried, but failed, to break out of the falling red channel.
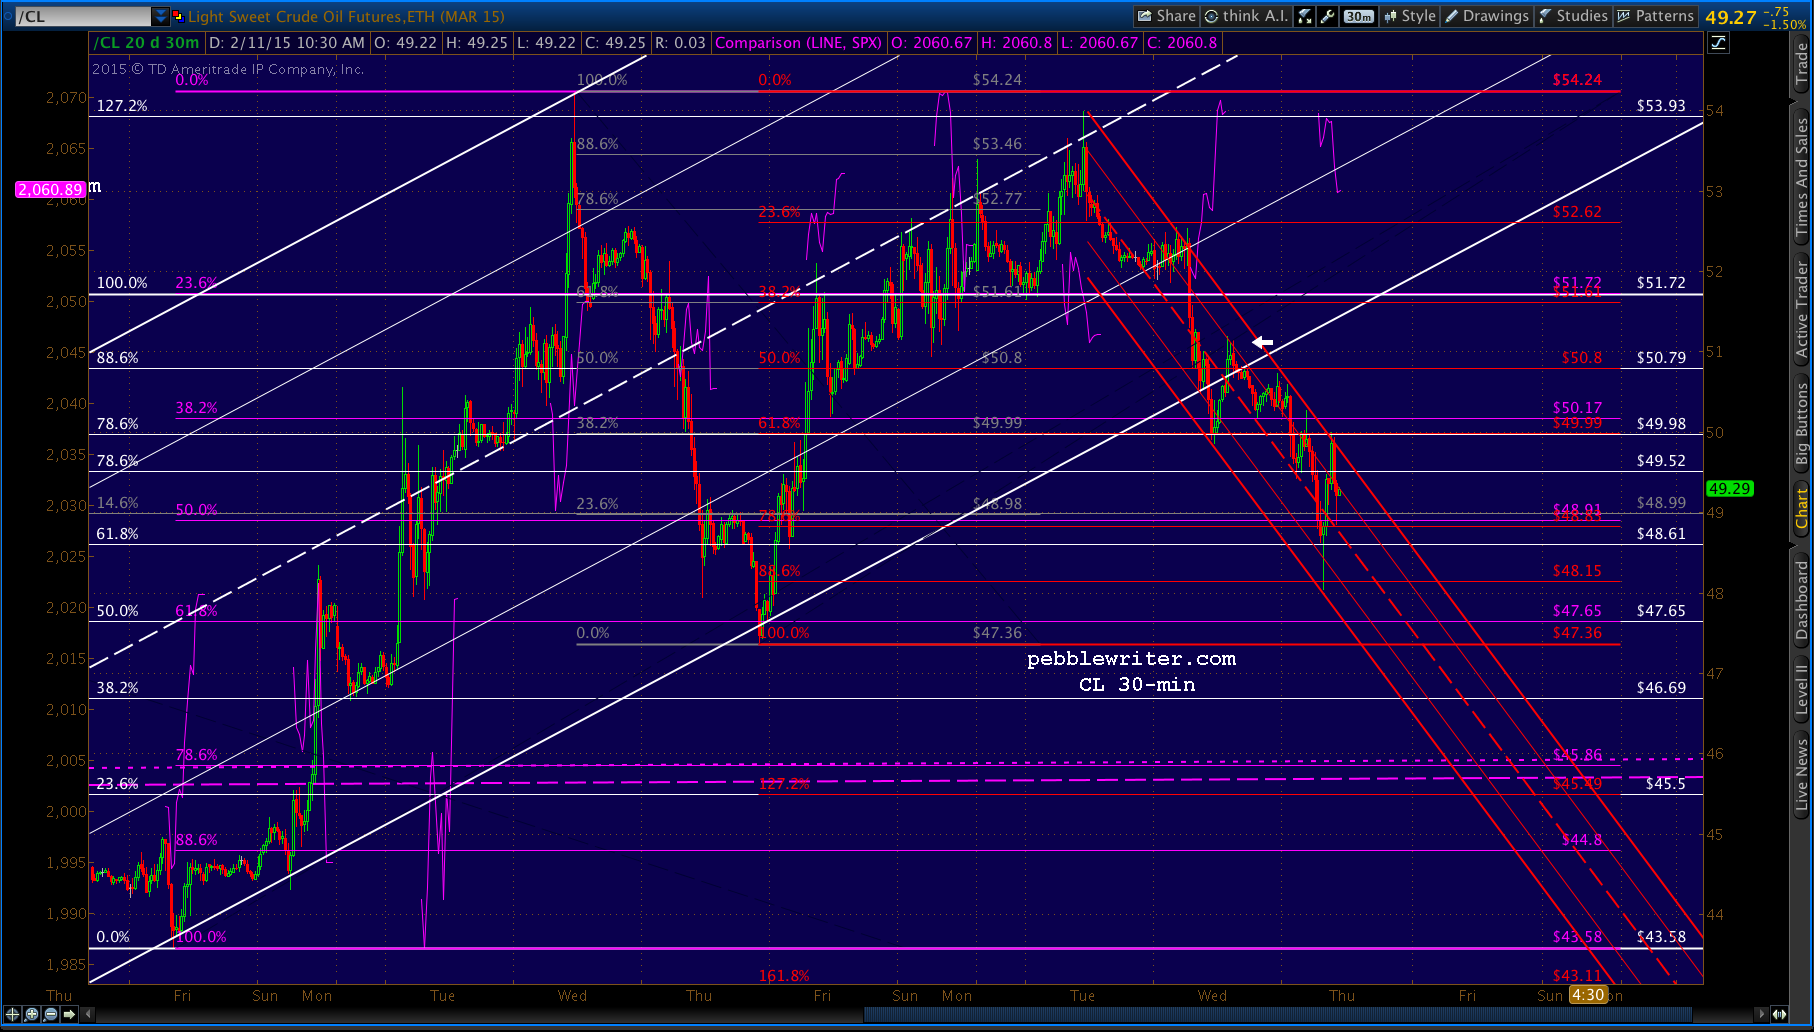 And, USDJPY is attempting a backtest of the broken yellow .618. My best guess here is sideways through the cash close, and then a drop overnight to 119.75, followed by a pop up through 120.82.
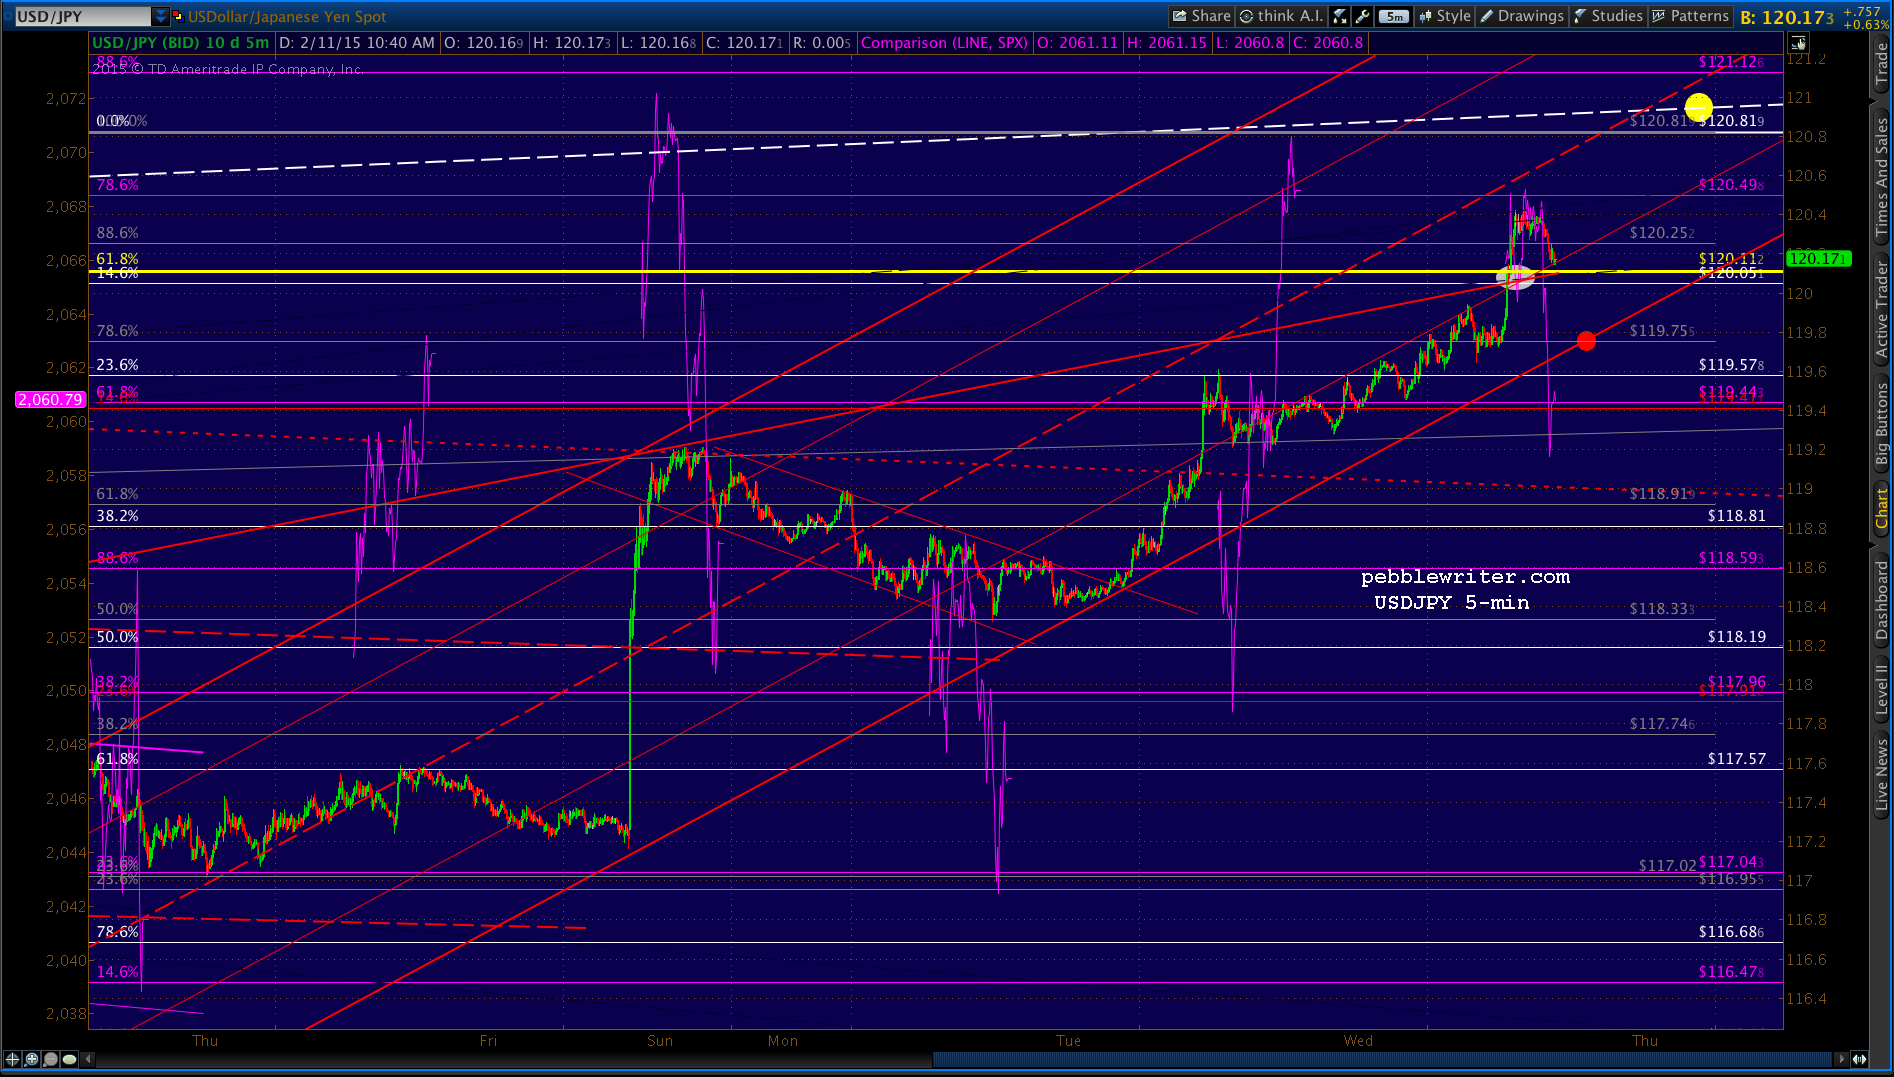 But, I’m very open to the idea of a ramp into the close today. The key will be whether or not USDJPY holds 120.11.
GLTA.