
Posts

  • Visualizing Whirled Peas

    Last night, I attended a very enjoyable holiday get-together at which I was probably the only technical analyst among a hundred or so quants.  After solving the problems of nuclear proliferation and ensuring that the paintings in the room were perfectly level (who says finance guys don’t know how to party?) the discussion got down to forecasting.

    I greatly admire quants’ ability to chuck billions of data points into the Veg-o-Matic and spit out statistical relationships that baffle those of us with normal-sized brains. Who knew sunspot frequency mattered so much?

    But, we humble chartists do have one advantage: our emphasis on visual  perspective, which greatly facilitates pattern recognition and interpretation.

    That’s a fancy way of saying we look at stuff and see patterns.  It helps enormously if you’re slightly Aspergerry, like yours truly.

    Now, if you’re one of those folks who believe markets follow a random walk and are free from interference, price fixing, manipulation, etc…well, God bless.  Being a cynic, I look for explanations that go beyond the CNBC headlines.

    So it was with our post this past April: Oil & Gas, Inflation and Interest Rates: A Delicate Balance or goal Seeking? In presenting dozens of tedious charts illustrating the historical relationships, I attempted to forecast the future path of, well, all that stuff.

    Our basic premise was that oil and gas prices were rising, which made equity algos happy but goosed inflation to the point that interest rates were becoming problematic.  The 10Y had risen from a low of 1.34% in Jul 2016 to nearly 3%.  The 2Y had risen from 0.56% to 2.56%.  Interest-sensitive sectors were starting to feel the pain.  The 2s10s, which had peaked near 290 bps in 2011, was screaming toward a negative number — which tends to signal recessions.

    I suspected oil and gas prices would be driven down, one way or another.  My suspicions were confirmed the very next day by Trump himself when he tweeted the first of his five missives on high oil prices.

    The fastest and easiest way to bring interest rates back down would have been to ask the Fed to forget about that pesky inflation and put future rate hikes on hold.  Mr Trump tried this…to no avail.  After years of languishing below 2%, CPI was now pushing 3%.

    The second fastest and easiest way was to bring inflation down.  As the chart below shows, the fastest way to do this was to crash gas prices.

    I know, those of my fundamental analysts friends whose feathers just got ruffled, that’s not how markets work.  But, my friend Richard Fisher and I will just agree to disagree with you.  We think that’s exactly how “markets” work when central bankers have their backs against the wall.

    What the Fed did, and I was part of that group, is we front-loaded a tremendous market rally starting in March 2009.  It was the Fed…the European Central Bank, the Japanese Central Bank…  all quantitative driven by central bank activity.  That’s not the way markets should be working… they were juiced up by central banks, including the Federal Reserve… I think you have to acknowledge reality.

    Richard Fisher, former FOMC member

    QE was an effective but expensive blunt instrument which saved stocks from ruin on many occasions.  Buying stocks directly is also effective, but can leave you in an equity trap – right BoJ?

    Nudging currencies, commodities and derivatives, which can trigger equity algos to go on a buying spree, is downright brilliant.  It’s relatively cheap.  And, with only 10% of trading volume attributable to fundamental, discretionary investors, these algorithmic nudges ripple out through index and quasi-index funds, ETFs and quantitative funds of all stripes.

    With the mid-terms fast approaching and interest rates on the rise, fast action was necessary. But, Trump’s tweets were working.  By October 3, oil prices had actually risen 10% since Trump’s first tweet.  OPEC, led by Saudi Arabia, wasn’t listening.

    Then, Trump was presented a gift.  Saudi journalist and critic Jamal Khashoggi was butchered, apparently by Prince Mohammed bin Salman’s henchmen who flew in for the occasion from Saudi Arabia…as in leader of the OPEC pack Saudi Arabia.  The uproar created instant leverage for a certain politician who was, say, in a position to defend MBS.

    Isn’t it fascinating that the very day these headlines hit the wires, oil and gas began a precipitous decline? As we illustrated in October in Coincidences and Consequences:, Khashoggi’s brutal murder top-ticked oil and gas prices and kicked off a 37% slide which hammered CPI, which had reached 2.95% in July, to November’s 2.18% announced today.

    The drop in inflation will only serve to bolster Trump’s argument that additional rate hikes are unnecessary and give the FOMC cover should they decide to sit on their hands next week.

    If higher interest rates are the problem for equities, are lower interest rates the solution?  There, things get a little tricky.

    On Monday, SPX reached the neckline of a large Head & Shoulders pattern we’ve been watching for the past couple of months.  In the old days, when markets weren’t “juiced up by central banks,” completion of a H&S Pattern kicked off big declines.  So did death crosses, the passage of the 50-day moving average below the 200-day as occurred last Thursday.

    These days, a death cross and an arrival at a H&S neckline is much more likely to mark an important bottom — hence the 100-pt bounce in the past two sessions.  But, can the US dollar continue to appreciate if the rate hike narrative crumbles?  And, if the dollar declines, how would that affect equities?  Time to hold on to your hat.

    continued for members… (more…)

  • Update on DJIA: Dec 11, 2018

    In our last update on the Dow, we noted that it had not only fallen through an important trend line but its SMA200 as well. From All Good Things on Oct 11:

    DJIA is flirting with breaking below a long-term trend line and SMA200.  A failure here opens the door to 23781, another 6.2% lower.

    Two months after the breakdown, DJIA is indeed flirting with the 2.24 extension at 23781.  Like SPX, it has completed a Head & Shoulders Pattern as well as a Flag Pattern.Also, like SPX, it came up just shy of its .886 Fibonacci retracement yesterday (23881 vs 23781.)

    The big question, then, is whether it’s done or whether it’s simply preparing for a more dramatic plunge.

    continued for members… (more…)

  • Surprised? Not Really.

    SPX completed the H&S Pattern yesterday, and dipped to within 4 points of the white .886 retracement for good measure.  As we wrote yesterday, several things needed to happen in order for the H&S to play out:

    For a breakdown, we’d want to see VIX break out and not retreat from the red TL.  We’d also want to see USDJPY reverse course and the dashed red TL break down. Ideally, we’d also see CL break down.

    VIX did not break out, but got hammered at the same exact same trendline which has cut short the last four rallies.USDJPY bounced at the red TL and, for good measure, broke out above the latest TL of resistance.  And, CL didn’t break down. And, while SPX’s subsequent bounce ran out of juice at a point of overhead resistance at the close, the algo drivers have been at it again this morning.  Futures are up another 30 points.

    The pols have thrown fuel on the fire by suggesting (yes, again) that the trade situation has improved.  But, this morning’s PPI report hints at lingering inflation and interest rate problems.  As expected, energy went a long way toward turning down the heat.  But, PPI still came in hot.As such, all the talk about fewer rate hikes in 2019 must be questioned.  Alternatively, oil needs to drop even further.  Neither option will get the bulls where they want to go.

    continued for members… (more…)

  • The Big Picture: Dec 10, 2018

    This has been one of the more satisfying years since I first began writing pebblewriter 7 1/2 years ago.  Yes, our forecasts have been accurate. But, it was even more gratifying that the themes we identified earlier in the year (oil’s collapse, interest rates topping out, CPI tumbling, etc.) played out as expected.  They were excellent guideposts to equities’ outcome.

    In short, it’s been a trader’s market.  A buy-and-hold investor would have a 40-point loss (as of Friday’s close) to show for all her sleepless nights.  A trader who simply paid attention to the 200-DMA and the Fib extension, on the other hand, would have done much, much better.

    By accurately anticipating the moves in currencies, oil and gas, interest rates and VIX, which are instrumental in driving the algos which determine so much of each session’s outcome, we have been on the right side of most of the moves – correctly identifying most of the major turning points.

    Since futures reached our next downside target last night, we’re faced with another such opportunity.If SPX had simply held 2703 in October, or even tagged our 2579 target around the election as we forecast two months ago [see: All Good Things], it would have had a decent chance of continuing higher after a bounce to 2800.But it bounced prematurely, and in coming back to tag the right downside target is threatening to complete (ES already has) a large, bearish Head & Shoulders Pattern.  Here’s that same chart from Oct 11 with the interim price action filled in.

    So, what’s it going to be?  The usual stick save, or a 380-pt plunge?

    continued for members… (more…)

  • Update on COMP: Dec 7, 2018

    Don’t look now, but COMP is approaching our 6760 target.  As we discussed on Oct 10 [see: Plan B] COMP faced significant downside if its 200-DMA didn’t hold.

    Bottom line, it didn’t.  It was off as much as 13.3% last month before beginning a bounce that was destined to fail.  Next week, it will get another chance at tagging some meaningful support around 6760-6800 – depending on whether it happens Monday or later in the week.

    Members will recall we had two near misses on the 200-DMA in Feb and April, followed by a breakout that defied logic.  Now, two months after it broke down through the important moving average, COMP has been laid low.

    Can it hold here, or will AAPL’s continuing meltdown drag it even lower?

    My 144.48 target for AAPL remains unchanged since Nov 14, the day it broke below its SMA200 [see: When Push Comes to Shove.]  Then……and, now.

    Stay tuned.

  • New Fed, Same Old Mandate

    Look no further than the Fed for the confusion reigning on Wall Street.  It was only a few weeks ago that they were preparing us for multiple rate hikes, as we were far from the neutral rate.  Then, the story shifted, indicating we were just below the neutral rate.  Yesterday, they leaked a story to the Wall Street Journal that they were gravitating toward a wait-and-see approach.

    The problem isn’t that the Fed can’t make up its mind.  The problem is that the current Fed, just like its predecessors, is data dependent.  And, the data they depend on is the stock market.

    There’s no mystery regarding the timing of the leak.  The S&P 500 had fallen 179 points in two sessions.  It was about to undergo a death cross, as the futures did this morning. Even worse, it was within a few points of completing the Head & Shoulders pattern we’ve been watching develop over the past month.In the end, ES and SPX came within 10 points of our next downside targets before promptly reversing course.  SPX came within a point of closing its gap from earlier in the morning.  The question, now, is whether the coast is clear.

    As usual, we’ll watch the algo inputs closely.  VIX reversed at our next upside target rather than breaking out.And, USDJPY enjoyed a timely bounce at our next downside target.   Even CL and RB are surging sharply.  Will it be enough to keep the rally going after the gap is closed?  Don’t be so sure.

    continued for members… (more…)

  • The Yield Curve’s Warning

    NOTE:  The Dec 6 post is combined with this one from yesterday.  All targets remain unchanged from last week.

     *  *  *

    Technical analysis encompasses a wide array of indicators — sentiment, flow, volume, open interest, moving averages, momentum, chart patterns and Fibonacci patterns.  Many fundamental analysts disparage the practice, but begrudgingly dabble when a signal is compelling enough.

    Much has been written about the yield curve’s ability to forecast recessions — which sometimes helps one forecast markets. Many pundits seem to regard an inversion of the 2s10s as a sign of an impending correction — pointing to the current spread of 15bps with some alarm.

    But, as we’ve discussed many times, it’s the rapid spike in the 2s10s following an inversion that is highly correlated with the biggest equity collapses of the past 20 years.It’s a good model, but not a perfect one.

    In 2000, the yield curve low of -0.52 came on April 7, two weeks after SPX topped out.  By the time it reached 0.0 in January 2001, SPX had fallen 19%.  SPX bounced 8% over the next month or so.  But, as the 2s10s topped its 1999 highs, SPX’s troubles began anew.  It plunged 45% by October 2002, two months after 2s10s reached its 2002 high of 2.37.

    Again, good but not perfect.  If spiking 2s10s produced corrections, why did stocks top out well before the 2s10s bottomed out and well before it spiked higher?  And, why did stocks bottom out in October even as the 2s10s continued higher until July 2003?

    The 2007-2009 crash presented similar problems with the model. 2s10s inverted in January 2006, but bounced around between -0.19 and +0.21 until July 2007.  SPX didn’t top out until October 2007, at which point the 2s10s had already risen to 0.66.

    SPX’s subsequent 58% collapse was nicely correlated with 2s10s.  But, again, the fit was far from perfect and there were numerous head fakes.

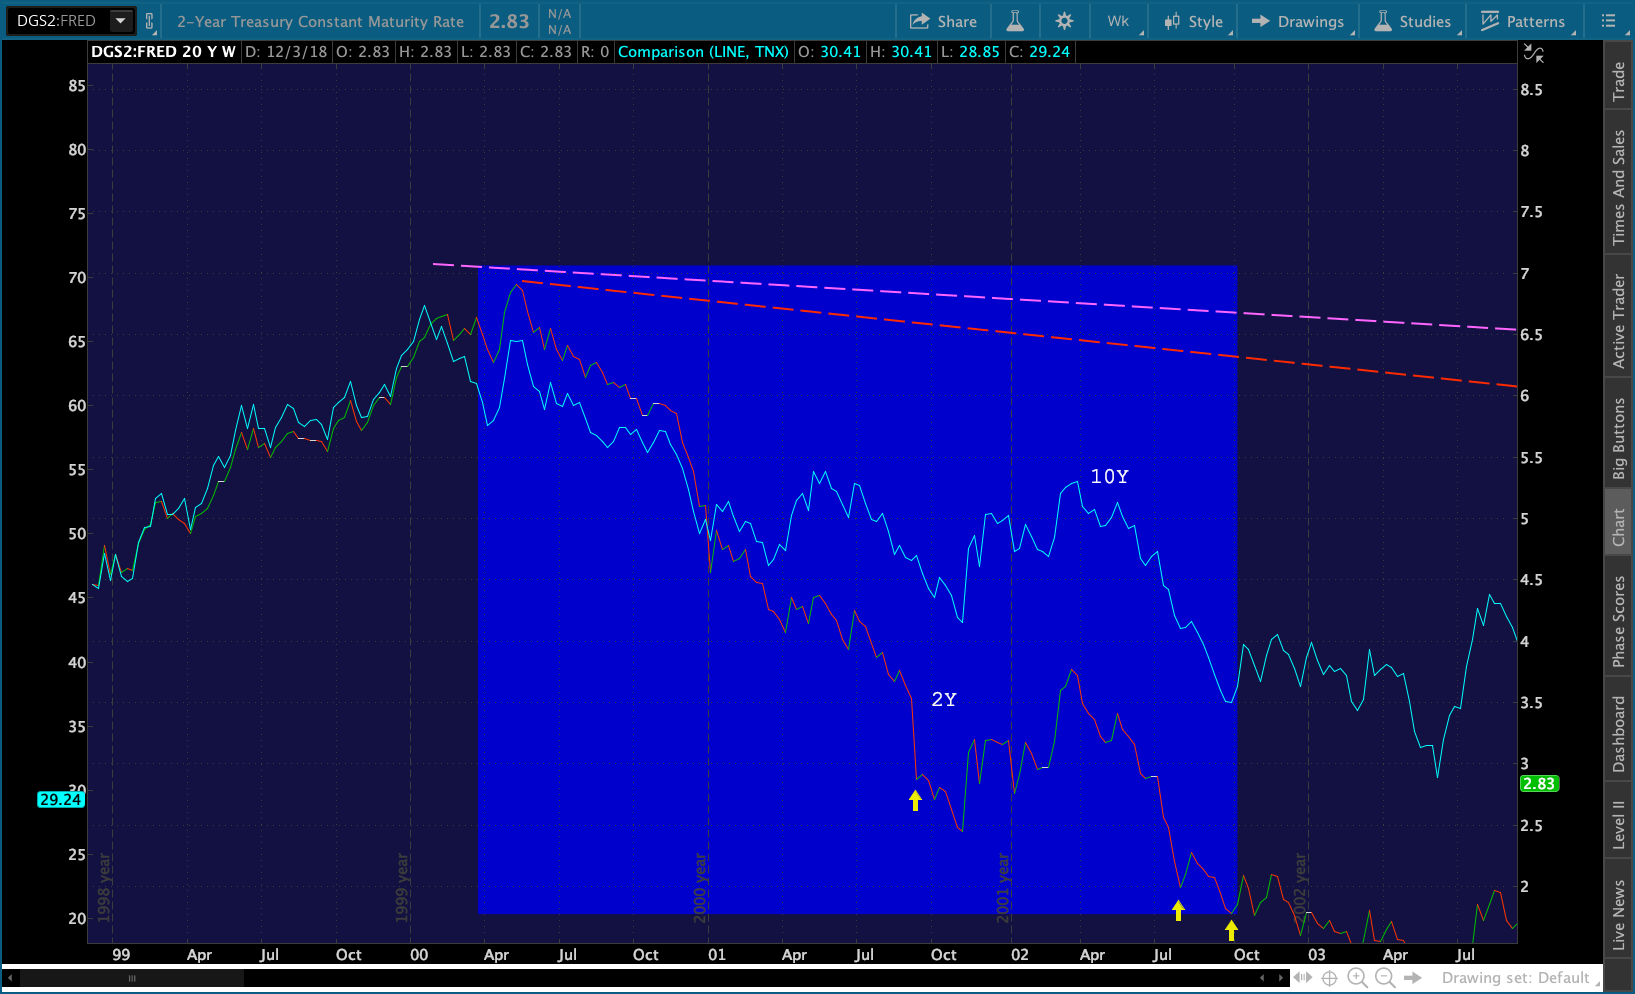
    An examination of the 2Y and 10Y side by side in 2000-2002 shows that the sharp spike in 2s10s was primarily due to the relatively faster drop off in 2Y yields.  And, the sharpest drops in 2Y yields (the yellow arrows) matched up nicely with some of the sharpest drops in SPX.The same thing happened during the 2007-2009 crash.

    The model thus becomes more robust: be wary of sharp rises in the 2s10s accompanied by sharp declines in the 2Y. But, it still doesn’t offer as much certainty as to timing as I’d like. And, as we discussed in our first post on the yield curve last year [see: Should You Fear the Yield Curve?] there have been other significant equity declines which were accompanied by sharp drops in the 2s10s.

    Several additional posts over the past year have further developed the model, revealing several very interesting nuances that address both issues.  It has helped me pinpoint numerous interim turning points, including the recent 184-pt drop [see: Nov 9 Update.]

    The basic rules can be observed on the chart below.  The colors refer to the arrows.(1) Bounces off trend lines (TLs) of support (purple, yellow) are generally bullish.
    (2) Breakouts above TL of resistance (red) are bearish.
    (3) Breakdowns below TLs (yellow and red) and horiz. support (white) are bearish.
    (4) Reversals at TLs of resistance (green) are bullish.

    Following these rules would have yielded the following long/short decisions between December 2017 and April 2018.

    a. Dec 5, Dec 15 and Jan 3 – long
    b. Jan 29, Feb 1 – short
    c. Feb 9 – long
    d. Mar 12, Mar 28 – short
    e. Mar 29, Apr 17 – long
    f. Apr 19 – short

    Let’s overlay SPX and see how the model did.  The shaded areas are the periods during which the model signaled a long position.  The unshaded areas indicated shorts.

    A buy and hold strategy between Dec 5 (a) and Apr 19 (f) would have yielded a 64-pt or 2.4% gain.  While going long and short per the model (based on closing prices) would have yielded a 1,110-pt or 42% gain.

    There was one period when 2s10s bounced back above the white TL when signals were definitely mixed. But, since SPX was bouncing along atop its 200-DMA, it wasn’t tough to decipher the correct signal.

    This was also clearly a period of extraordinarily large moves higher and lower.  So, the value of the signals was much greater than might otherwise have been the case.  Let’s take a look at the more recent case — between July 13 and the present.

    A buy and hold strategy would have yielded a 101-pt or 3.6% loss.  The model, applying only the broad strokes, would have generated 740 points, or 26.4%.  And, since 2s10s just fell through horizontal support on Tuesday, there’s likely more downside ahead.

    The yield curve model is only one component of our overall analysis.  And, the above both oversimplifies its application and understates its value.  Combined with the other tools I use every day, it’s contributing to a banner year.


    continued for members… (more…)

  • The Latest Tipping Point

    Yesterday’s targets are still intact with the exception of USDJPY, which broke down in order to accommodate SPX’s SMA200 backtest.If this is a garden variety backtest, the bears have nothing to get excited about other than a nice 50-pt short trade.  Note that the last time USDJPY broke down, however, it turned into a 190-pt drop.  So, watch closely as SPX approaches 2762 (ES 2764) — ideally around 10:30AM.  Yesterday’s gap is slightly lower at 2760.88 (ES 2764.75.)Most of the attention this morning is going to the 2s10s yield curve, which is approaching inversion……as TNX approaches our downside target. If the SMA200s don’t hold, things will get very interesting very quickly.

    continued for members… (more…)

  • You Break It…You Buy It

    Suppose a neighborhood kid was seen deliberately throwing a brick through an expensive plate glass window in your home. Following a serious discussion with and full reimbursement from the kid’s parents, things might eventually get back to normal. If the parents are thinking straight, the little runt might even be responsible for working off the expense of the repair. But, you probably wouldn’t go around singing the kid’s praises.

    So it is with Trump’s trade war with China — except the window is still broken, the kid who broke it is blaming the brick for the damage, he’ll never have to pay for it, he’s going around bragging about how great it’s going to look when it is repaired, and the whole neighborhood is throwing him a big party because he promised not to throw any more bricks — at least for the next few months.

    Futures were up as much as 55 points earlier, and are still up 42 points (1.52%.)More importantly, important resistance will be broken on this morning’s gap higher. Is it time to celebrate?

    continued for members… (more…)

  • Be Careful What You Wish For

    The market isn’t even open yet, and already the administration is starting with the algo-inspiring messaging.  A China deal is imminent!  Actually, quite likely.  Well, there’s a decent chance…

    Playing this outcome is no better than a roll of the dice — which is why the VIX gamesmanship has already begun.  Note that ES’ two threatened dips below the 2.24 extension at 2728… …were promptly met with VIX smackdowns.  As Blondie would say, “one way or another.”Speaking of which…I went in yesterday for a simple extraction of a tooth which had been bothering me for quite a while.  It was time to think about an implant.

    The procedure ended up taking four hours, involving three oral surgeons, three assistants, a tech, and 22 injections.  Damn tooth had three roots, two of which were hooked at the end and refused to let go.  So, they essentially drilled the tooth out.

    I learned two important lessons from the experience.  First…brush and floss. Duh.  Second…some conditions which seem simple and straightforward can become excruciatingly complex in a hurry.  So it is with QE.

    Ten  years ago, when central bankers first delved into the suppression of interest rates and accumulation of trillions in assets, it probably seemed like a fairly simple way to protect the stock market and economy from ruin.  Now, the market hangs on every Fed utterance to find out when the party might truly be over.

    But, like tooth # 19, easy money is proving to be darned near intractable.  Consider the complex relationship between rates and the US dollar.Since the April-May equity plunges, DXY and TNX have been rising in lock step.  A strong dollar kept inflation under control while oil and gas prices soared.  Rising 10Y rates helped prop up the dollar, and kept the yield curve from inverting while the Fed worked the short end higher.

    It’s hard to say, but I imagine they didn’t anticipate the aggressive manner with which Trump attacked high oil and gas prices and interest rates.  With November CPI due to tumble, the 10Y is finally tumbling — which means the Fed must stop hiking or face a yield curve inversion.

    This has been the basis for our inflation and interest rate forecasts since mid-April [see: Oil & Gas, Inflation and Interest Rates: A Delicate Balance or Goal Seeking.]  In it, we forecast a sharp decline in oil and gas prices and a lid on interest rates and inflation.

    We also forecast that stocks would follow suit unless USDJPY angled higher and VIX came under attack.  Not surprisingly, all of these things have come to pass.

    Oil has plunged 35% from its recent highs.  The 10Y briefly punched above 3%, but is about to drop below it as the 2s10s lingers in the low 20s.  USDJPY, which plunged to 104 in March, is about to test 114 again.  CPI, which reached 2.95% in July, could test its 2.07% 2018 lows for November.

    Unless oil and gas suddenly spike higher or Trump’s tariffs are expanded, the Fed can’t justify further rate hikes.  The “market” is just fine with that.  Central banks can still buy stocks, hammer VIX, toy with the yen carry trade, etc.  And, politicians can still cut taxes so corporations have more money with which to buy back shares.

    But, it remains to be seen whether USDJPY can hold its uptrend in the face of stable or declining interest rates.Remember what happened the past couple of times USDJPY threatened to break down.

    continued for members… (more…)