This little article on Reuters caught my eye this morning.
 Japan’s new Prime Minister Fumio Kishida noted that a weaker yen would exacerbate Japan’s spiraling wholesale prices (+6.3% last month.)
Of course, the weaker yen – a result of the yen carry trade – is a big reason why stocks are so high. 
As we’ve discussed many times in the past, the trade has its limits. When the yen weakens significantly at the same time that oil/gas prices are rising rapidly, something has to give.
Otherwise, you end up with untenable price increases…
 …which lead to untenable inflation…
 …which in turn lead to untenable interest rates (in Japan, anything above 0%.)
 Now, Japan’s bond market is even more broken than the US bond market. The journey to NIRP has been going on for a long, long time.
  Given Japan’s 272% debt to GDP ratio, it’s been necessary.
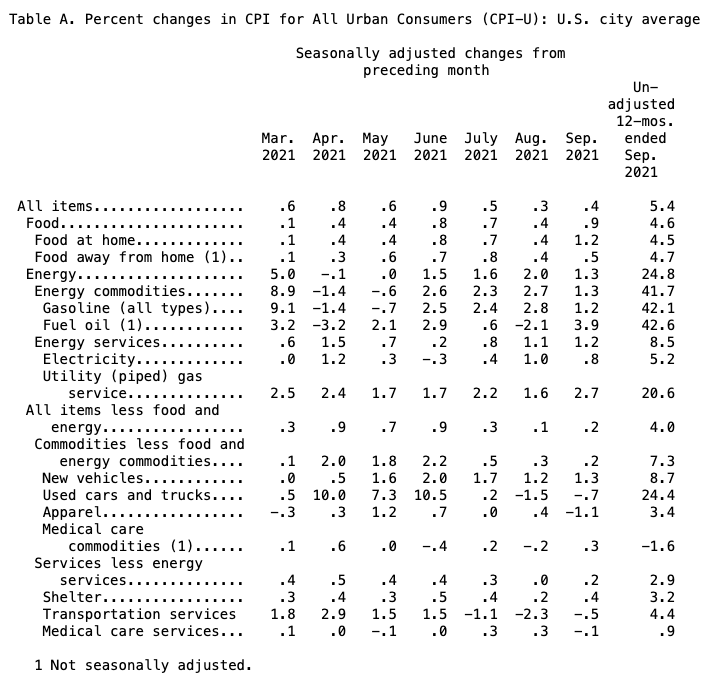
 [The US is expected to exceed that ratio by 2029, but I digress.] The last time Japan’s producer prices increased this rapidly was in 2014…
 …when CPI also neared 4%. It wasn’t a good look for a central bank which required negative interest rates in order to avoid the appearance of technical default.
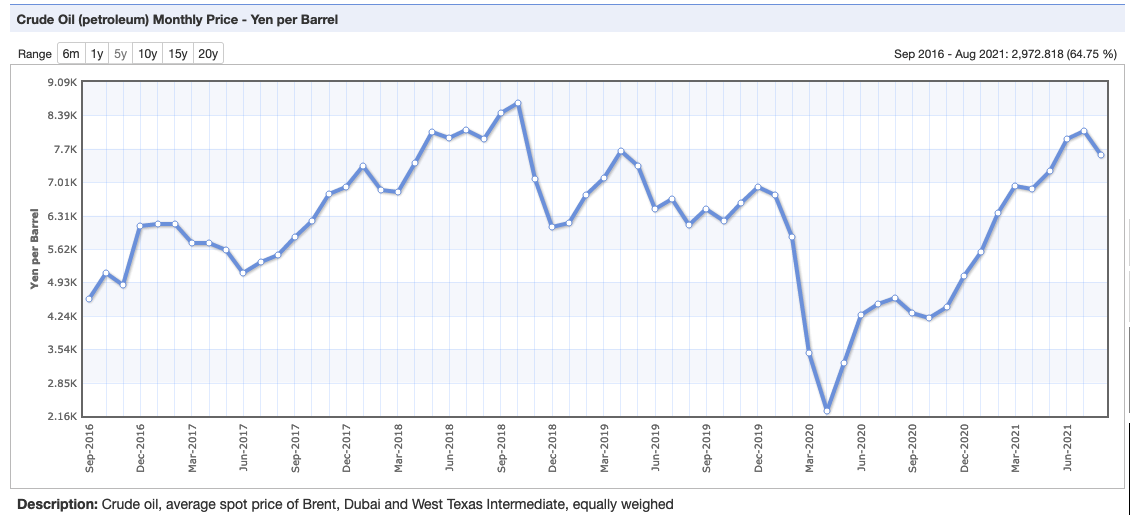
 Then, as now, it was largely a function of sharply rising oil prices. Clearly, oil prices needed to come down.
  But, how could they do that without killing off the rally from 2011’s Fukushima lows? Easy. The yen carry trade, which had helped the Nikkei almost double in the two years since Fukushima…
 …came to the rescue. Not coincidentally, USDJPY broke out on the exact same day that WTI broke down.
 The carry trade’s influence on the algos prevented crashing oil prices from also crashing stocks. And, cratering oil prices prevented the crashing yen from exacerbating inflation. It was a win-win. By the end of the 2014 CPI was down below 0%, 10Y yields were slashed in half, and the Nikkei had risen an additional 20%.
What if USDJPY hadn’t broken out to offset oil’s breakdown? We got a taste of that in October 2018 when oil/gas reversed lower following Jamal Khashoggi’s murder. WTI plunged 45% in a little over 11 weeks, while USDJPY shed about 8.7% and stocks swooned by 21%.
Why does this matter? We can see from the 10Y chart that rates are testing 0% again, even though the BoJ continues to suppress interest rates. It’s no wonder that rates are breaking out given that broad-based inflation is on the rise.
Rates are threatening to break out in the US and the euro zone as well.
 The most expeditious way to get inflation under control is to hammer oil/gas prices lower. But, how to keep stocks from following suit if, as PM Kishida intimates, the yen carry trade is off the table? How indeed.
continued for members…
(more…)


 It goes without saying that the uncooked numbers are much worse. Take this chart, for instance, comparing actual apartment rental rates to the BLS’ fictional OER.
 Futures dipped back to UNCH on the news, looking as though they might even turn negative. But, the algos were transfixed by VIX’s daily pre-opening dip below its SMA200 and, well, we all know how that works.
 continued for members… (more…)