

Futures are up modestly as we approach the open. The primary equity factors – currencies, risk and oil – have all confirmed a clear path to our downside targets as soon as next week.
 continued for members…Our downside targets remain unchanged.
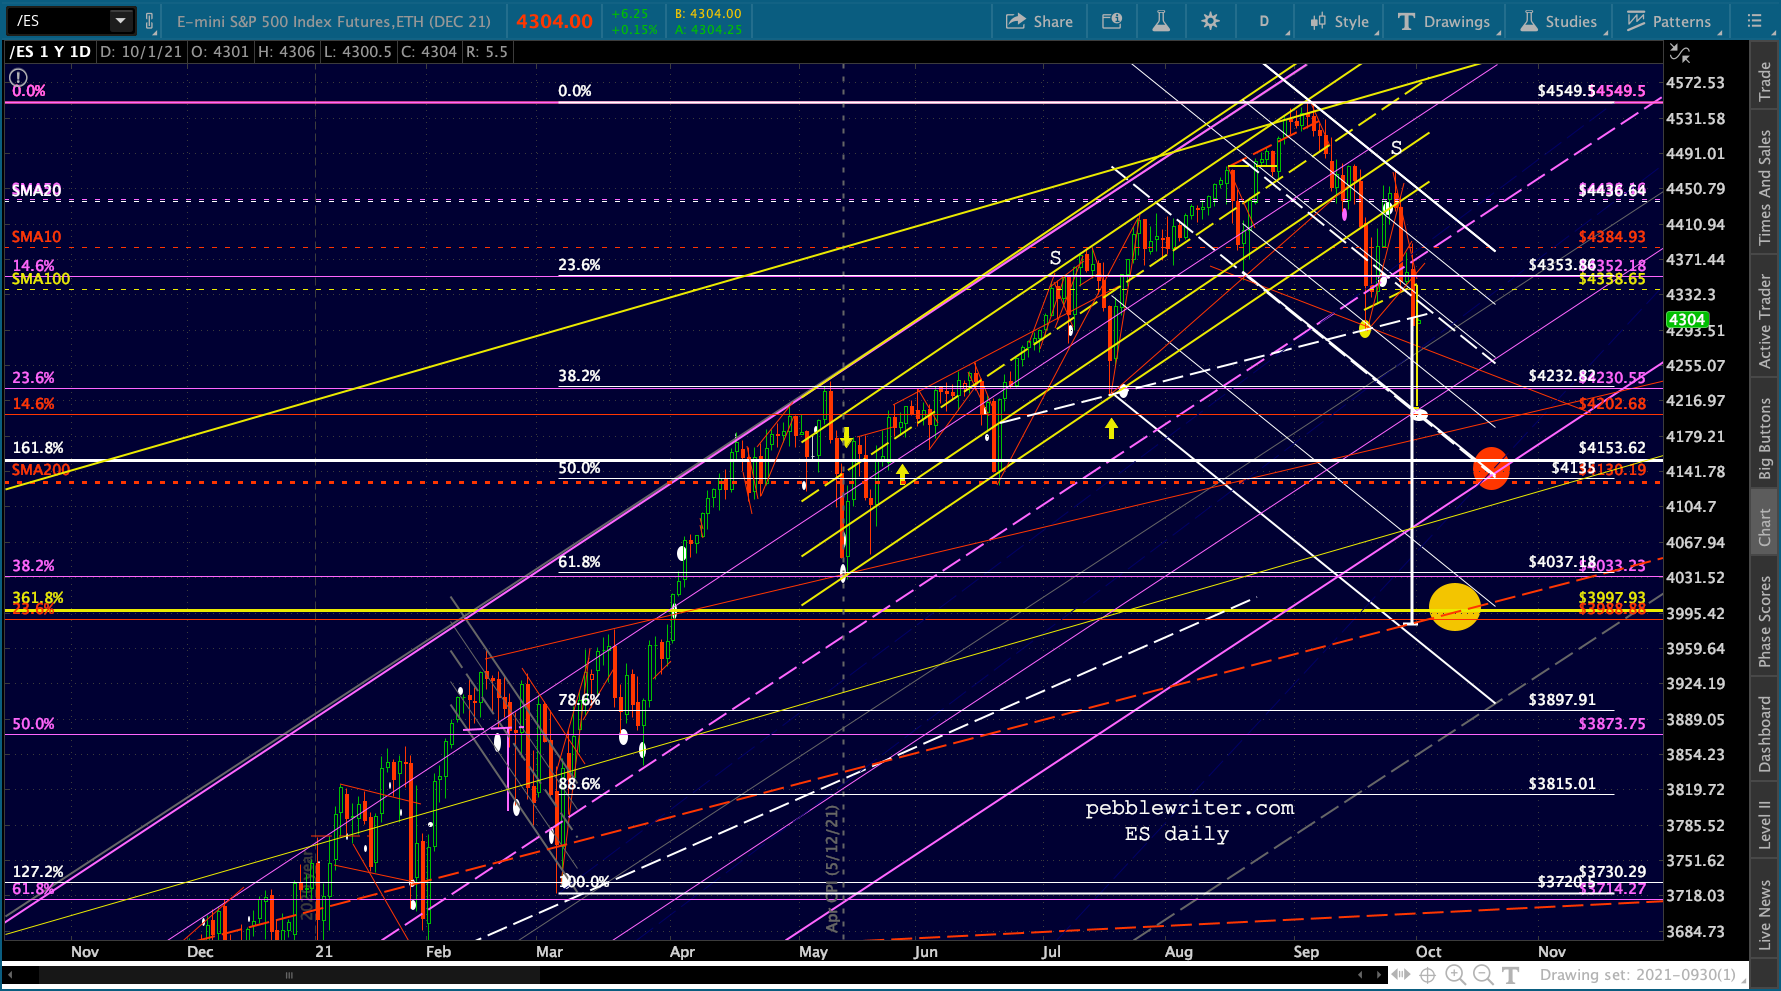
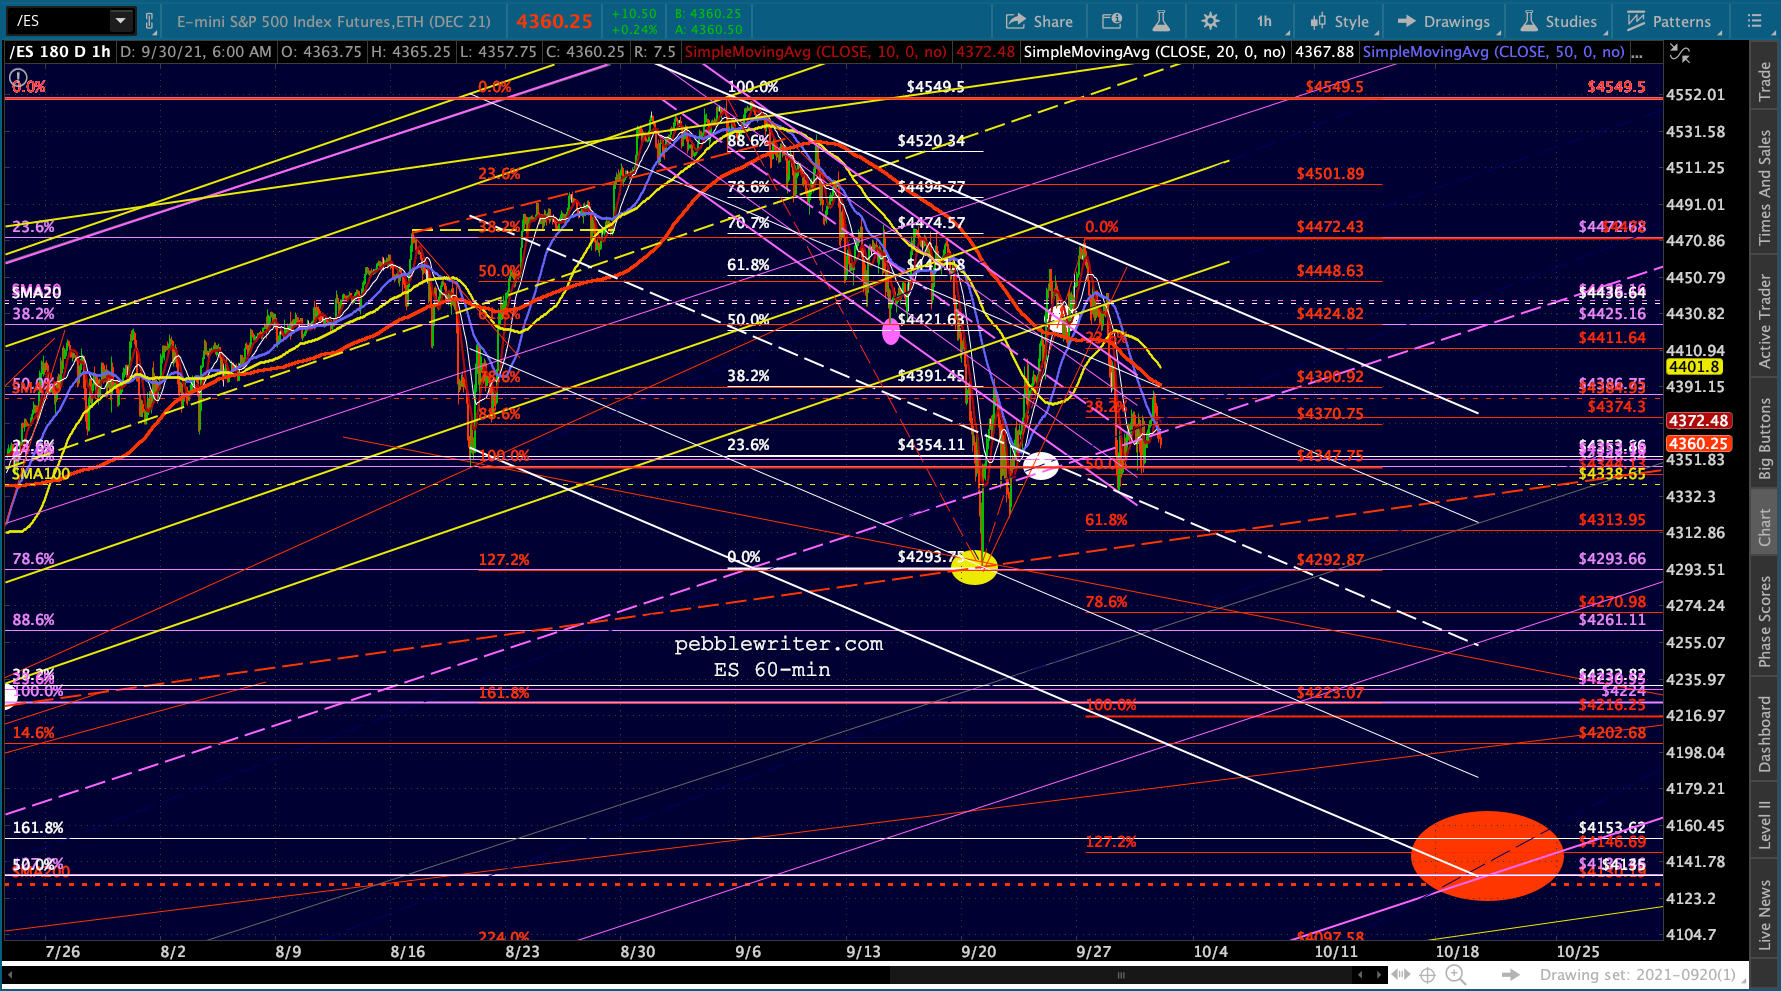 Note that we have a fairly well-formed H&S Pattern shaping up in ES which targets 4208.75. It intersects with the bottom of the falling white channel as soon as early next week, meaning a very sharp selloff could be in the cards.
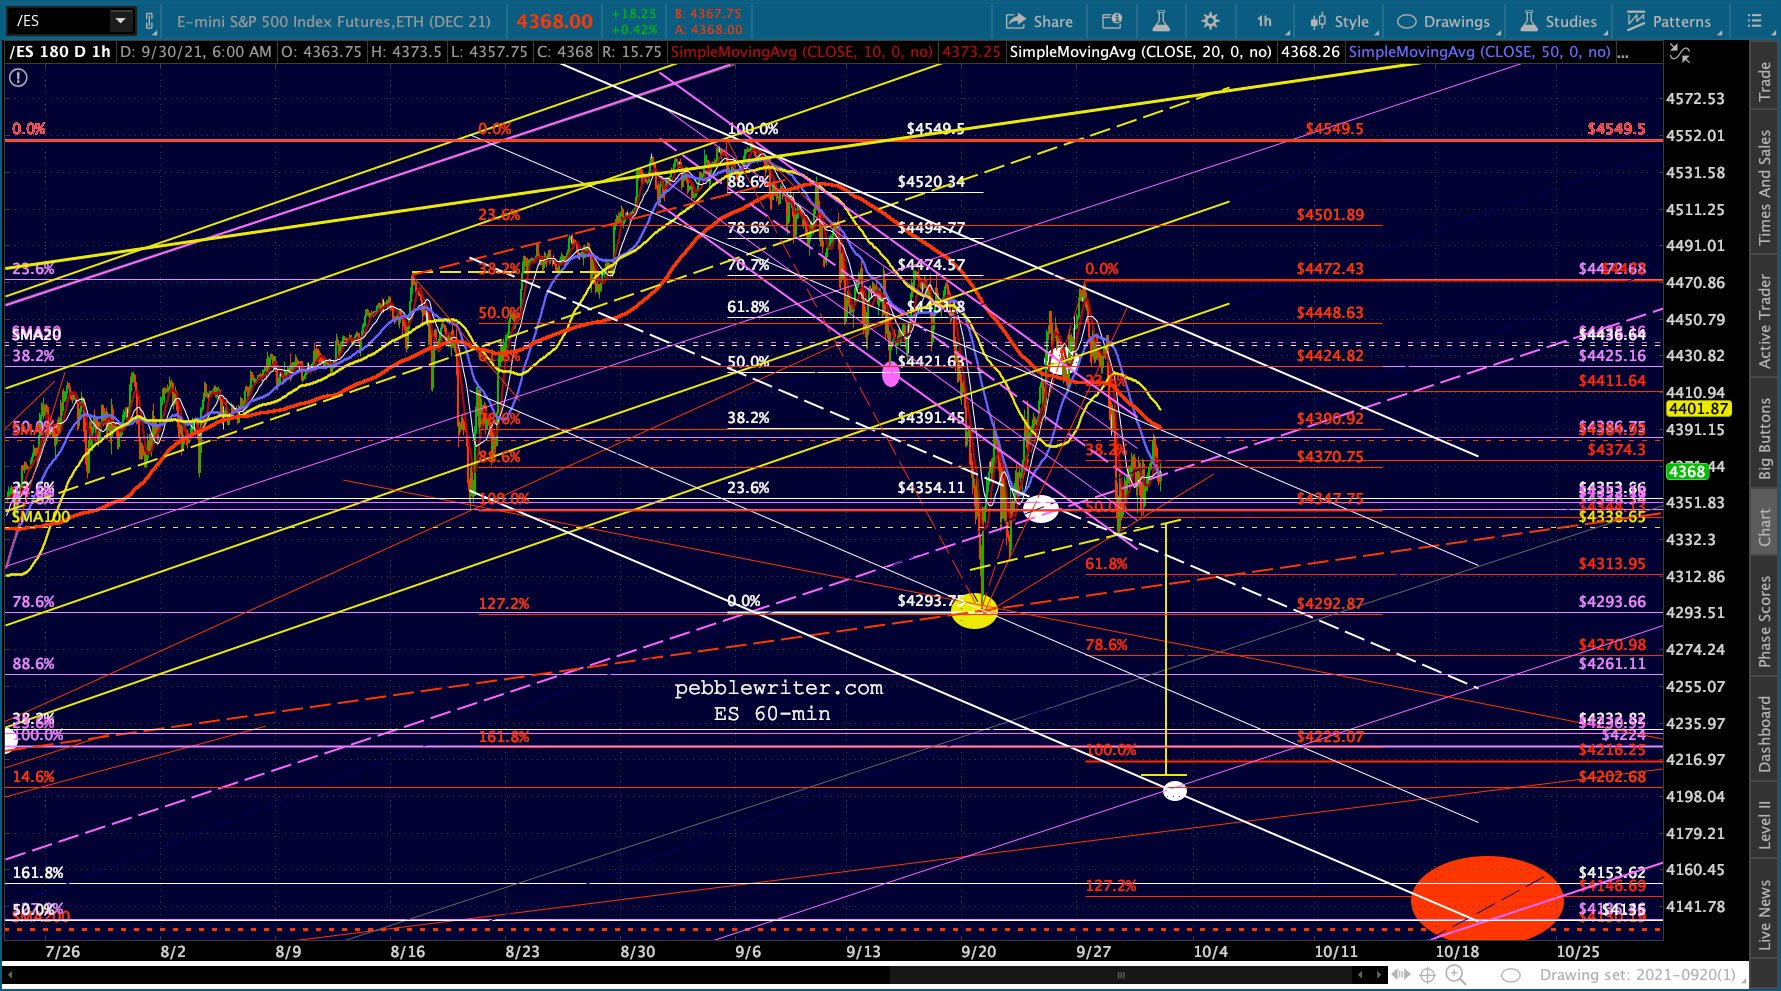
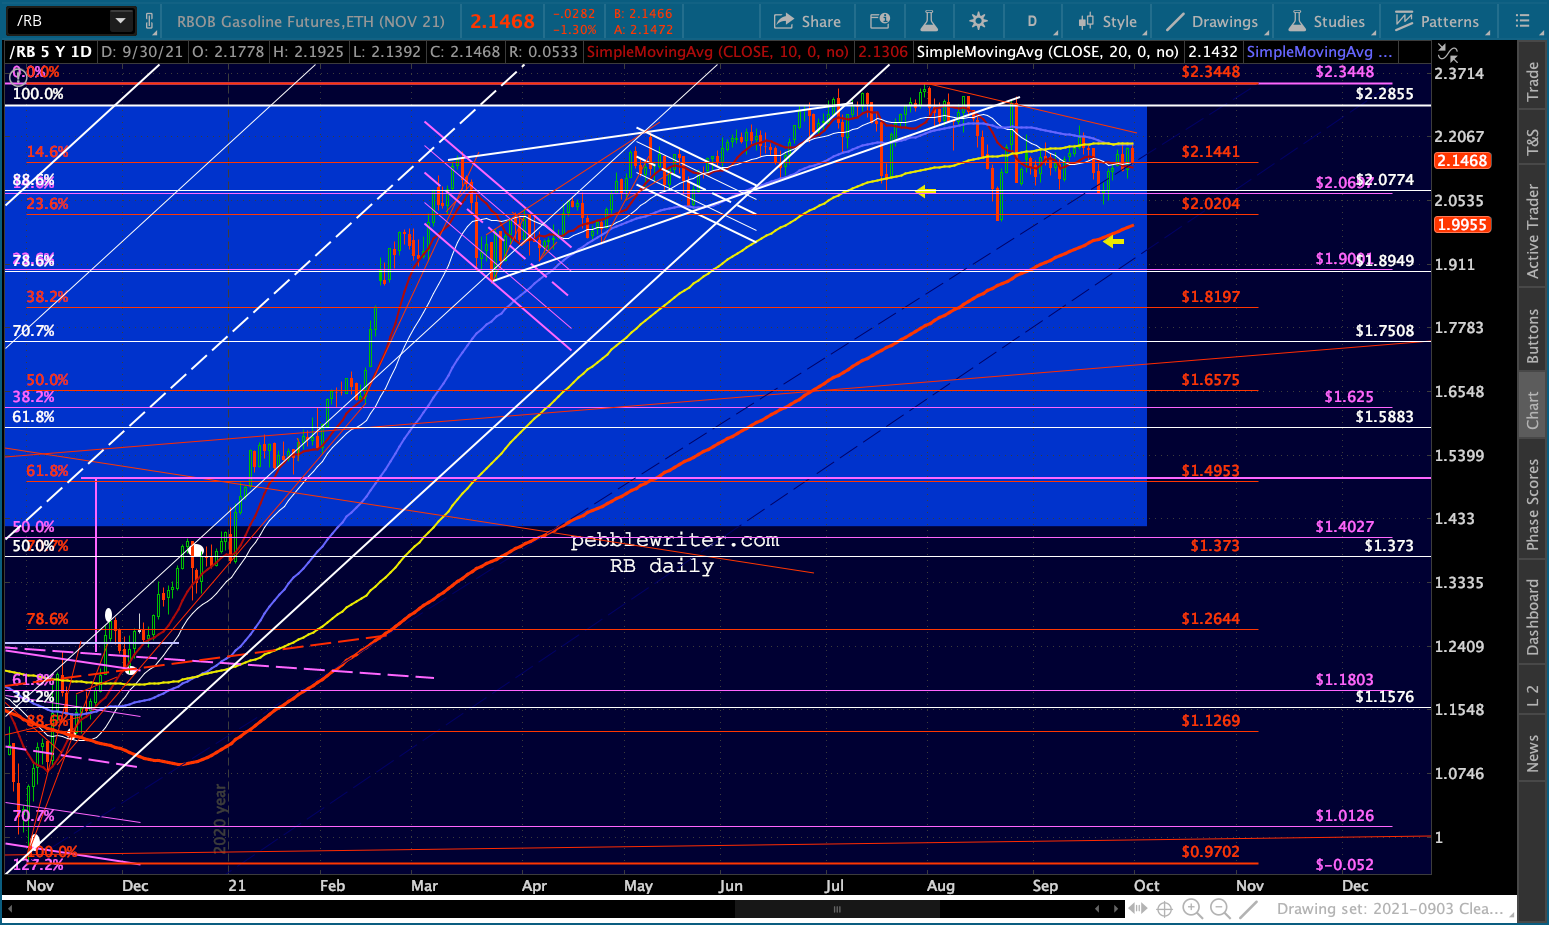
 Oil and gas continue to slip – just a little, but it’s a very different signal vs new highs. SMA200 support is getting very close. A slight decline – simply getting out of the way of stocks declining – is all it will take to facilitate a correction.
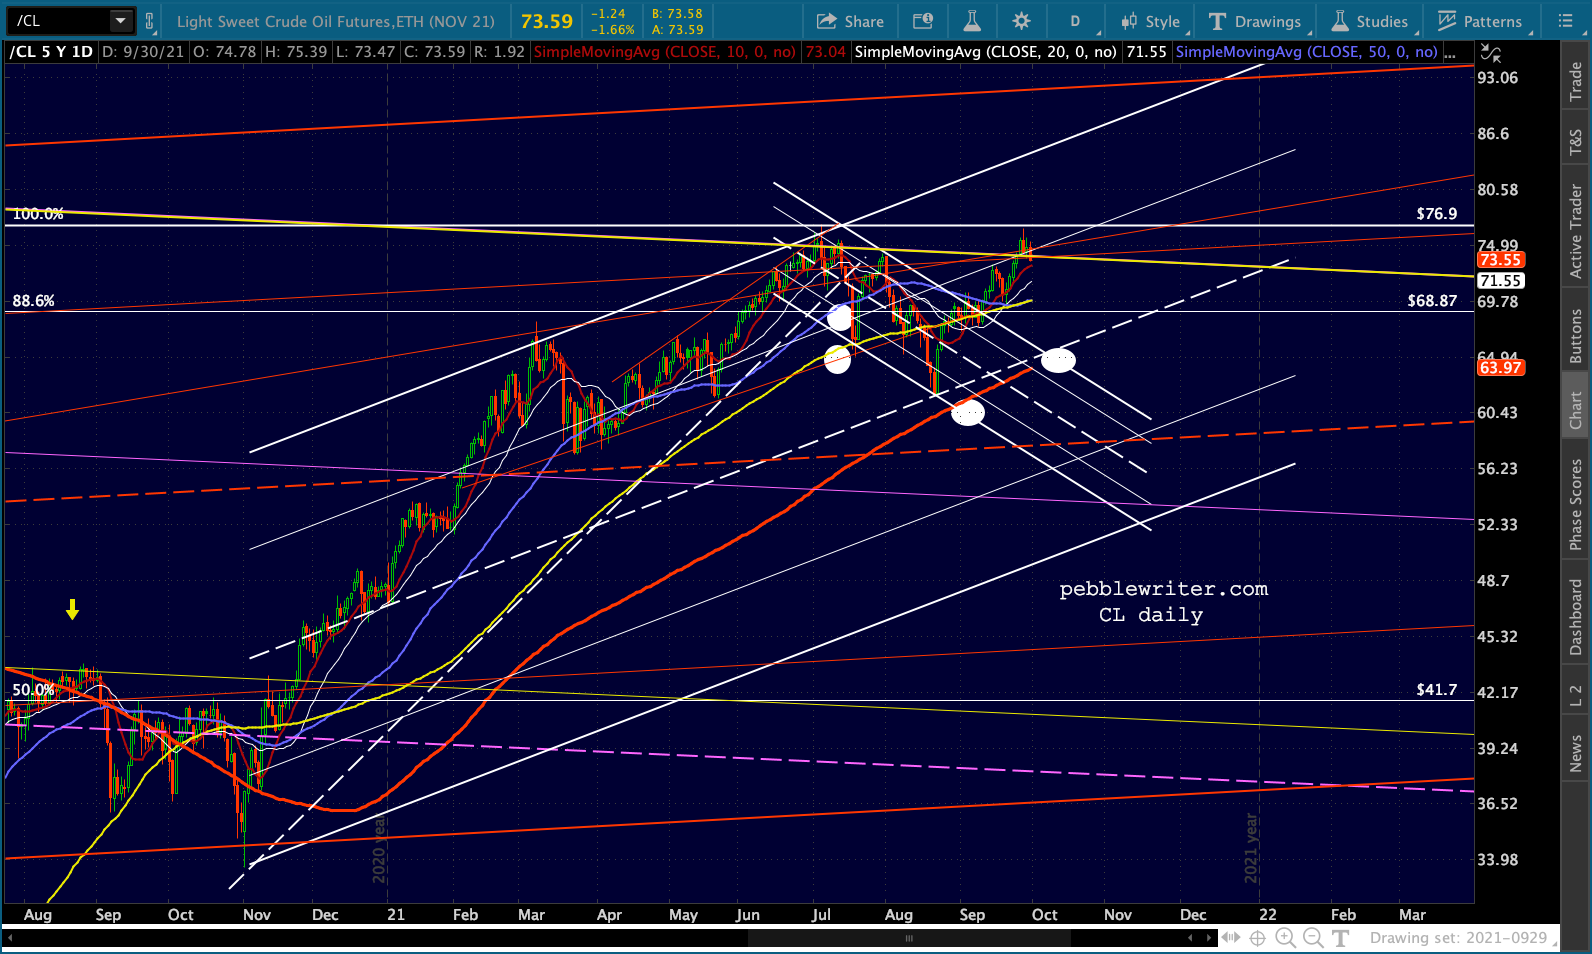
 DXY has broken out…
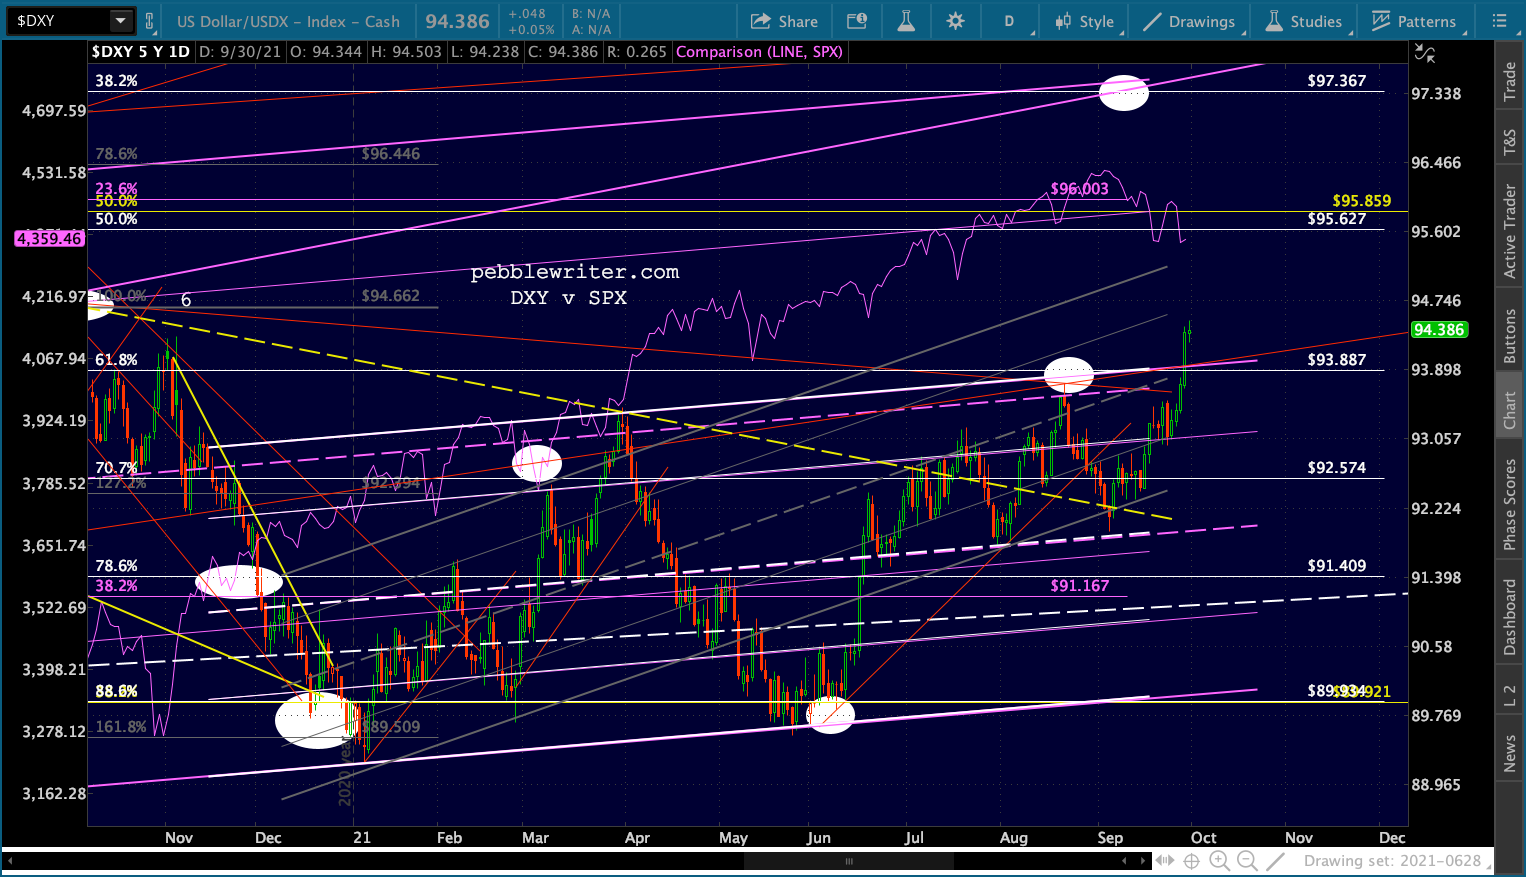 and is simply waiting to see if EURUSD corrects more than this channel backtest. I think it’s time to take profits on shorting EURUSD, reentering on any dip below 1.1567.
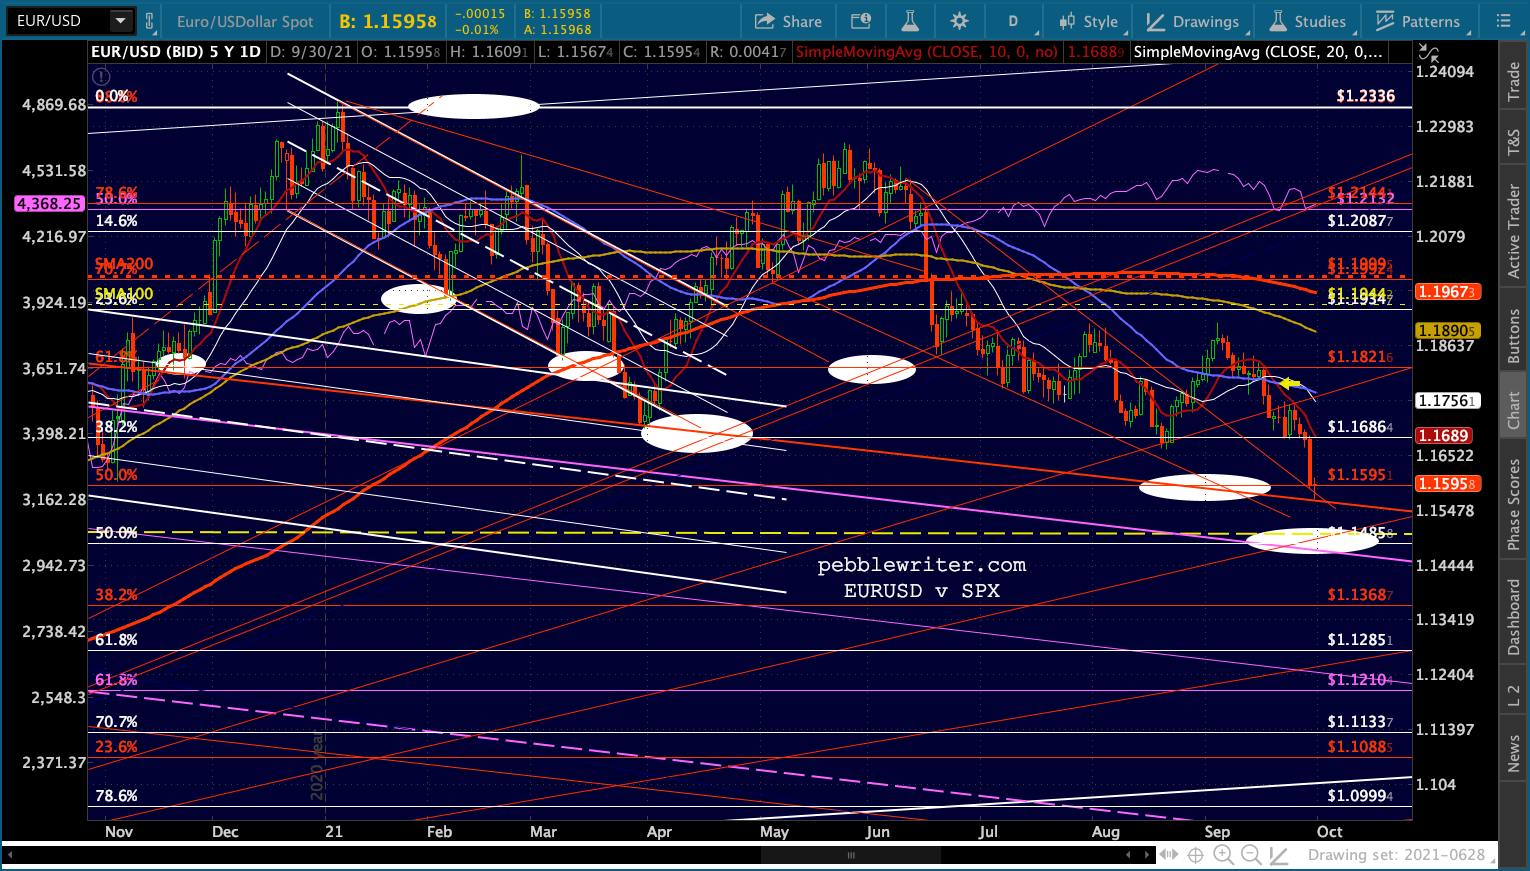 I expect USDJPY to reverse here and backtest the SMA200 – probably around 109.51.
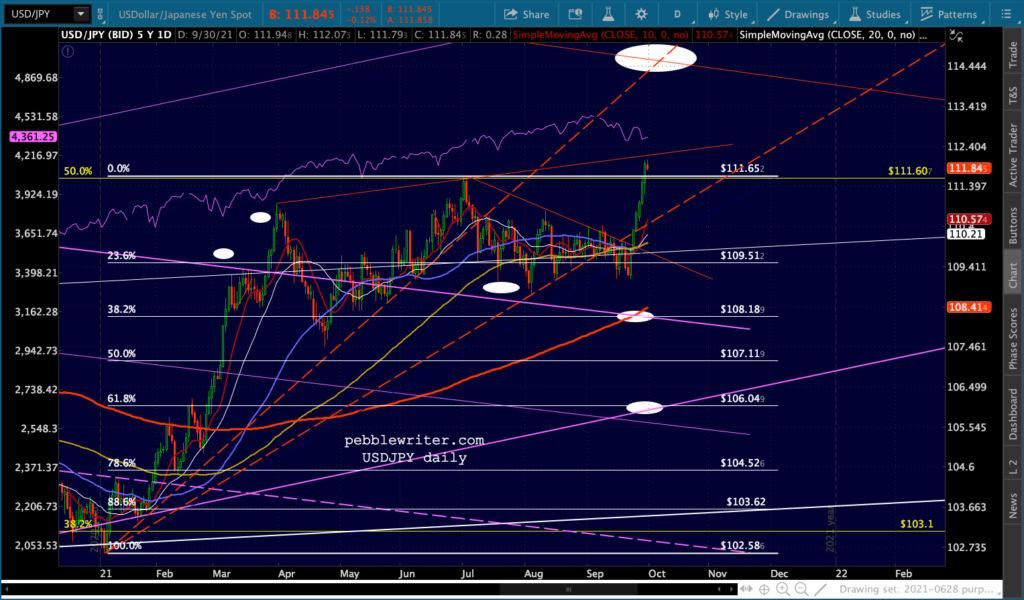
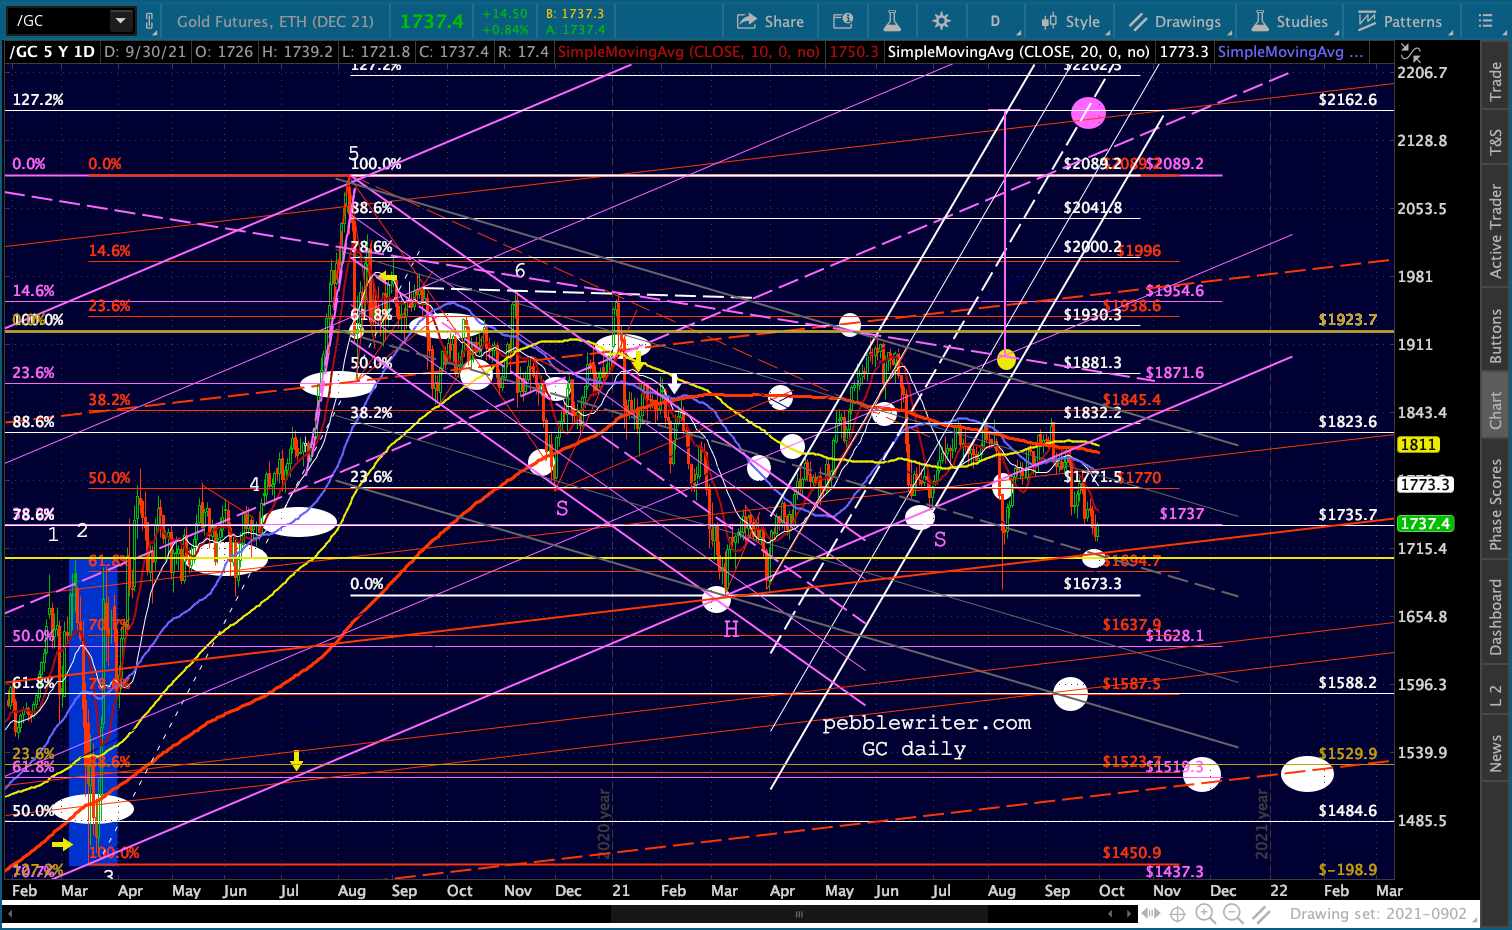
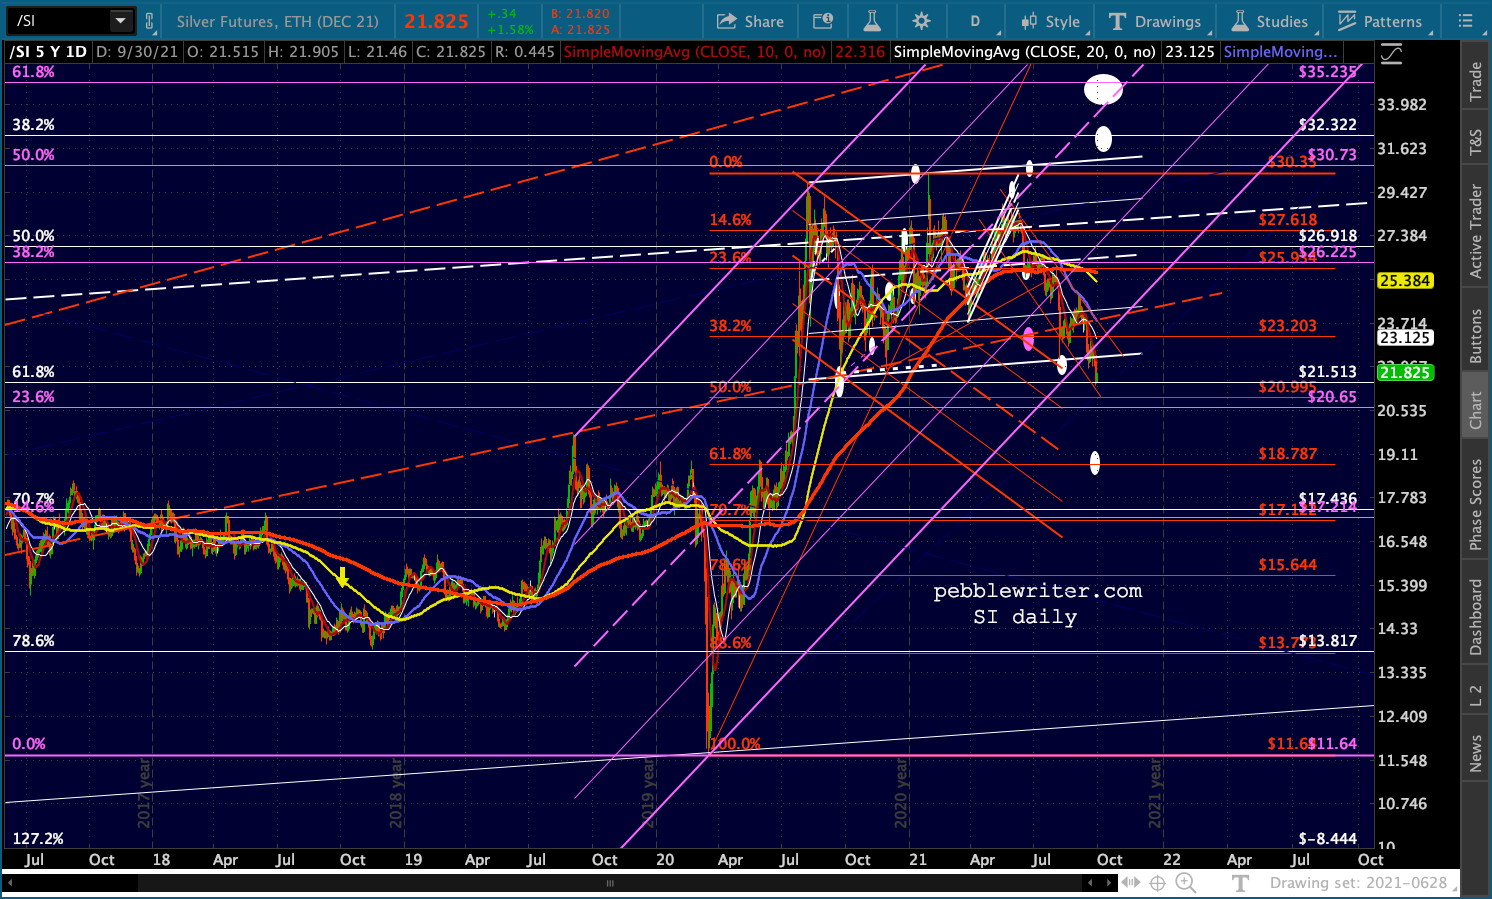
Gold and silver still look weak and should still be shorted with reasonable stops.
 Ditto for BTC as long as it remains below the SMA200.
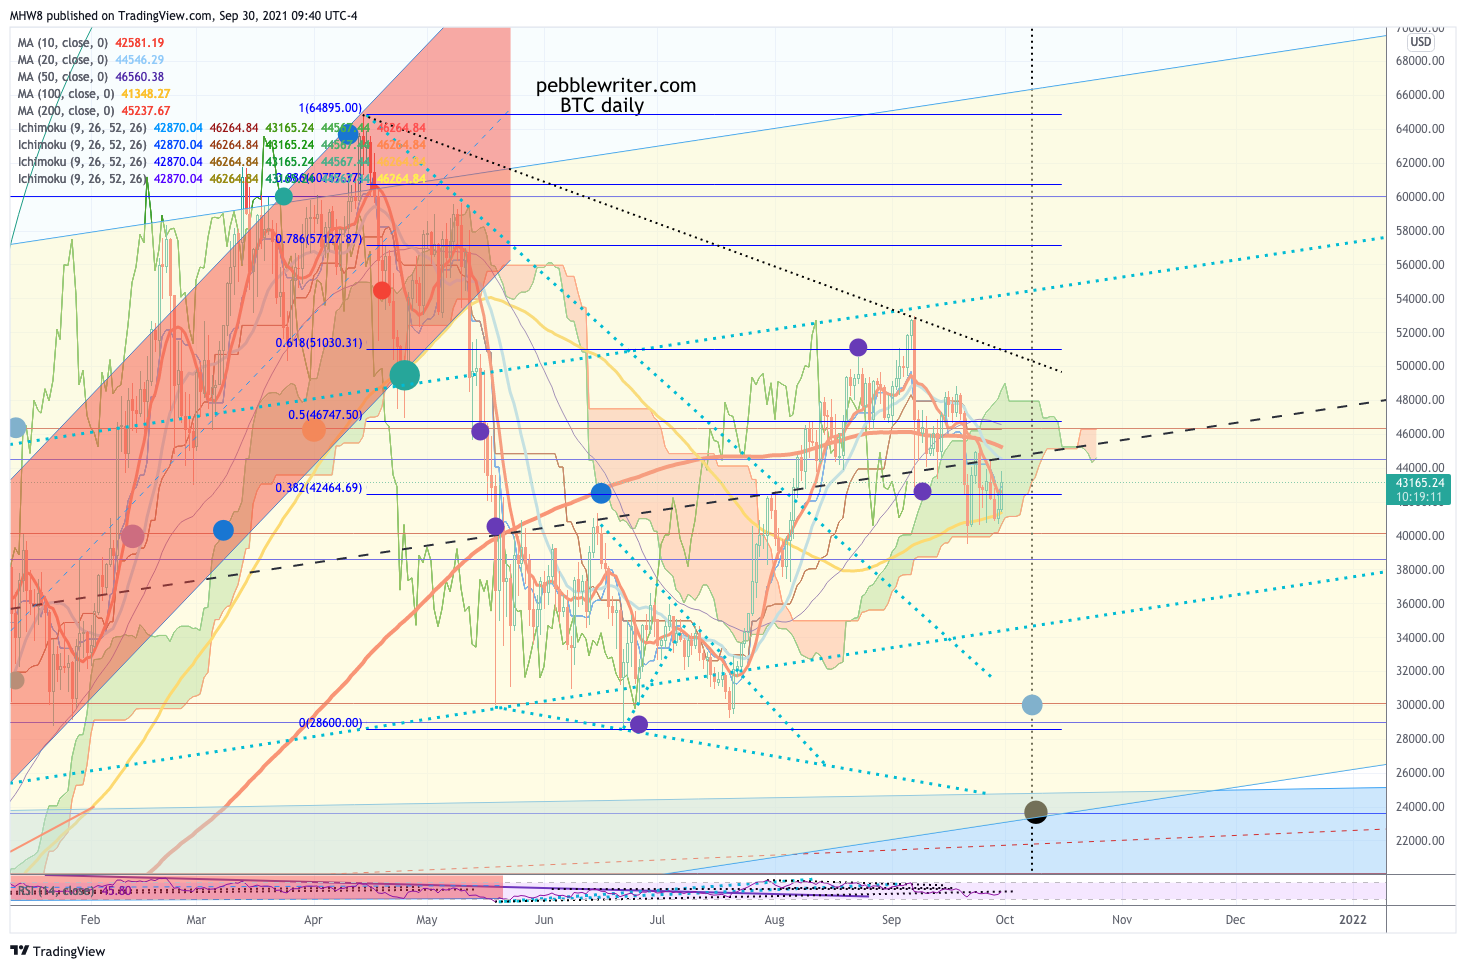 UPDATE: 3:00 PM
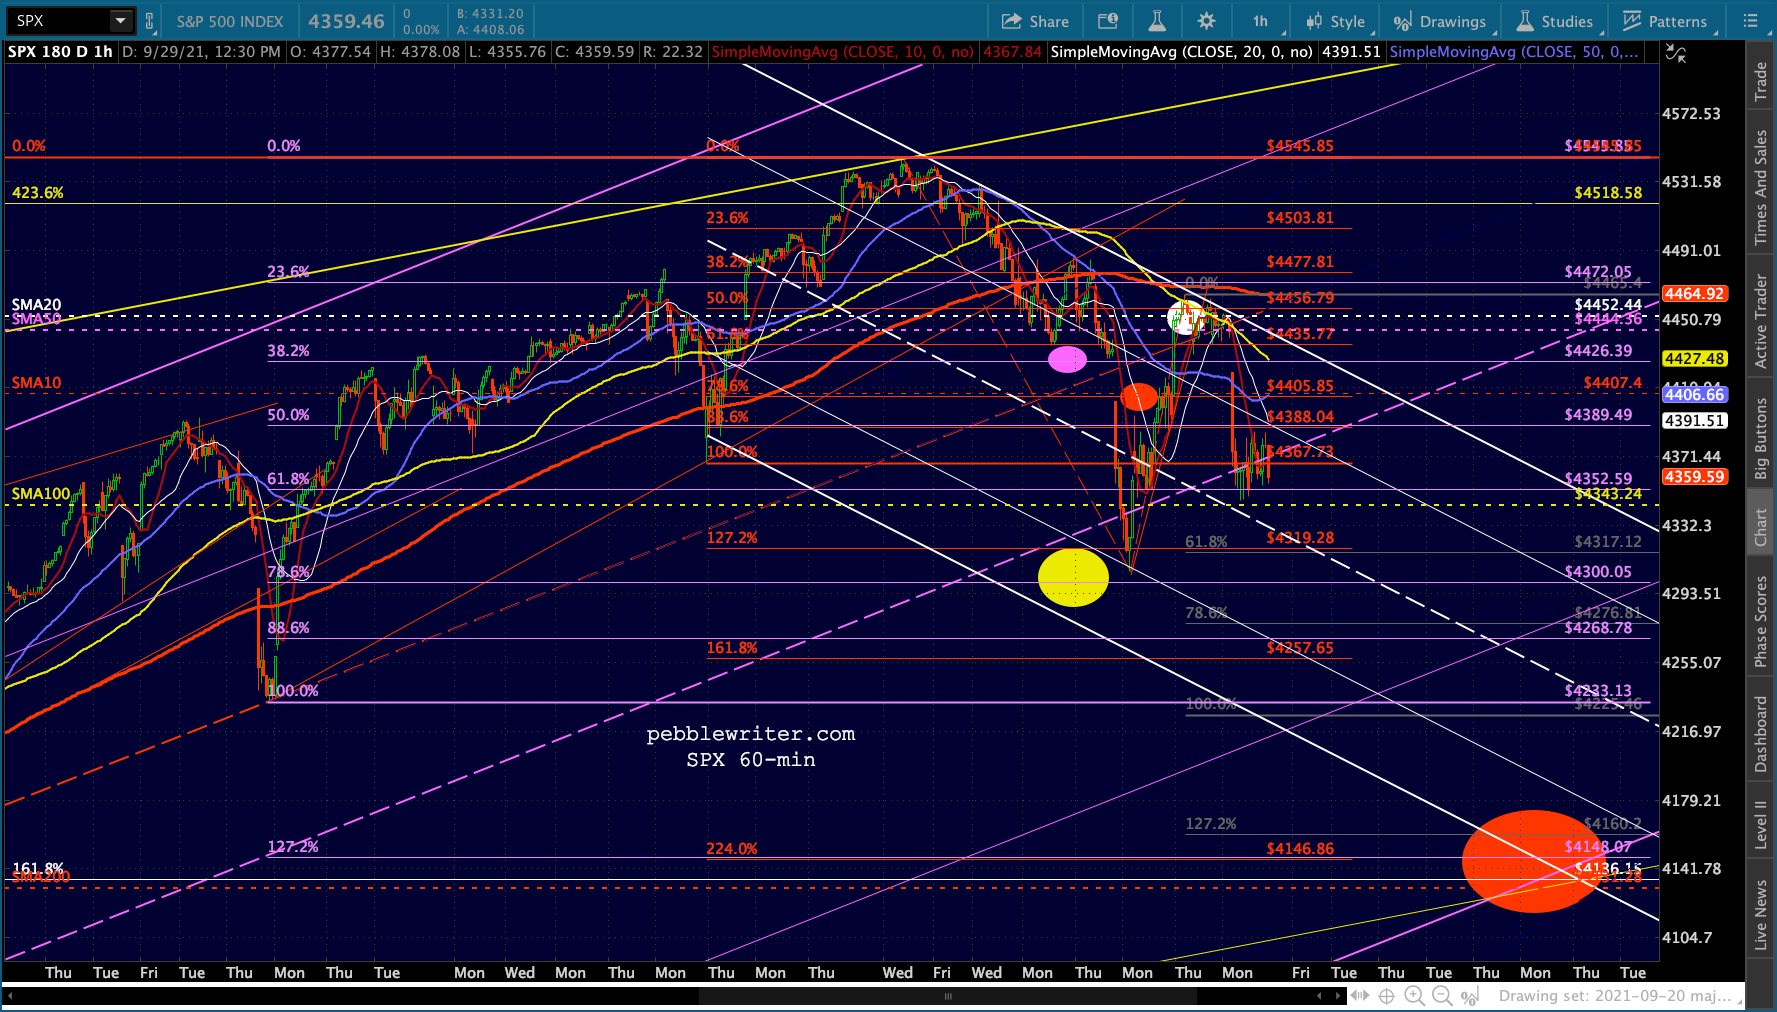
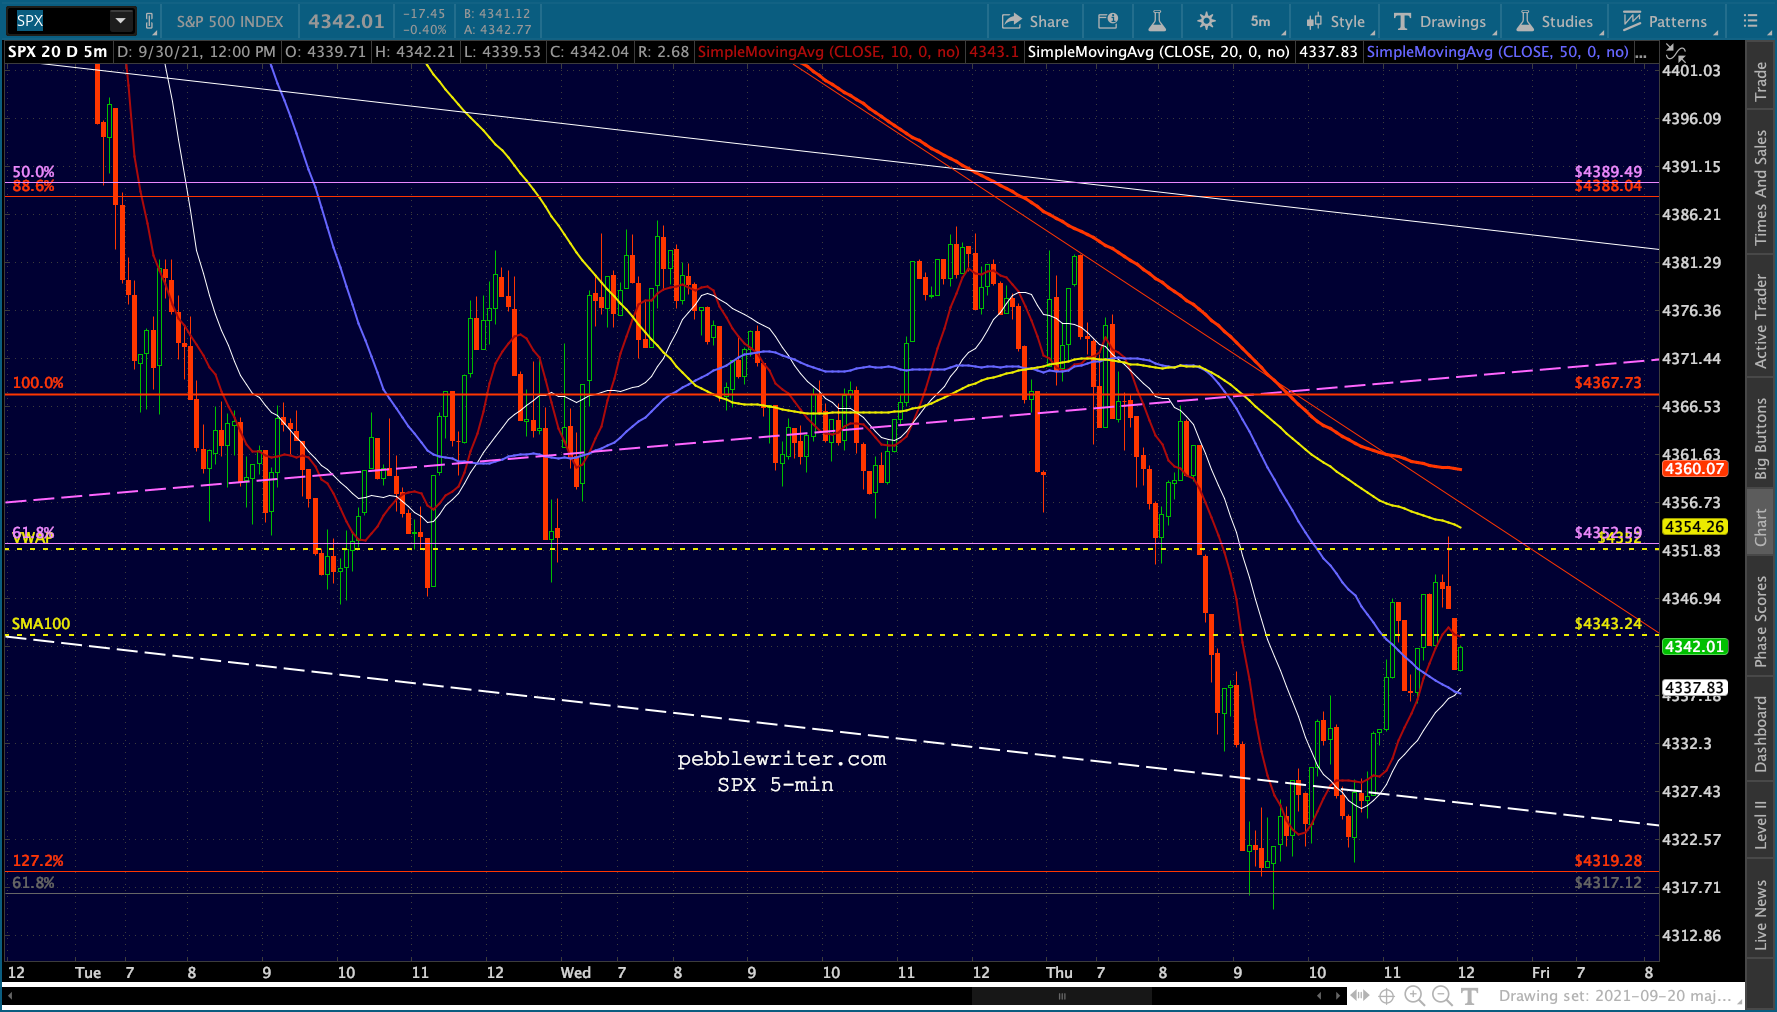
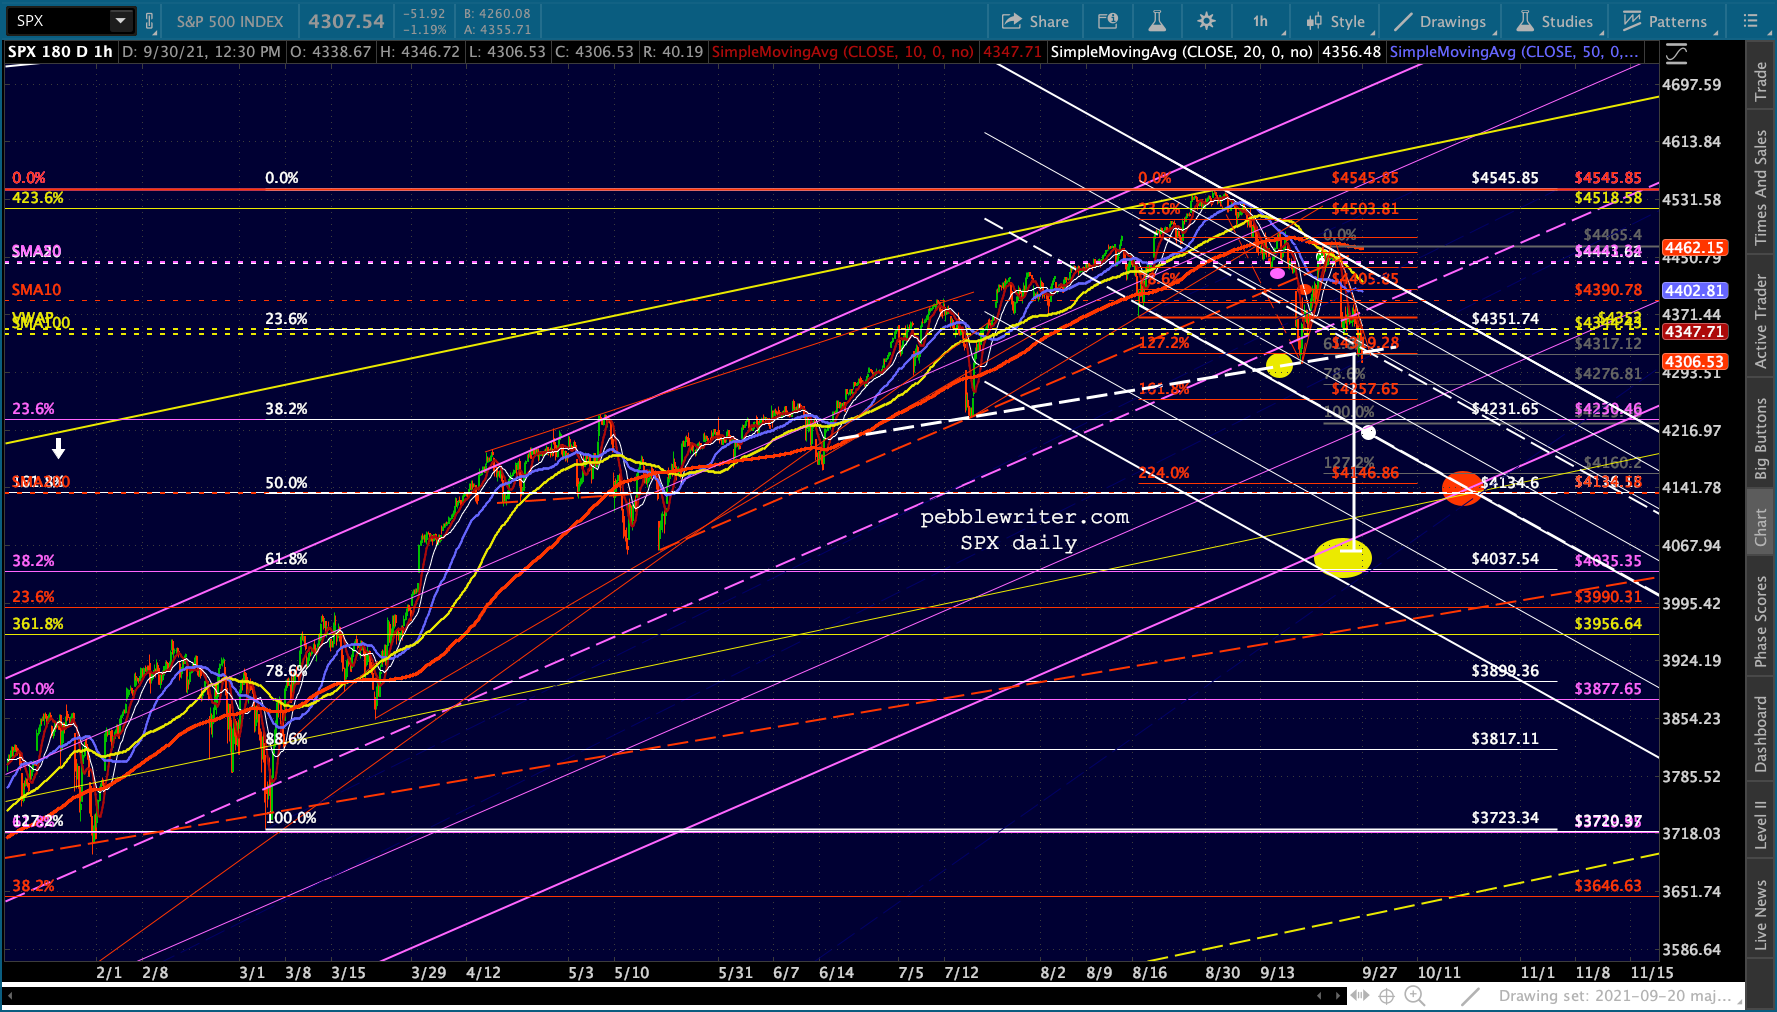
ES has completed the yellow H&S and backtested its neckline.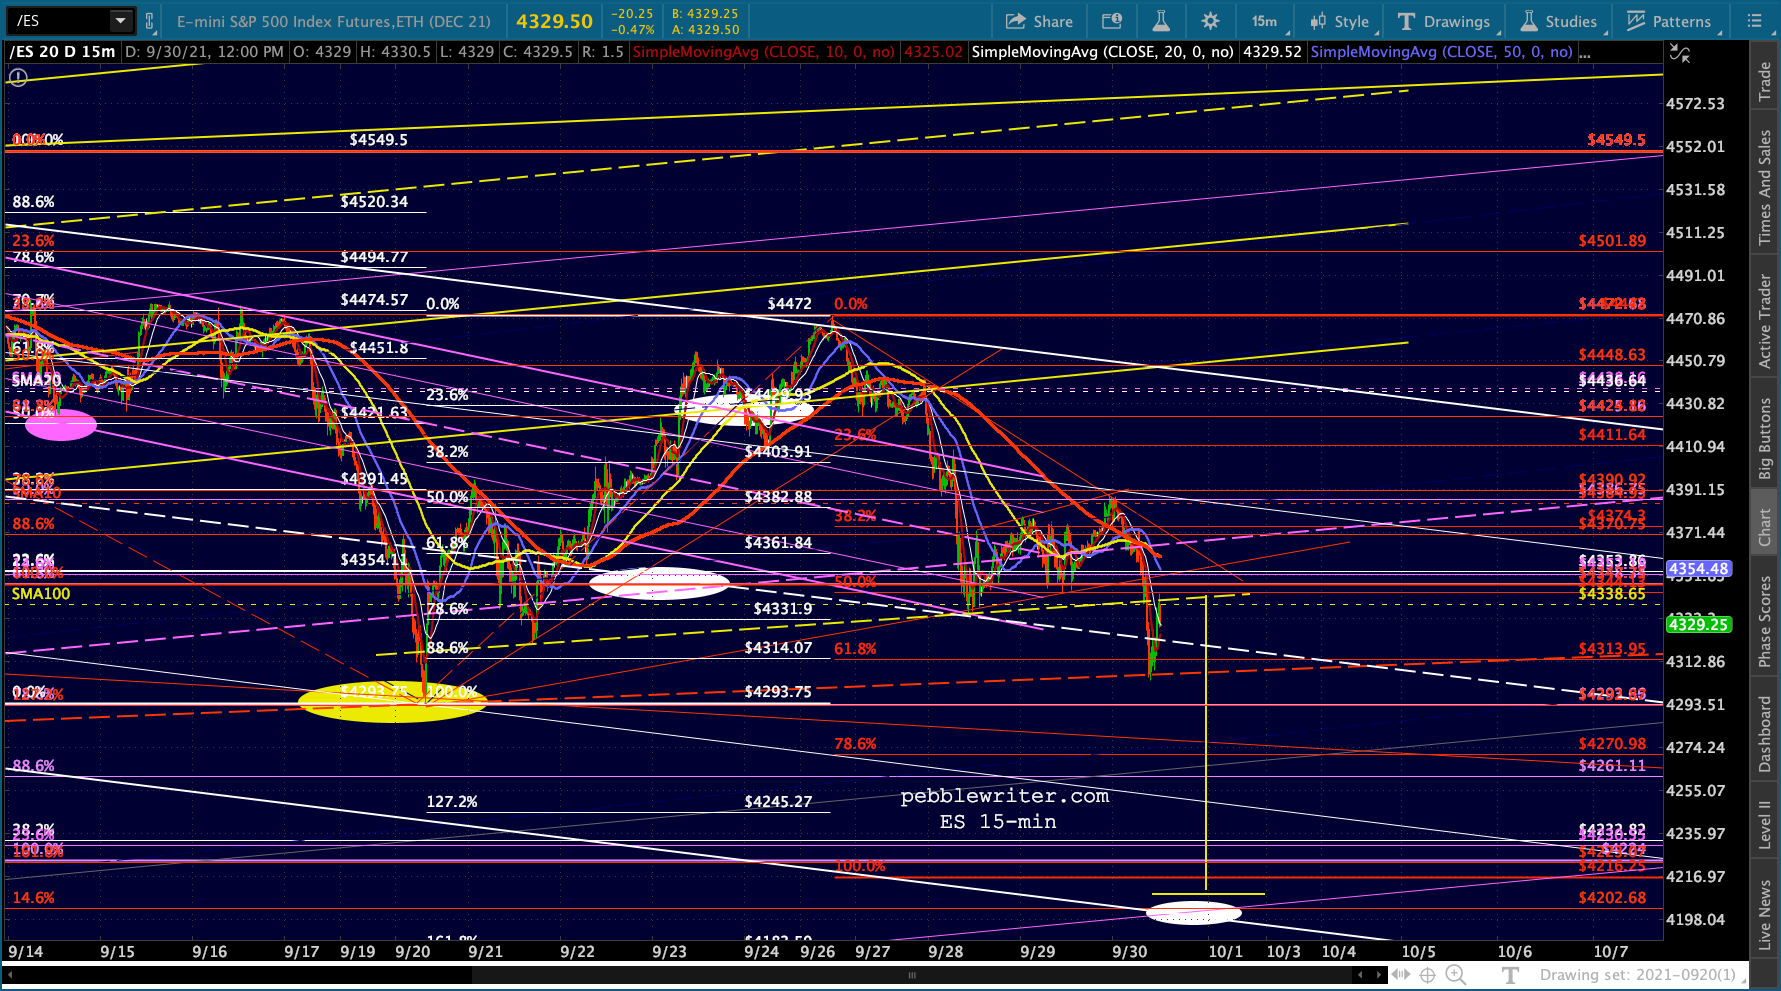 And, SPX has backtested its VWAP.
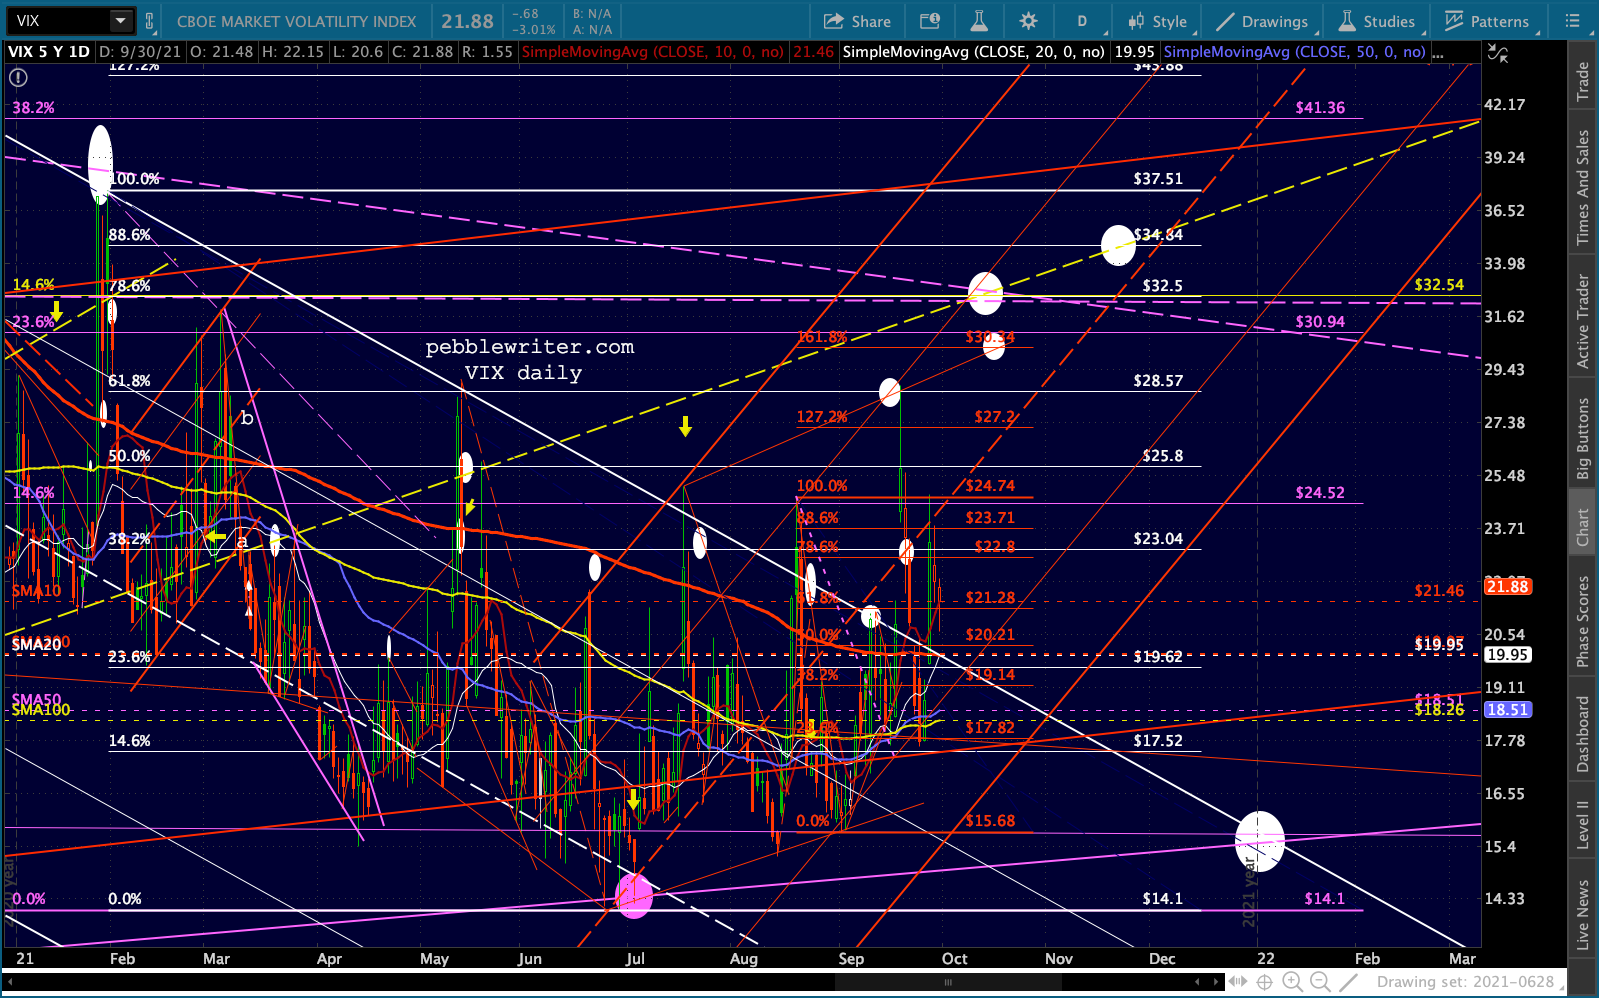
 As VIX tagged the bottom of a triangle.
 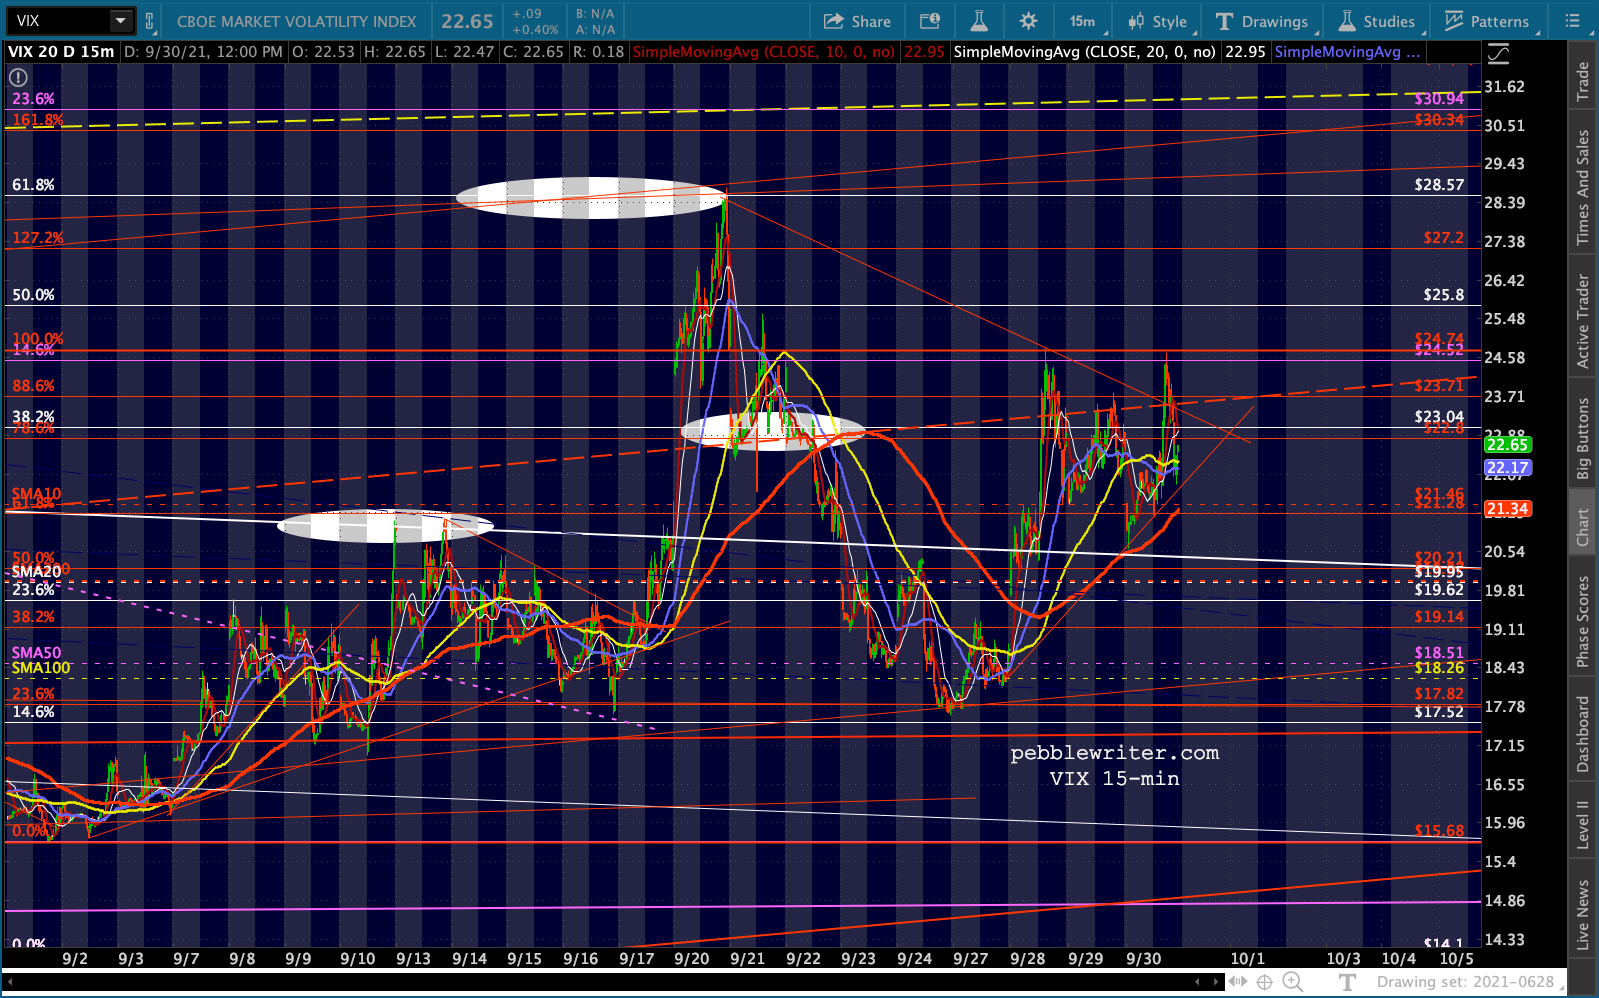 This would be a logical place for a reversal, though we can never rule out the possibility of a rally back to green on the last day of a month/quarter.
UPDATE: 7:00 PM
Pretty interesting day. ES, SPX and VIX all reversed where the bears needed them to without any silliness into the close.
It leaves some fascinating patterns in place. First, we have another H&S pattern, shown below in purple, which targets the 3.618 Fib that was never really backtested and is in line with the red TL. The yellow target at 3997 is still in play.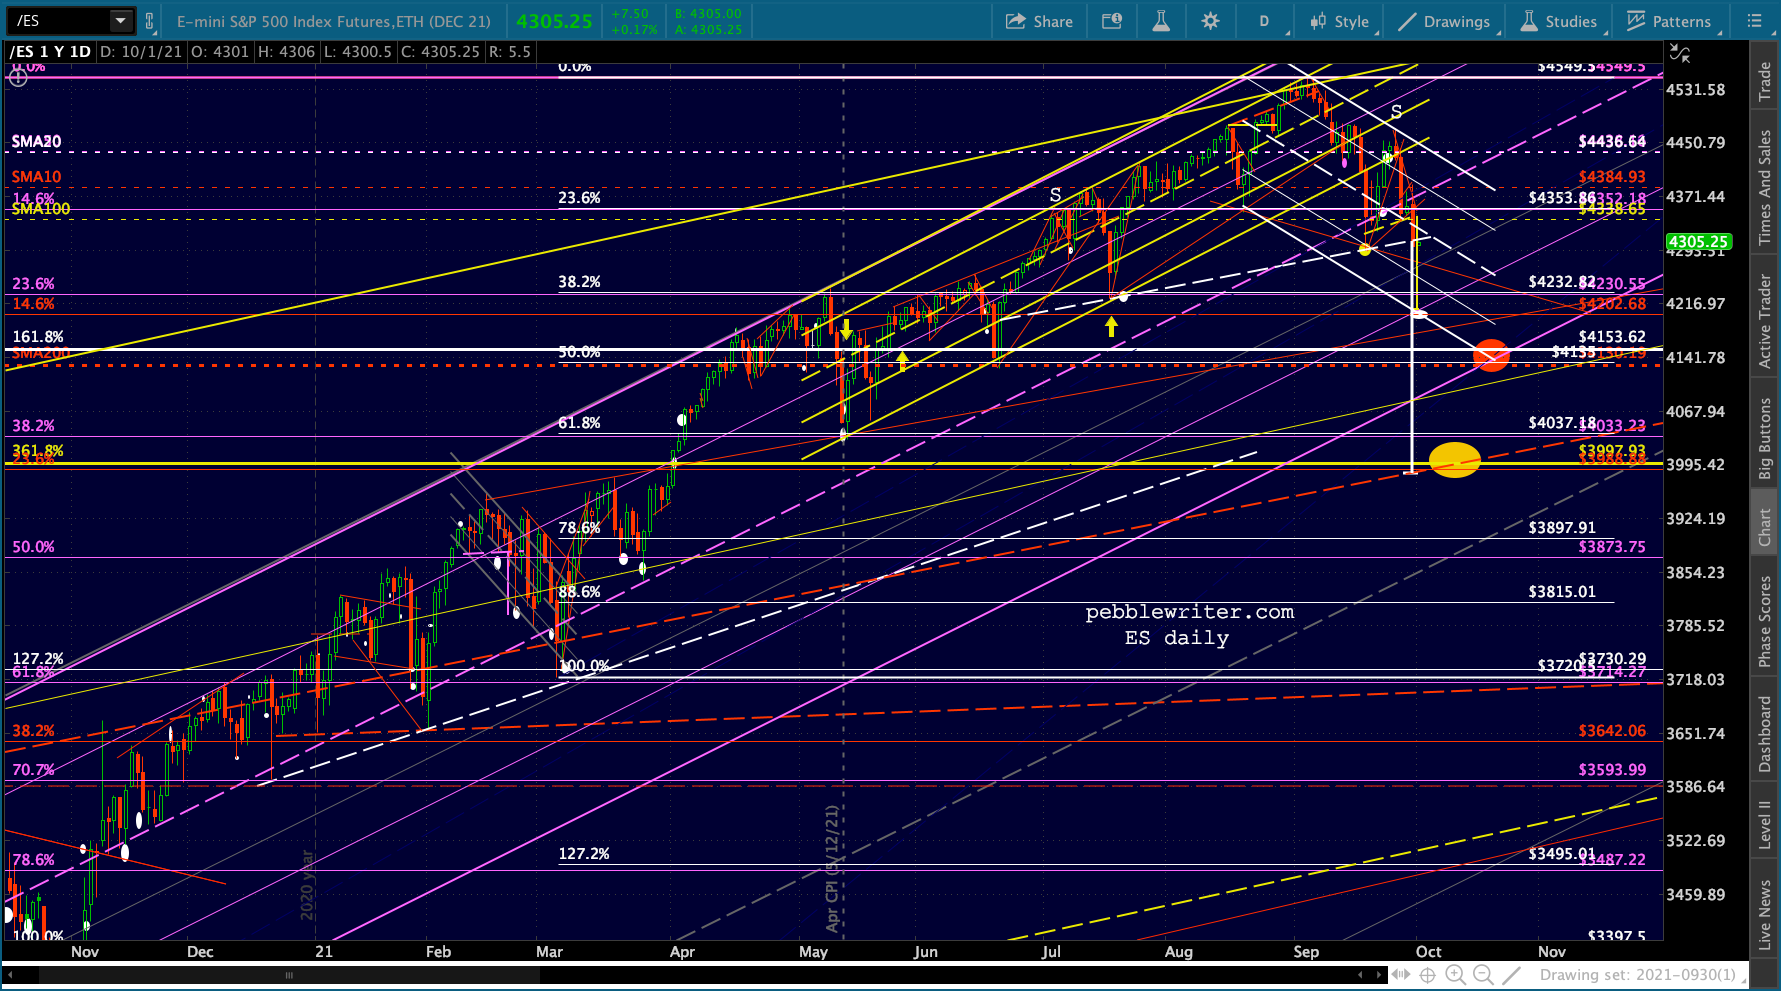 If we double the width of the falling white channel, it lands right at the yellow target. while the white target and red target lie along the larger white channel’s midline. The red target also represents another important Fib extension that was never backtested.
 Keep in mind the small yellow channel that recently broke down is a subset of the rising purple channel which is a subset of the large rising white channel…
 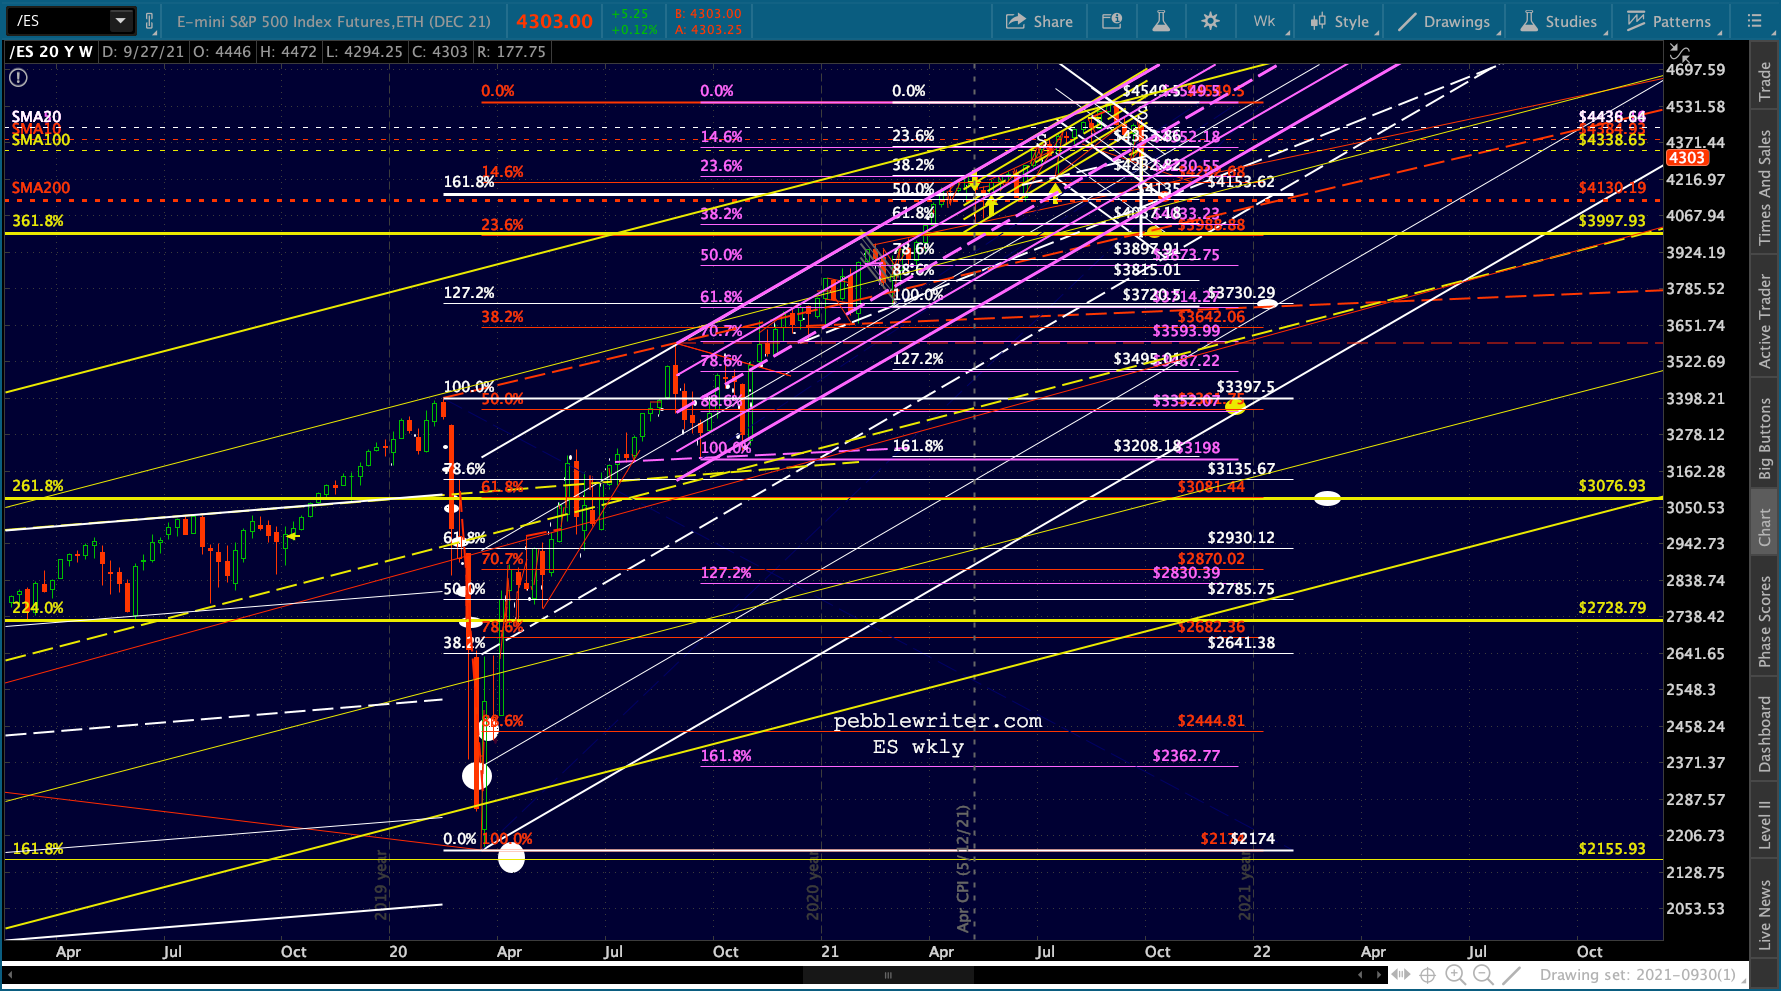 …which carried ES from the bottom of the huge yellow channel to its top. Think of it like dominoes. When one channel falls, the next one in line should be tested. When it fails, etc. etc.
A drop to the bottom of the rising yellow channel occurred in March 2020. Since ES found its way back to the top of the channel, it has yet to even drop to the .786 line, currently at 4067. It doesn’t really align with anything. 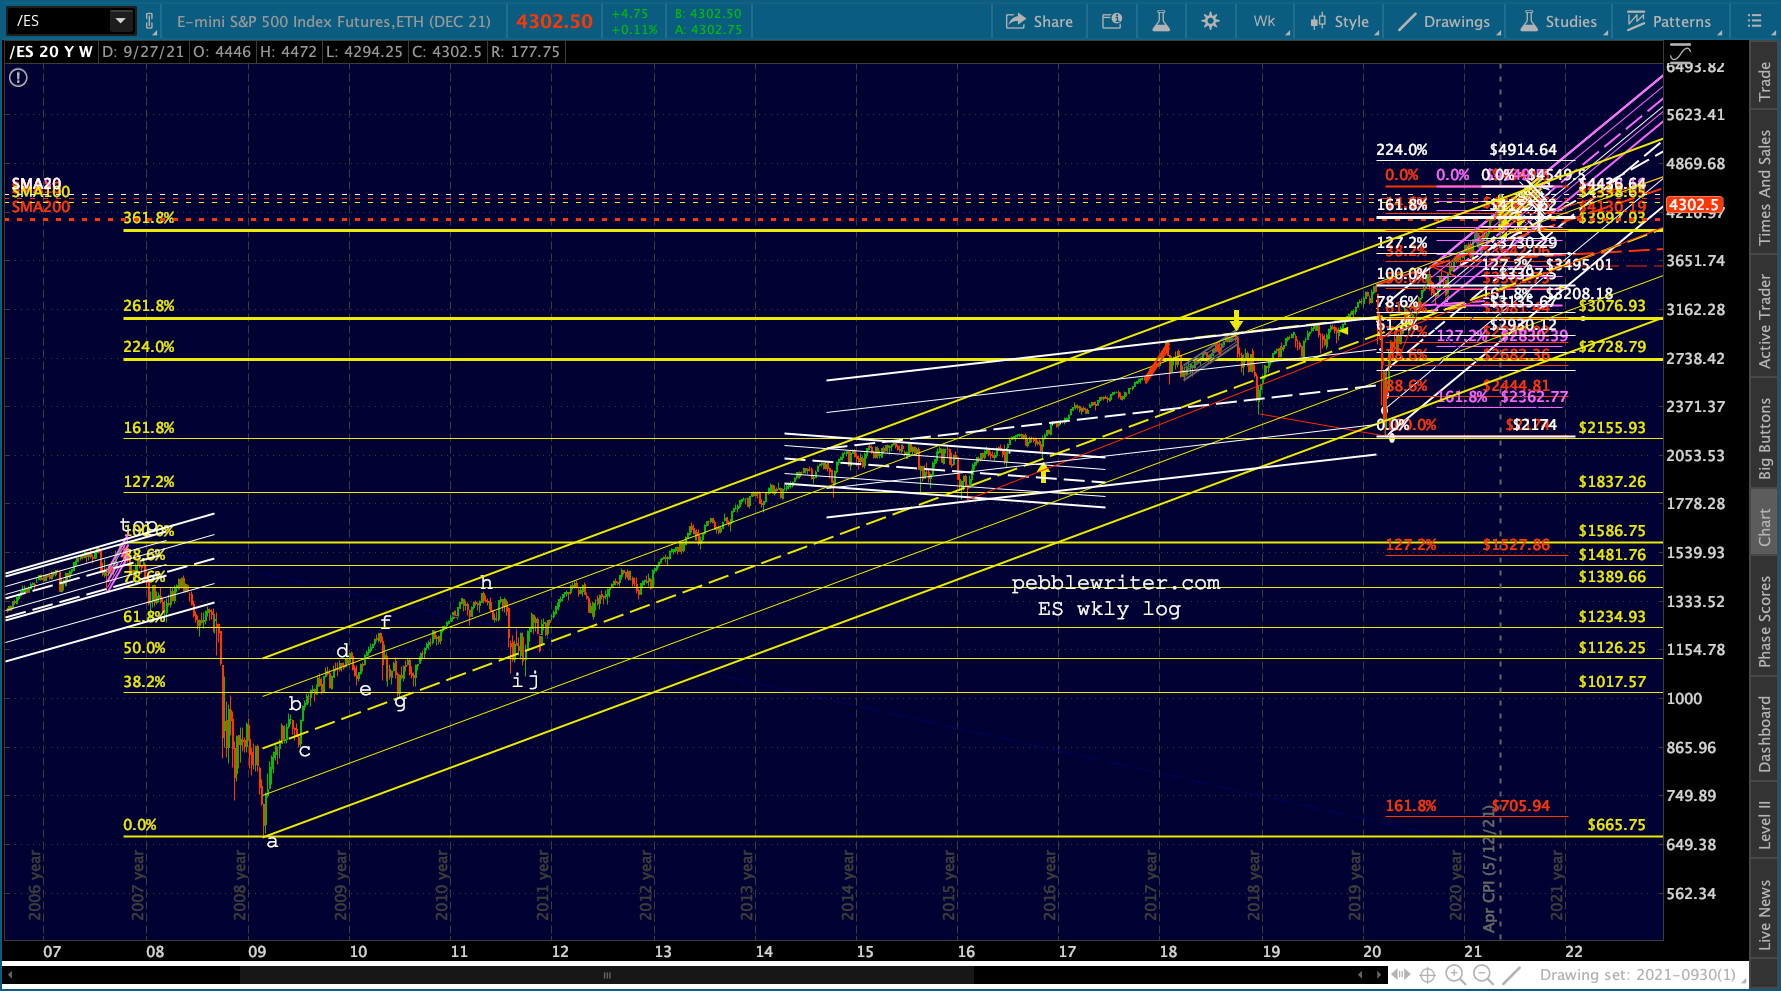 The midline is currently around 3490, which is where the white 1.272, the bottom of the expanded falling white channel, and the .236 line of the rising white channel are. We’ll keep it in mind.
 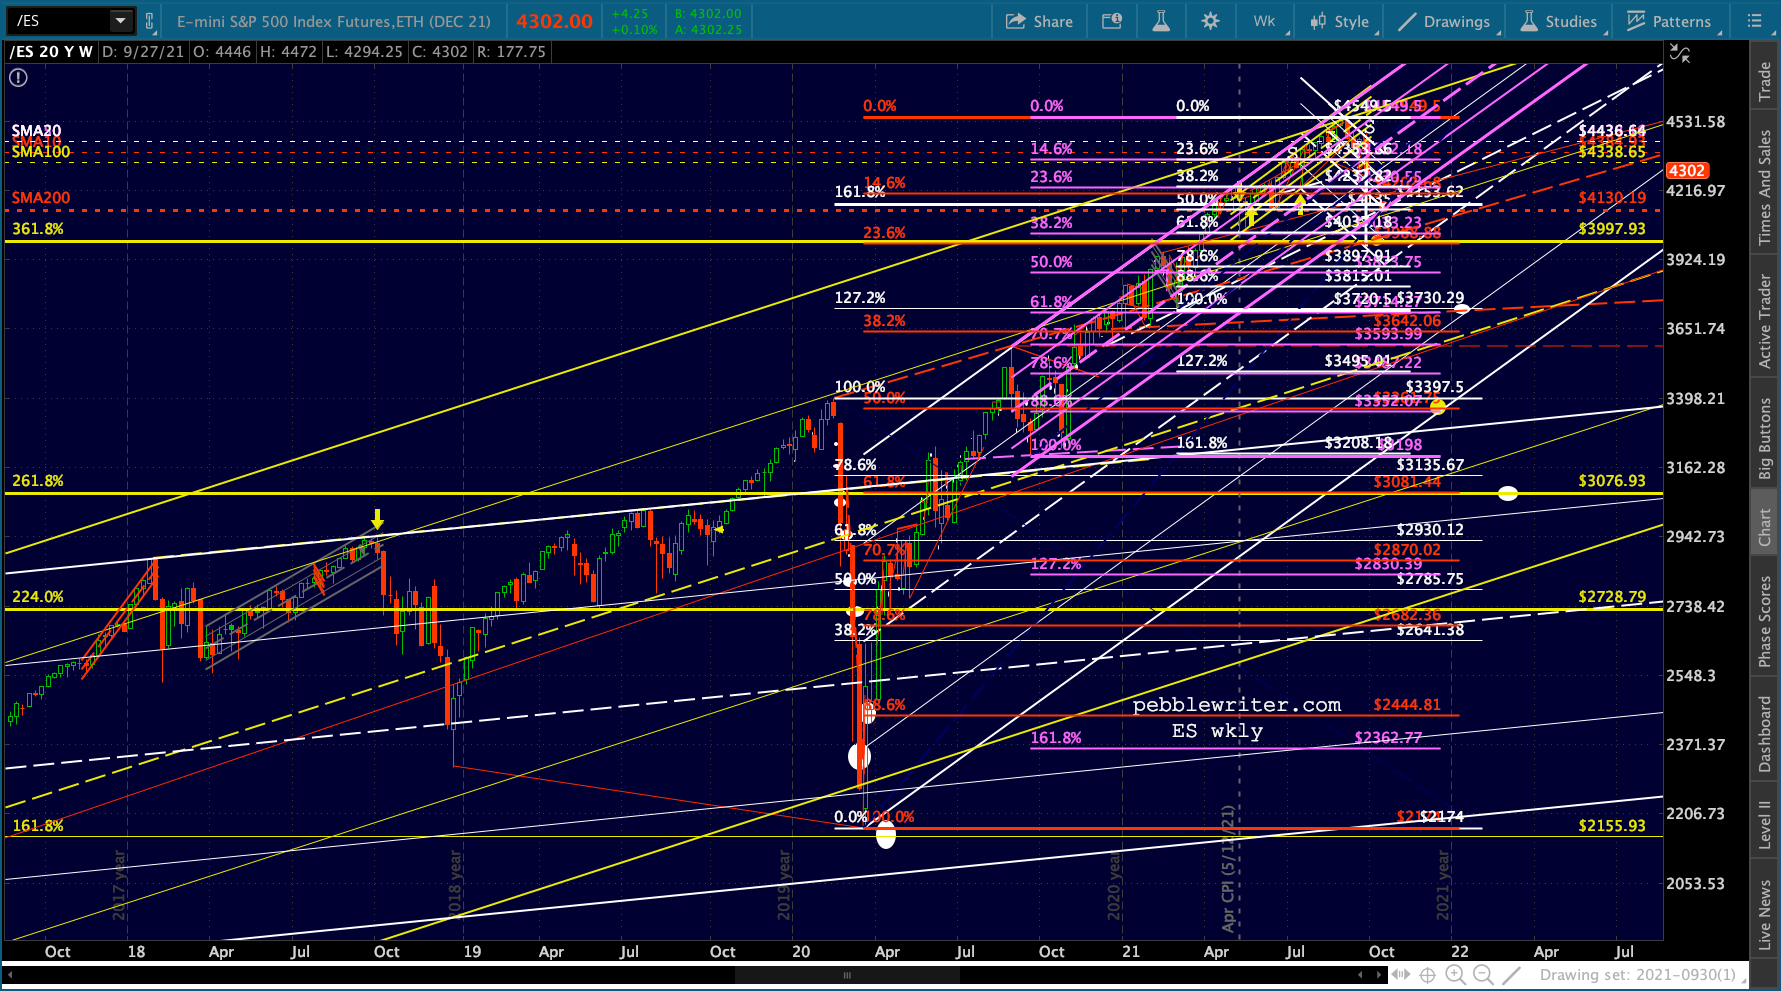 Note that the white 1.272 is right on top of the purple .786 at 3487-3495. And the red .618 is within 5 points of the yellow 2.618 at 3076. That’s a very long ways away, but we never properly backtested the 2.618. So, again, worth keeping it in mind.
 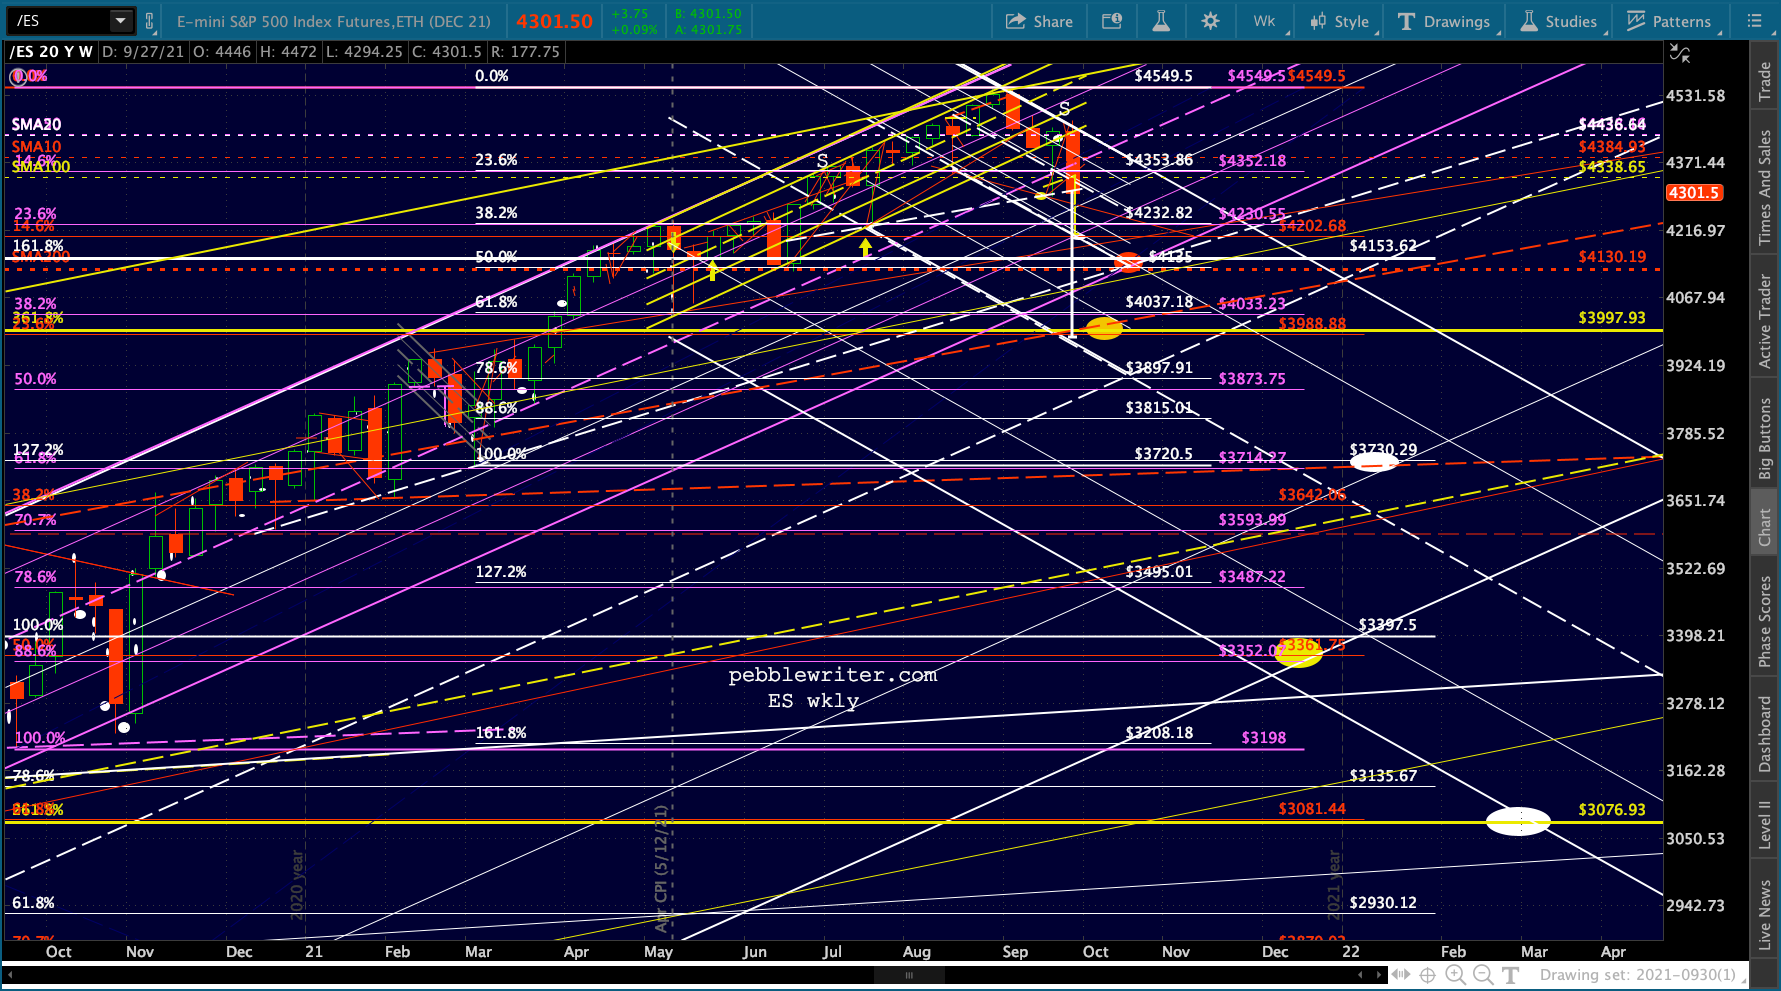 For now, we’ll look to see if we can reach 4202 or 4153. The SMA200 is now at 4133, pretty close. If those break down, then I’ll focus on 3997.
 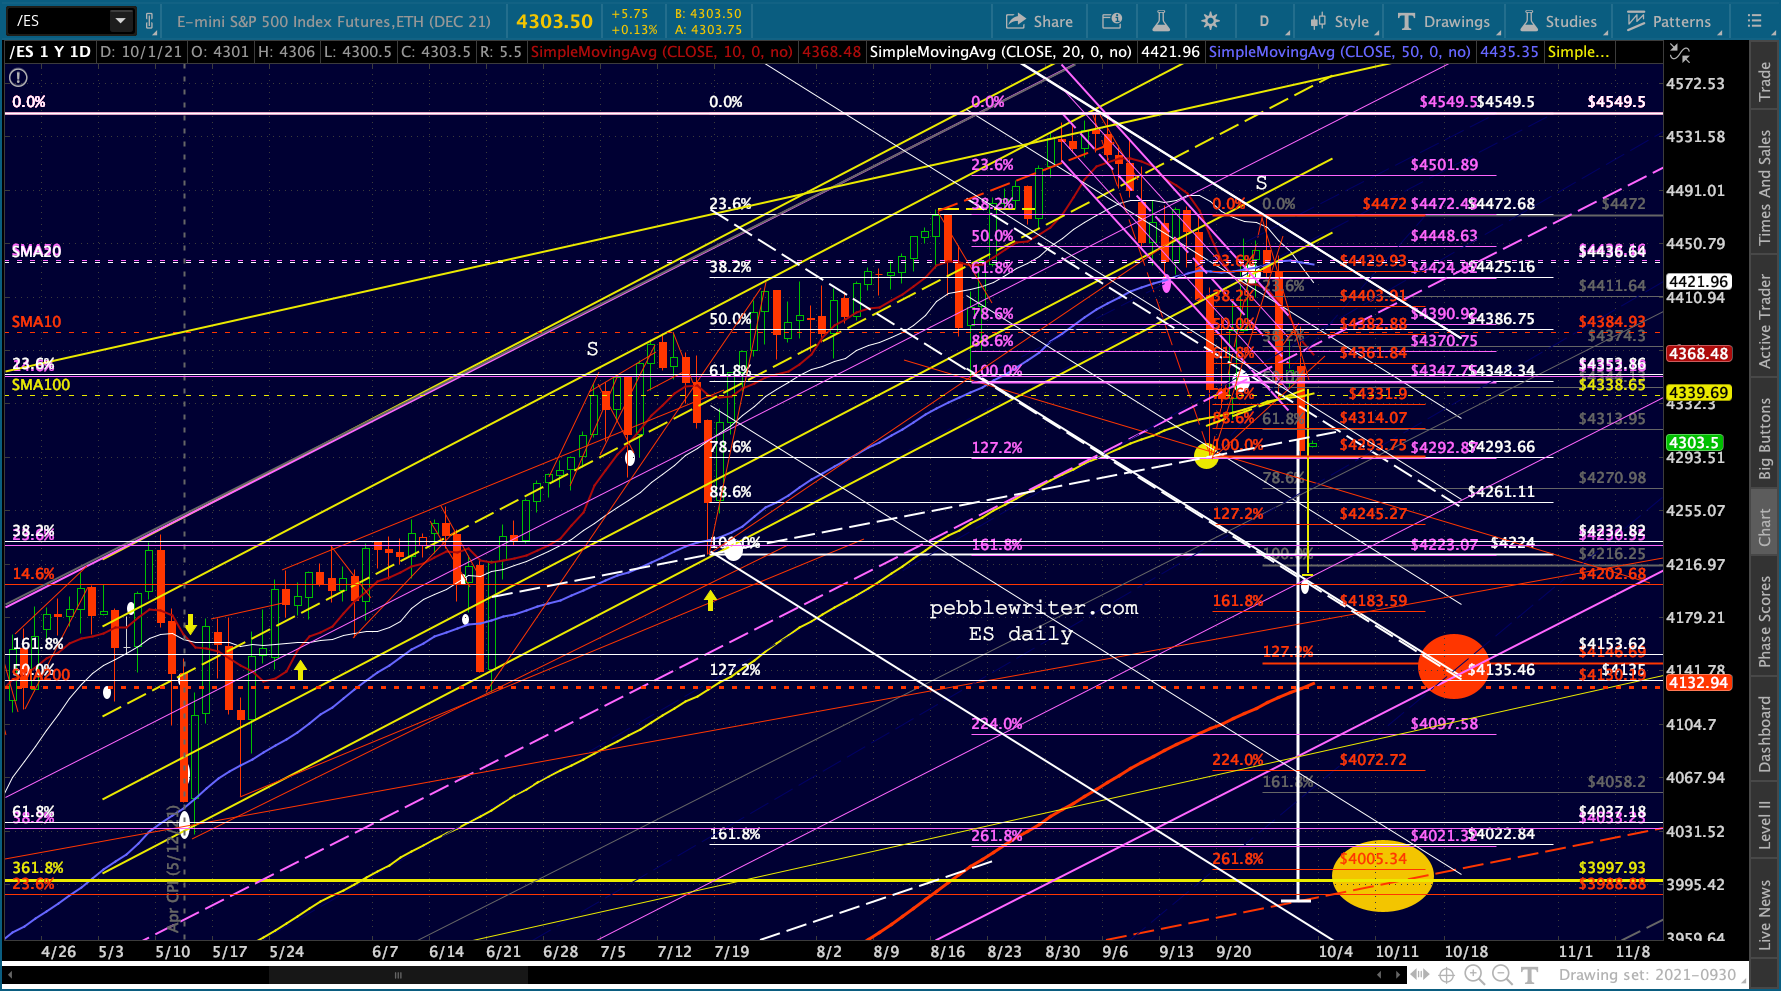 SPX is a little cleaner. The corresponding targets are marked with corresponding colors.
 More in the morning…