I heard two quotes in the financial news this morning that caught my attention. First: that about 30% of Americans will end up getting infected with the coronavirus. Second: the S&P 500 is on pace for the 5th best month in the last 30 years.


These statements are incongruous, at best. Yet, IMO, it’s more a comment on the ability of central bankers to determine stock prices through both direct and indirect means.
Everyone knows about the indirect: flooding markets with trillions of dollars that have to go somewhere. Most observant traders know about the direct: hammering volatility and manipulating currency pairs and other drivers of algorithmic trading – the tail that wags the equity dog.
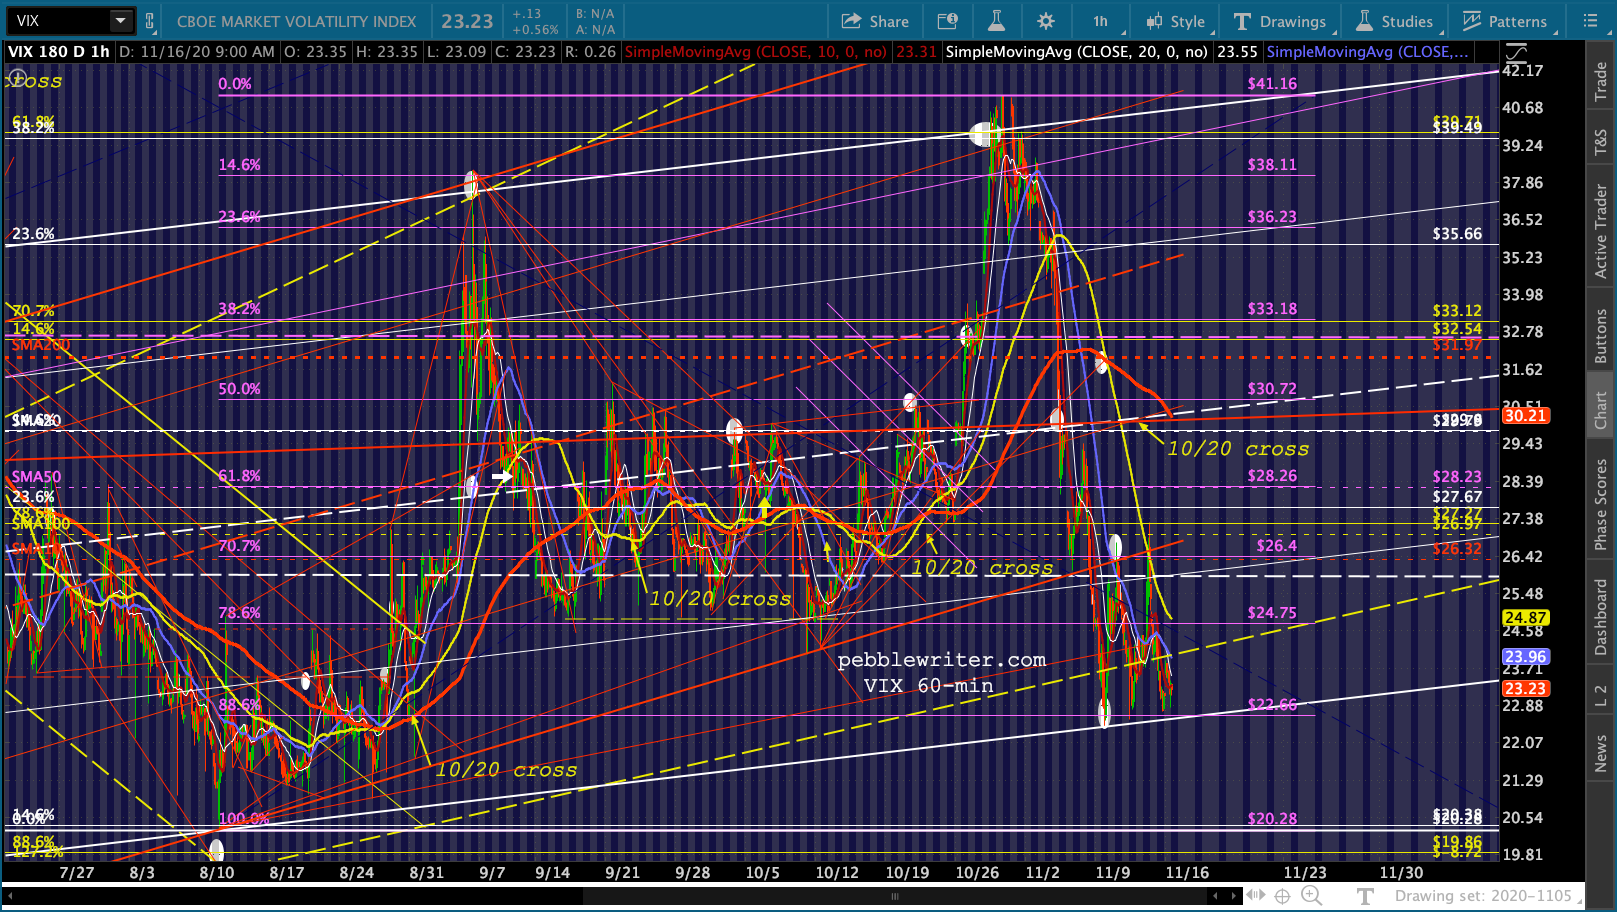
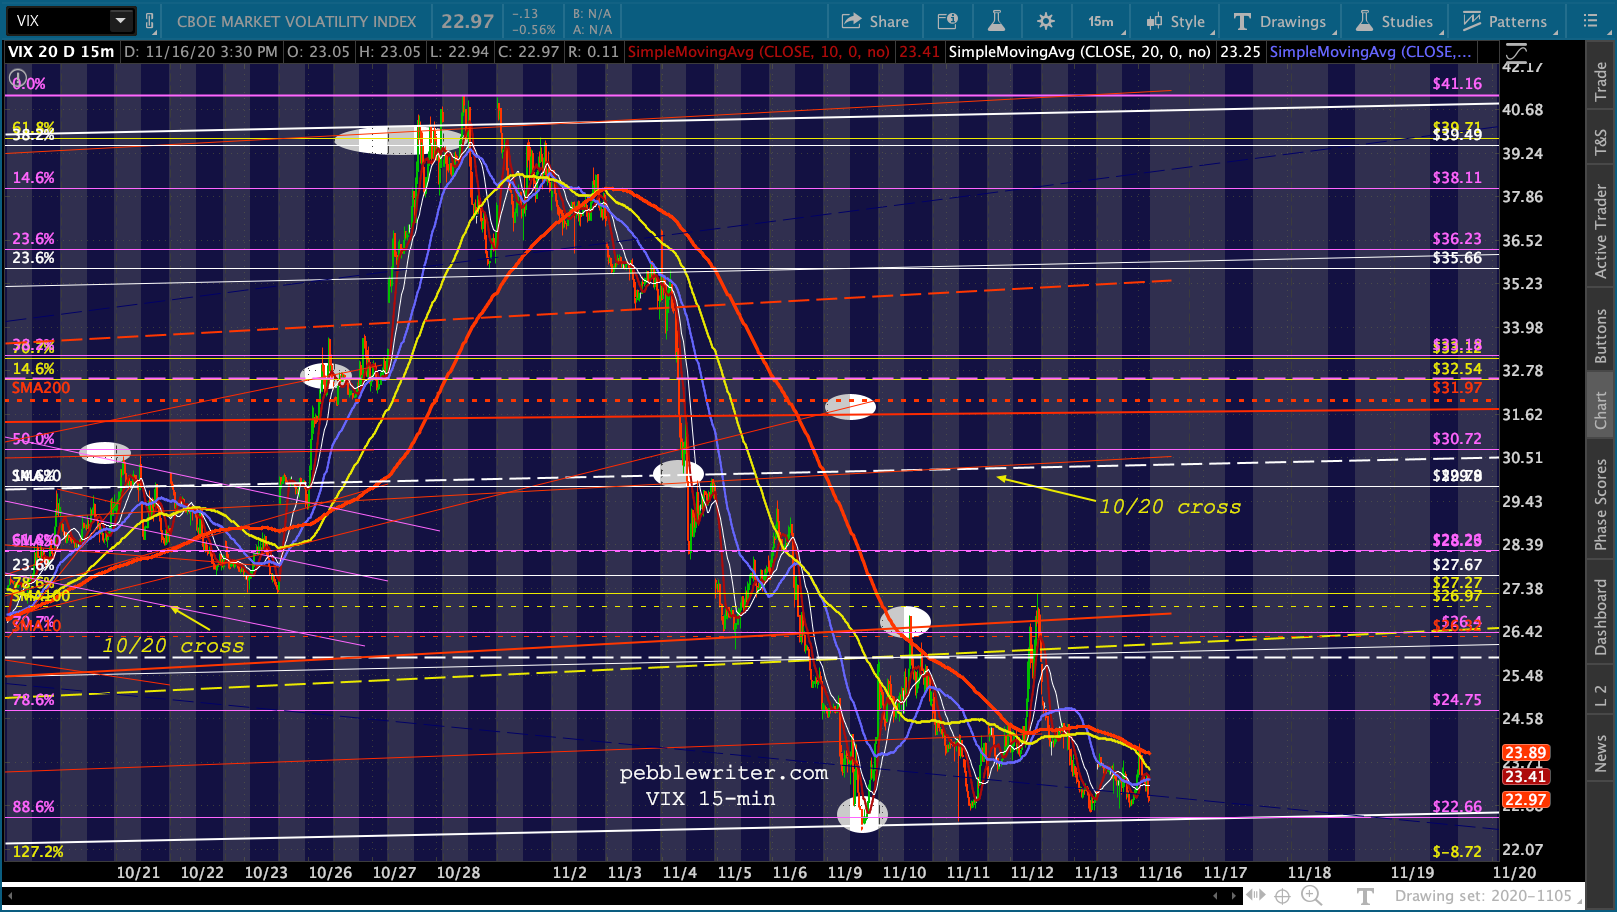
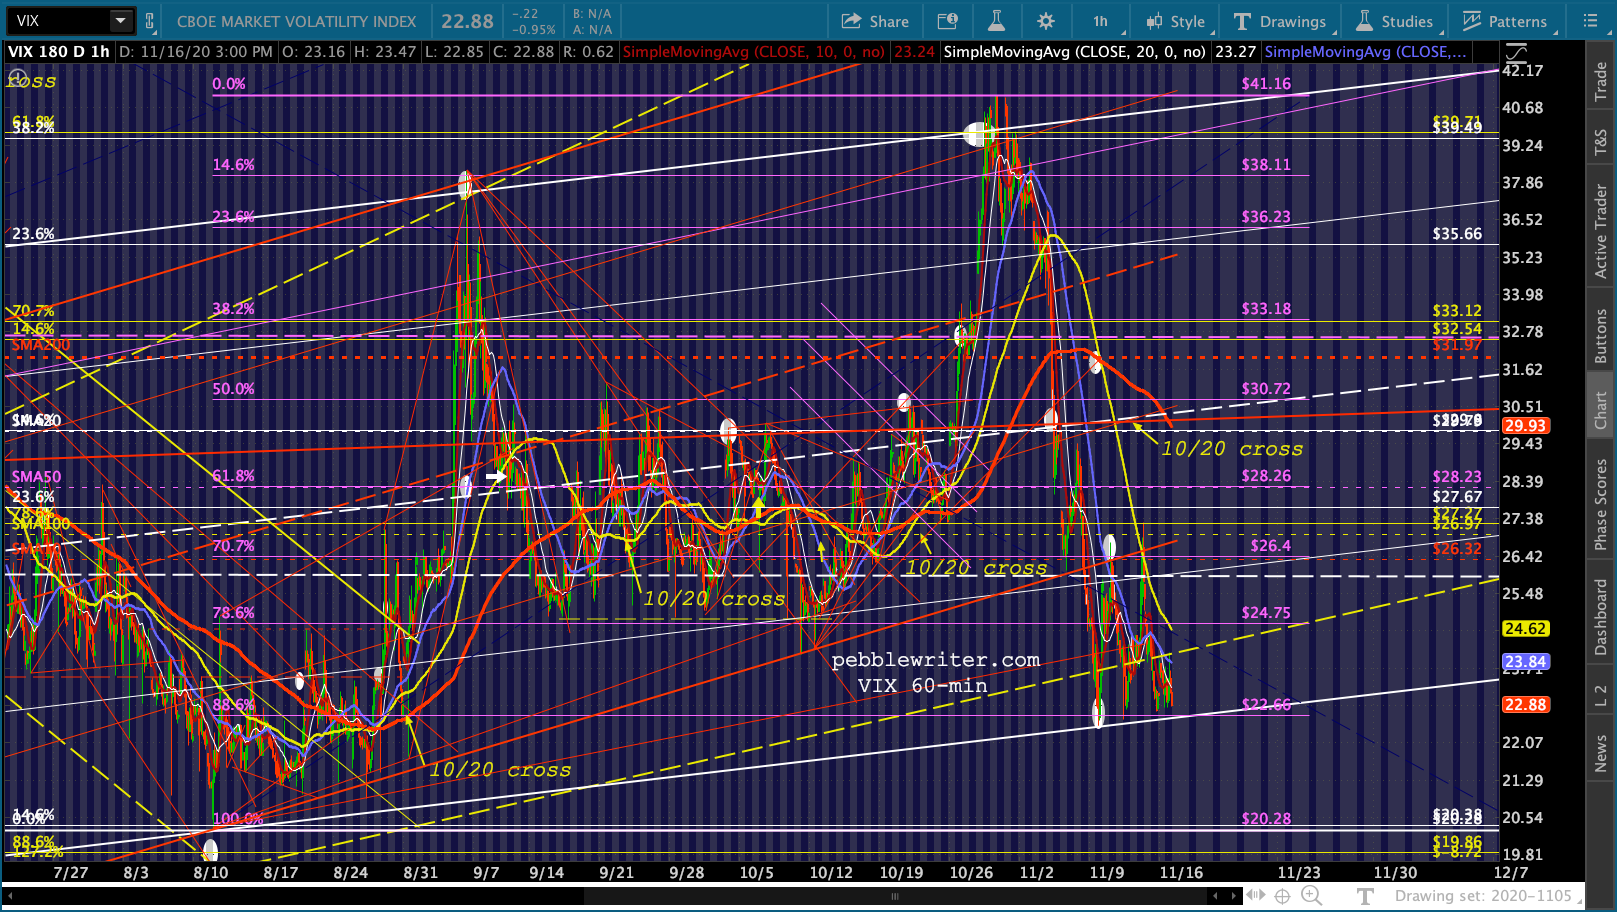
For an example, look no further than VIX. It has tagged a deep retracememt of its last rally three times in a row.
 This, of course, follows the bearish (bullish for stocks) 10/20 cross and channel breakdown we anticipated last week.
 continued for members…
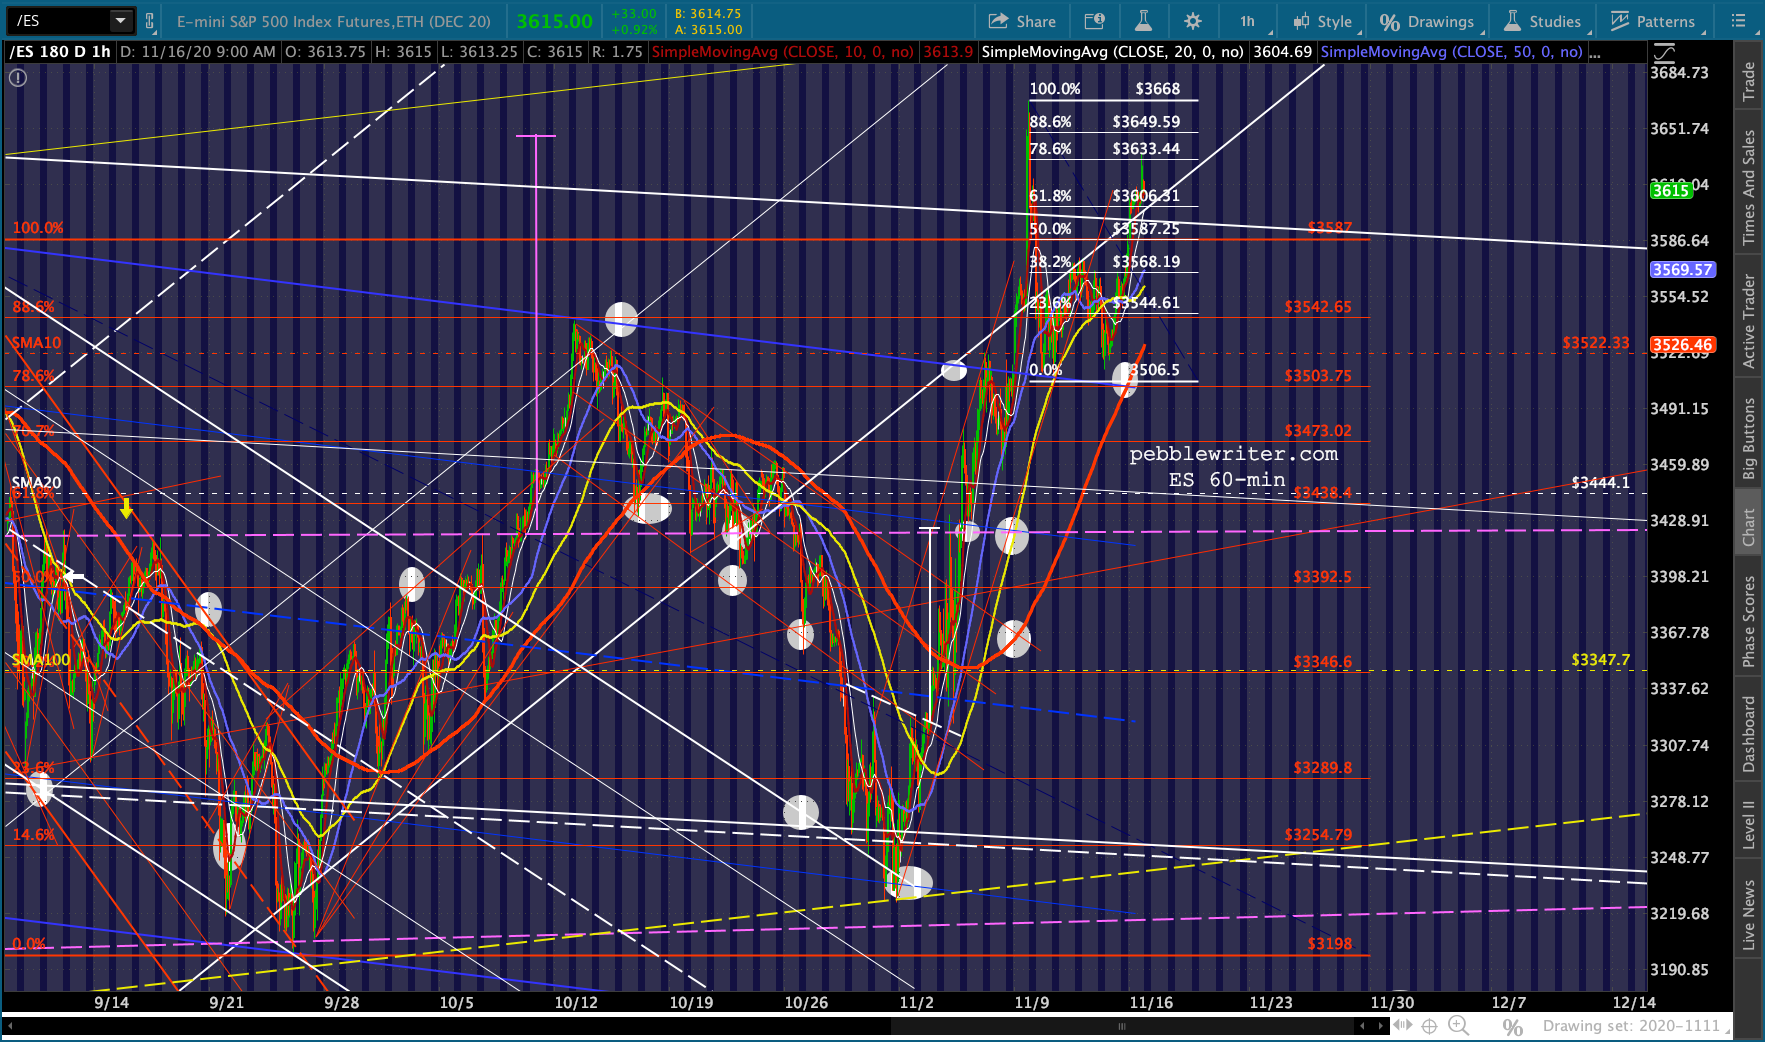
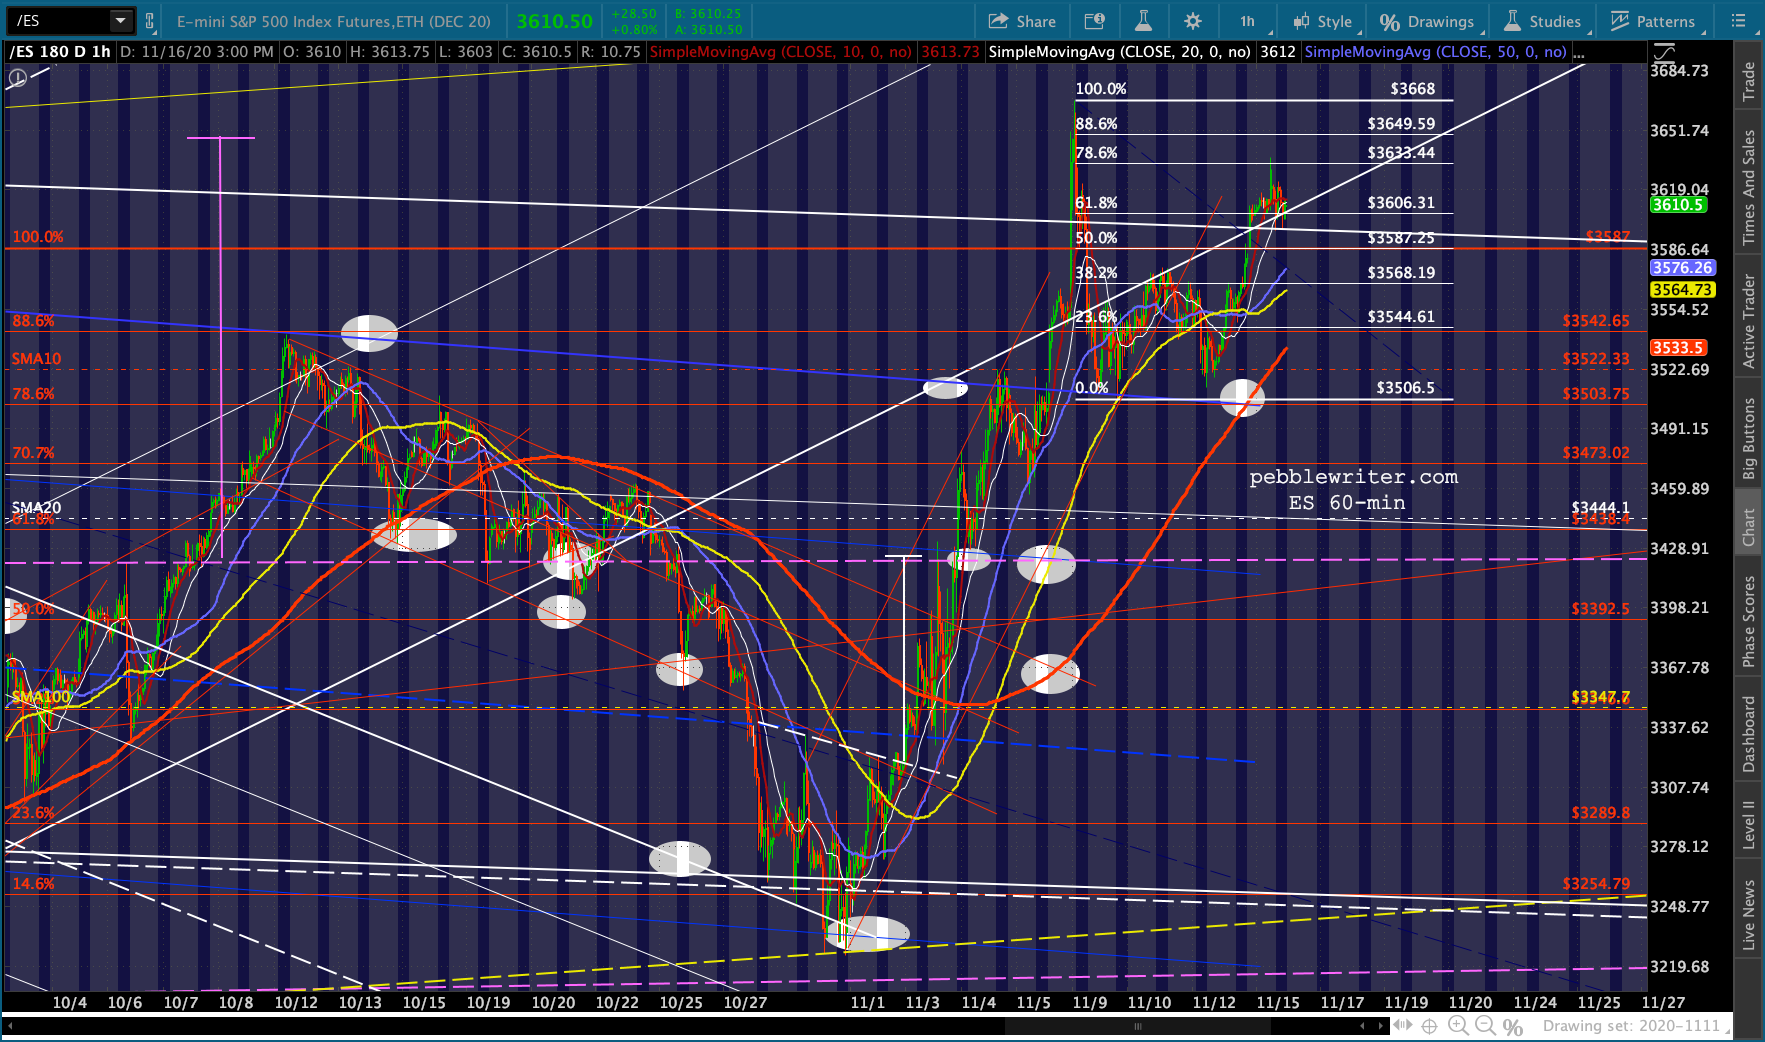
 This has enabled ES to continue backtesting the bottom of the broken white channel and, despite breaking down again, enabling a .786 retracement of the all-time high registered on Nov 9.
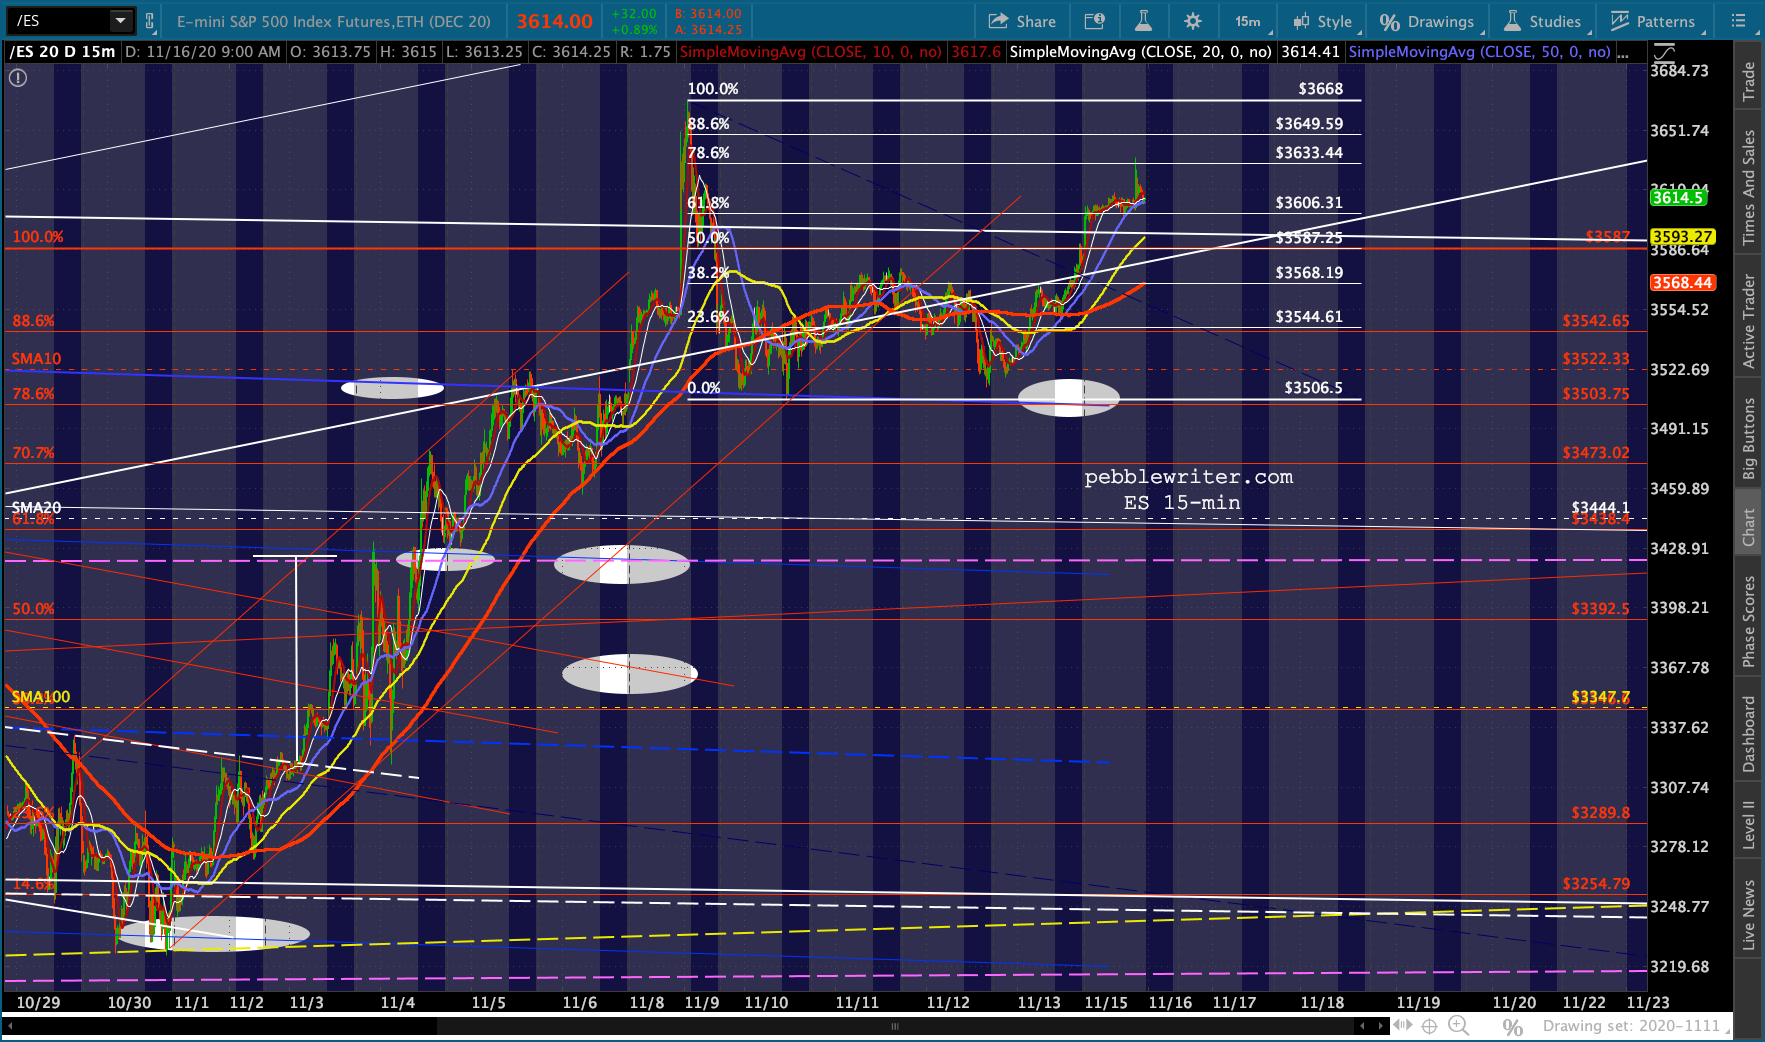
 Ditto for SPX – which has made higher highs since breaking down and backtesting.
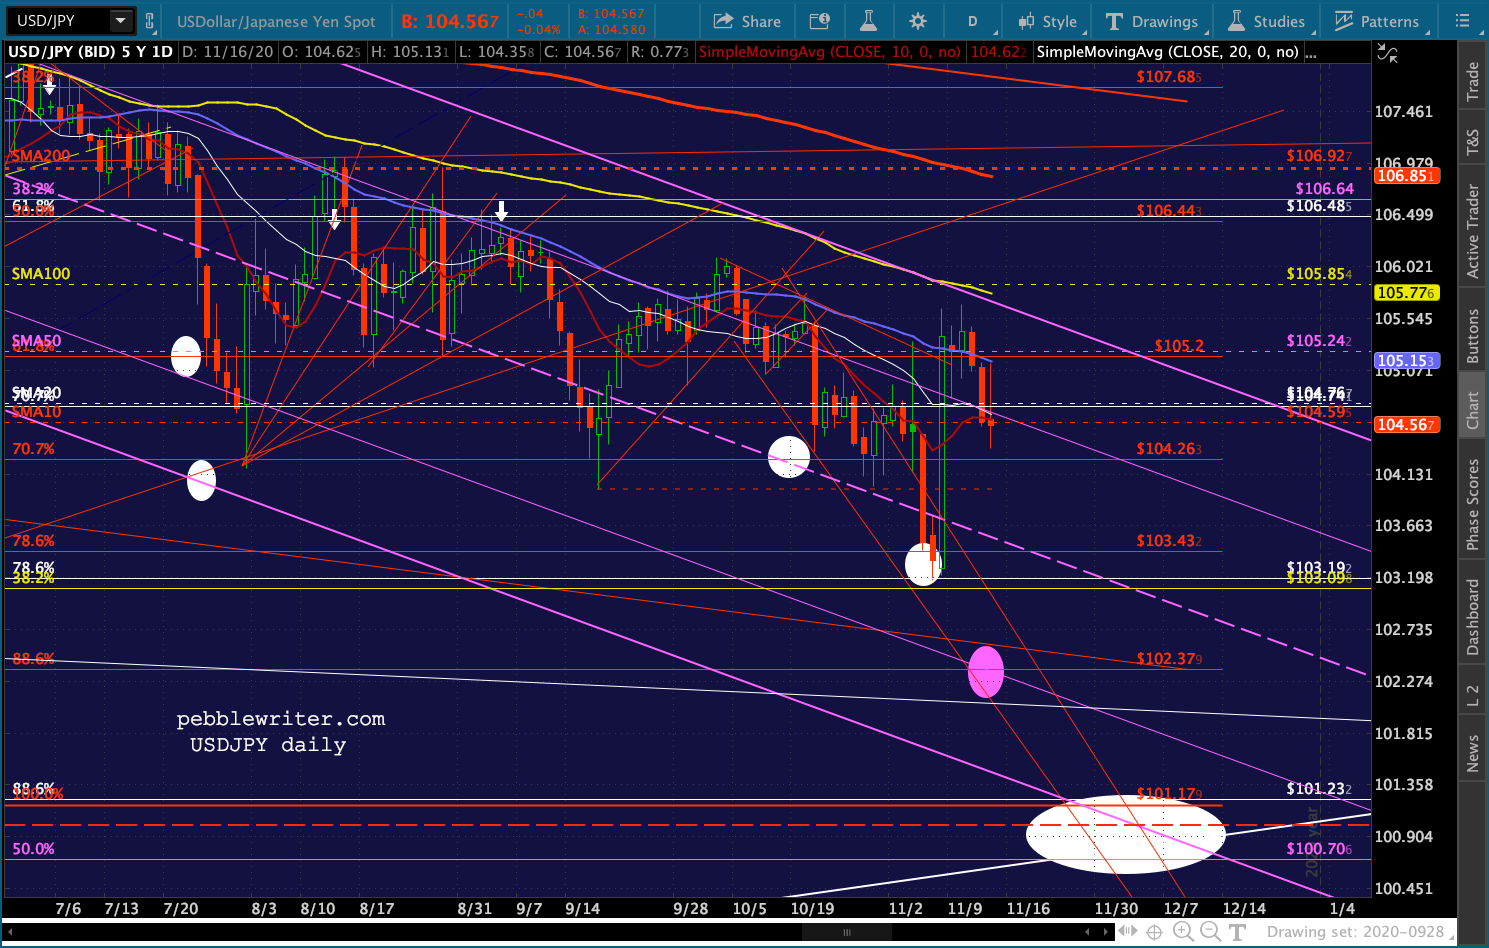
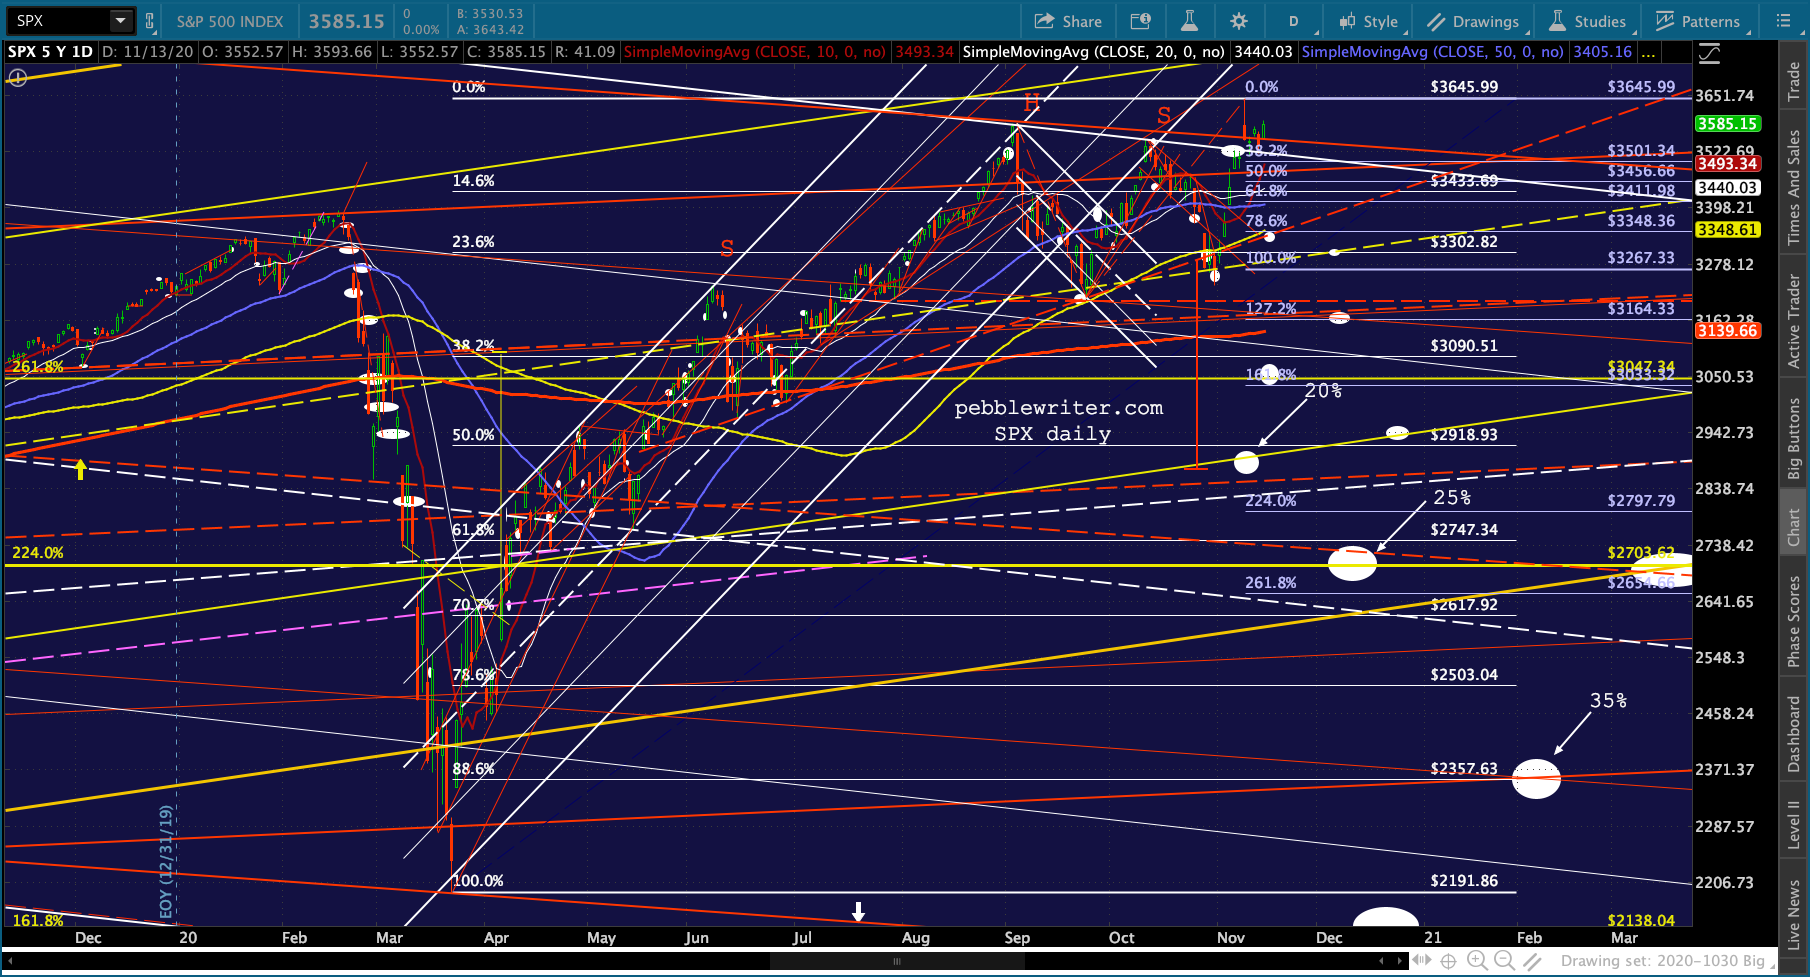 The currency markets have similarly remained supportive enough of stocks – with USDJPY once again declining to rip lower just yet.
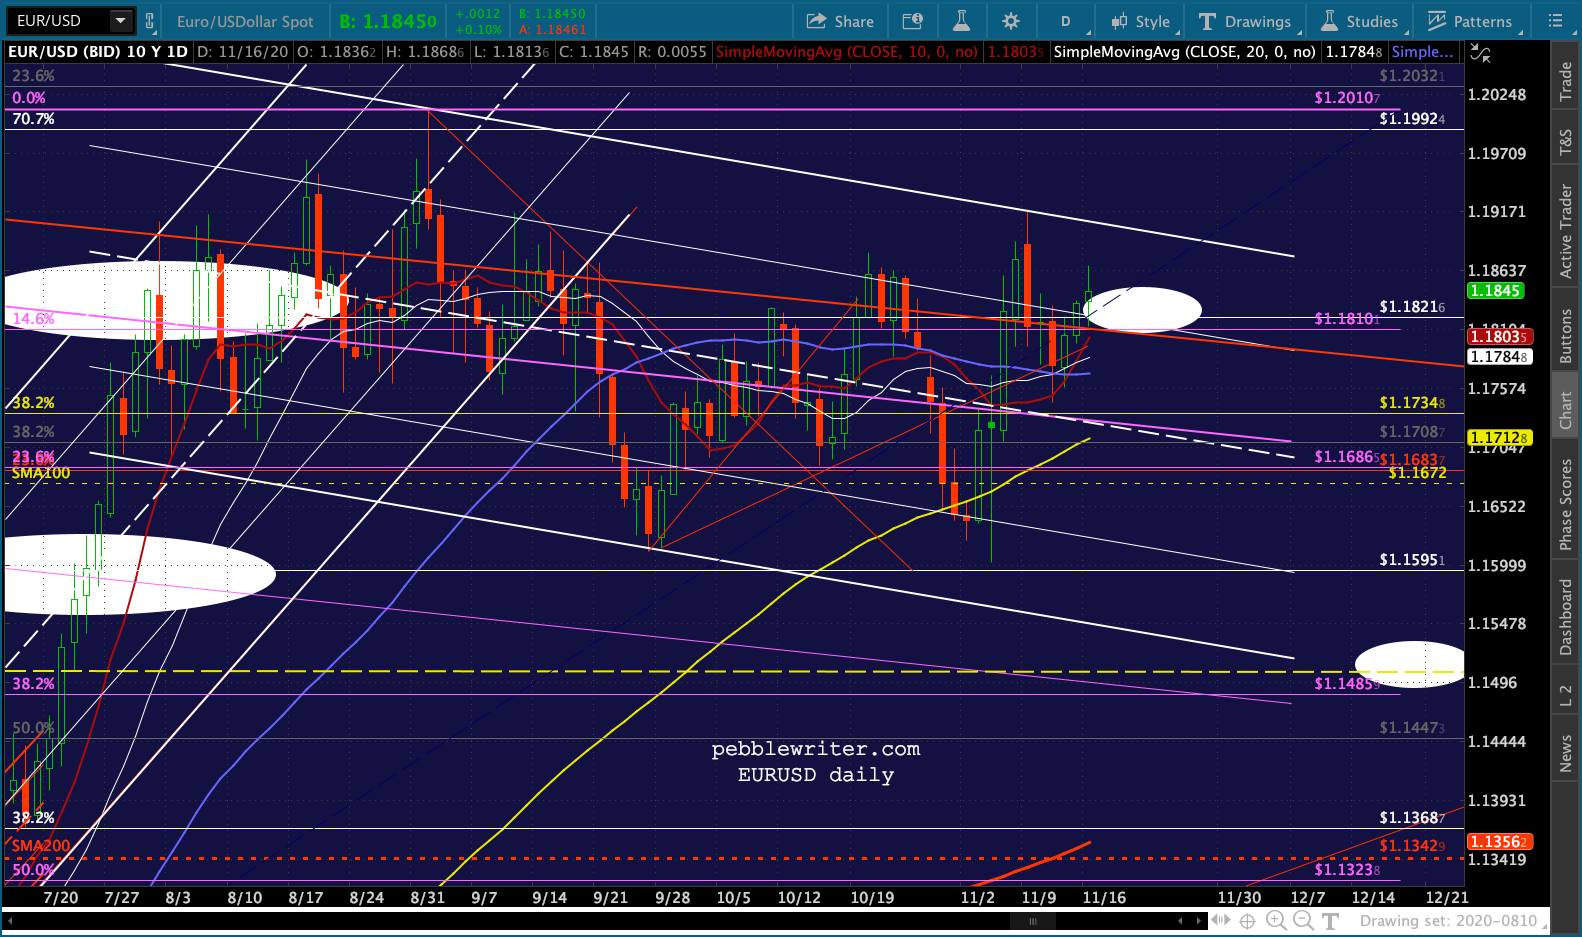
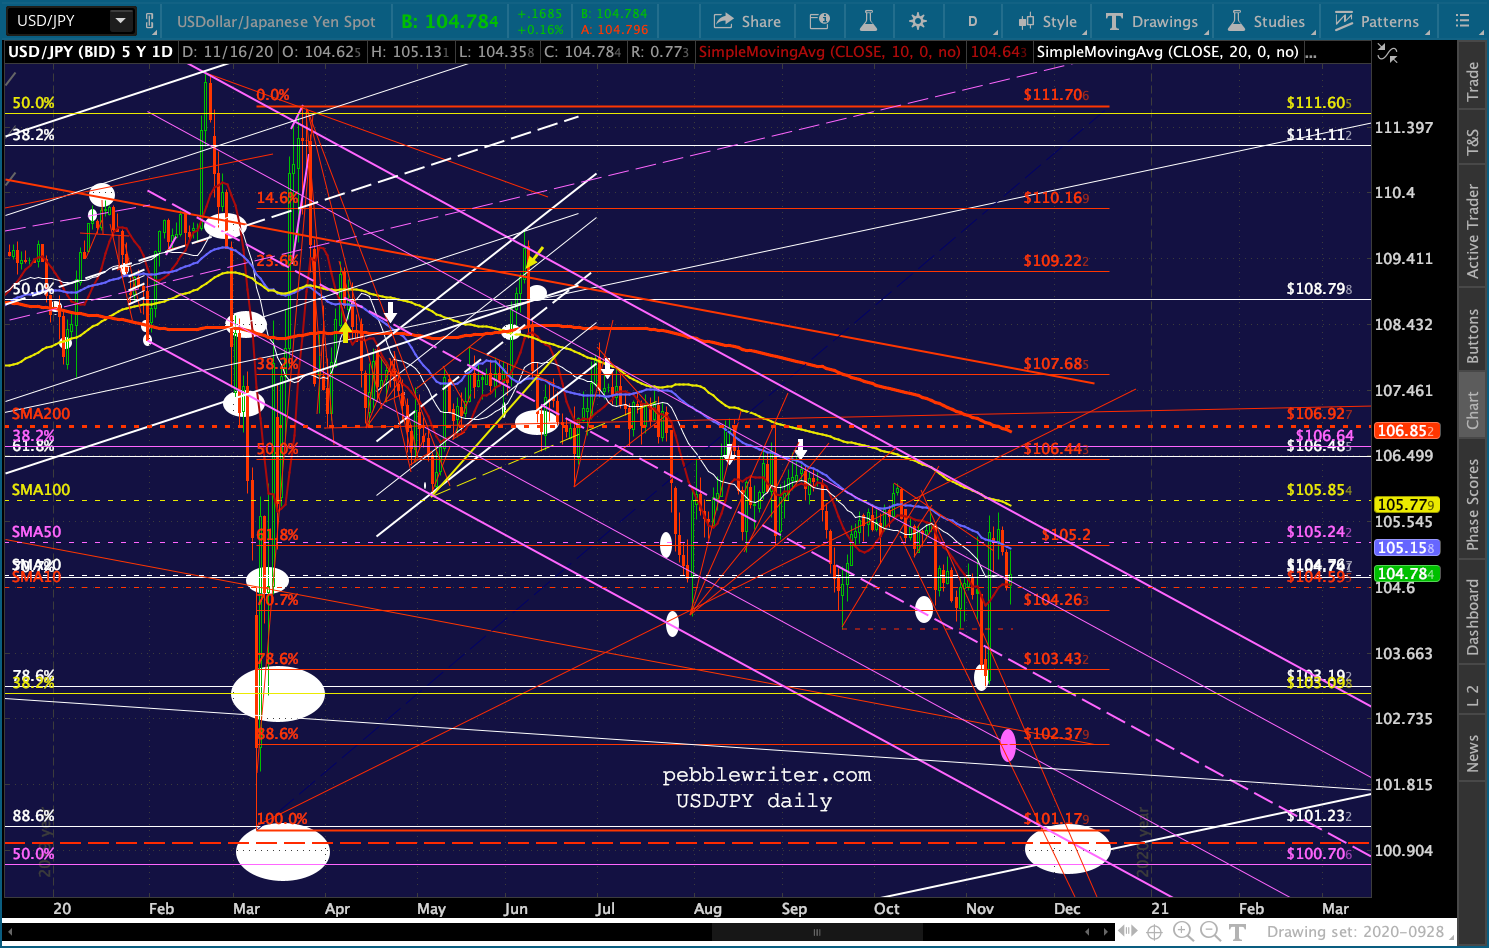 Combined with the EURUSD’s levitation…
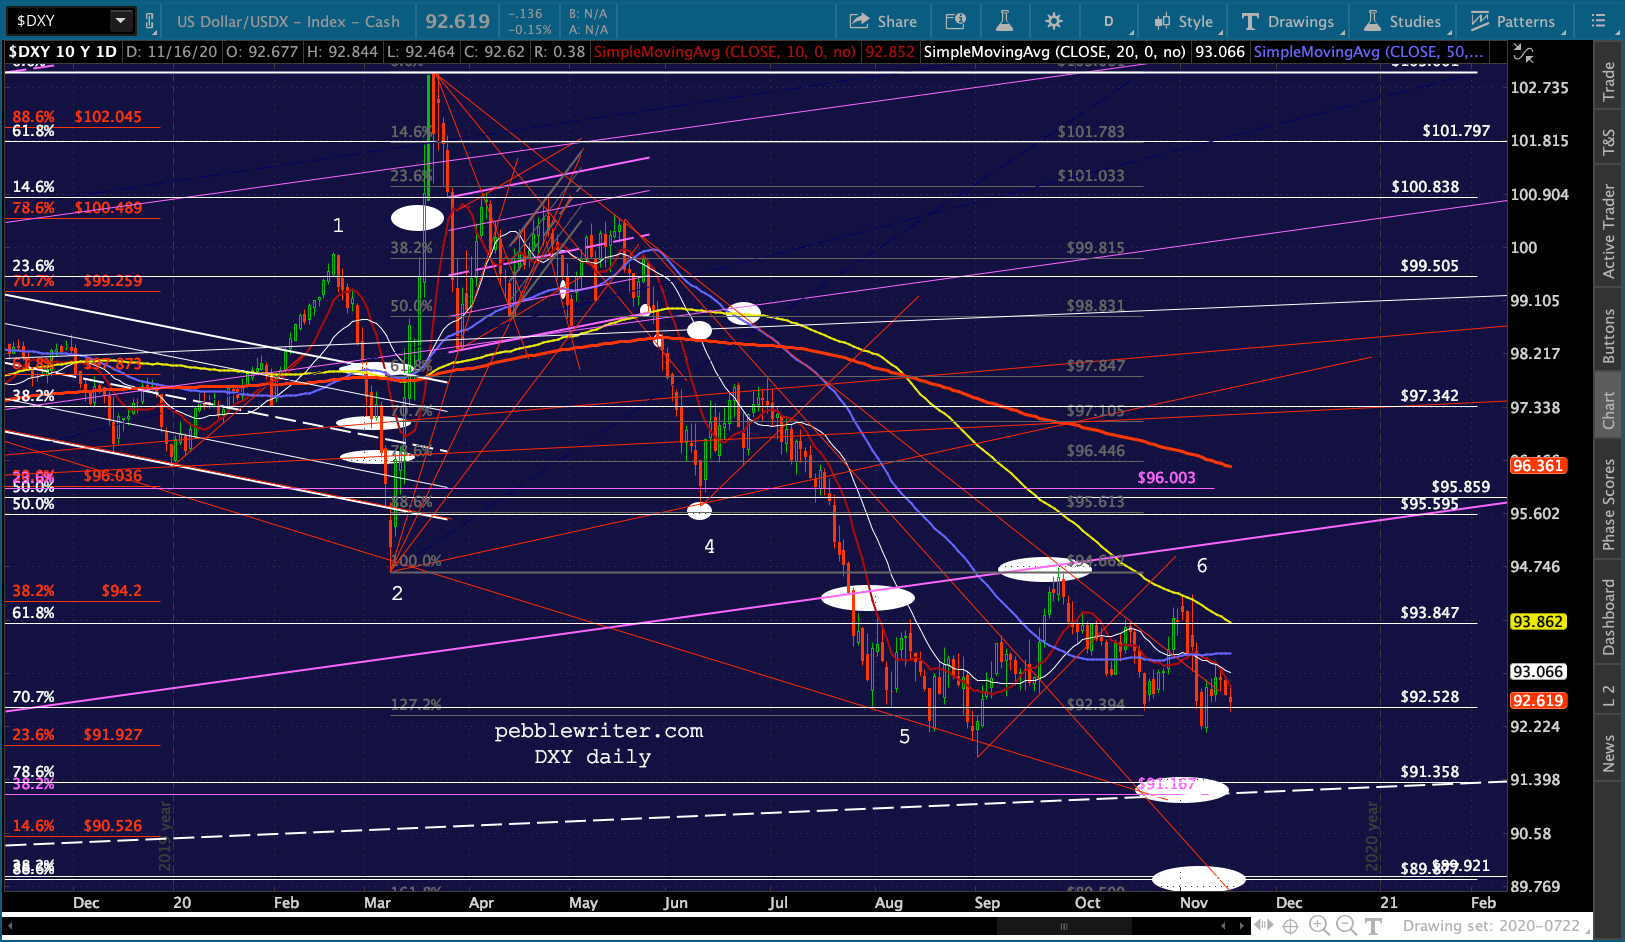
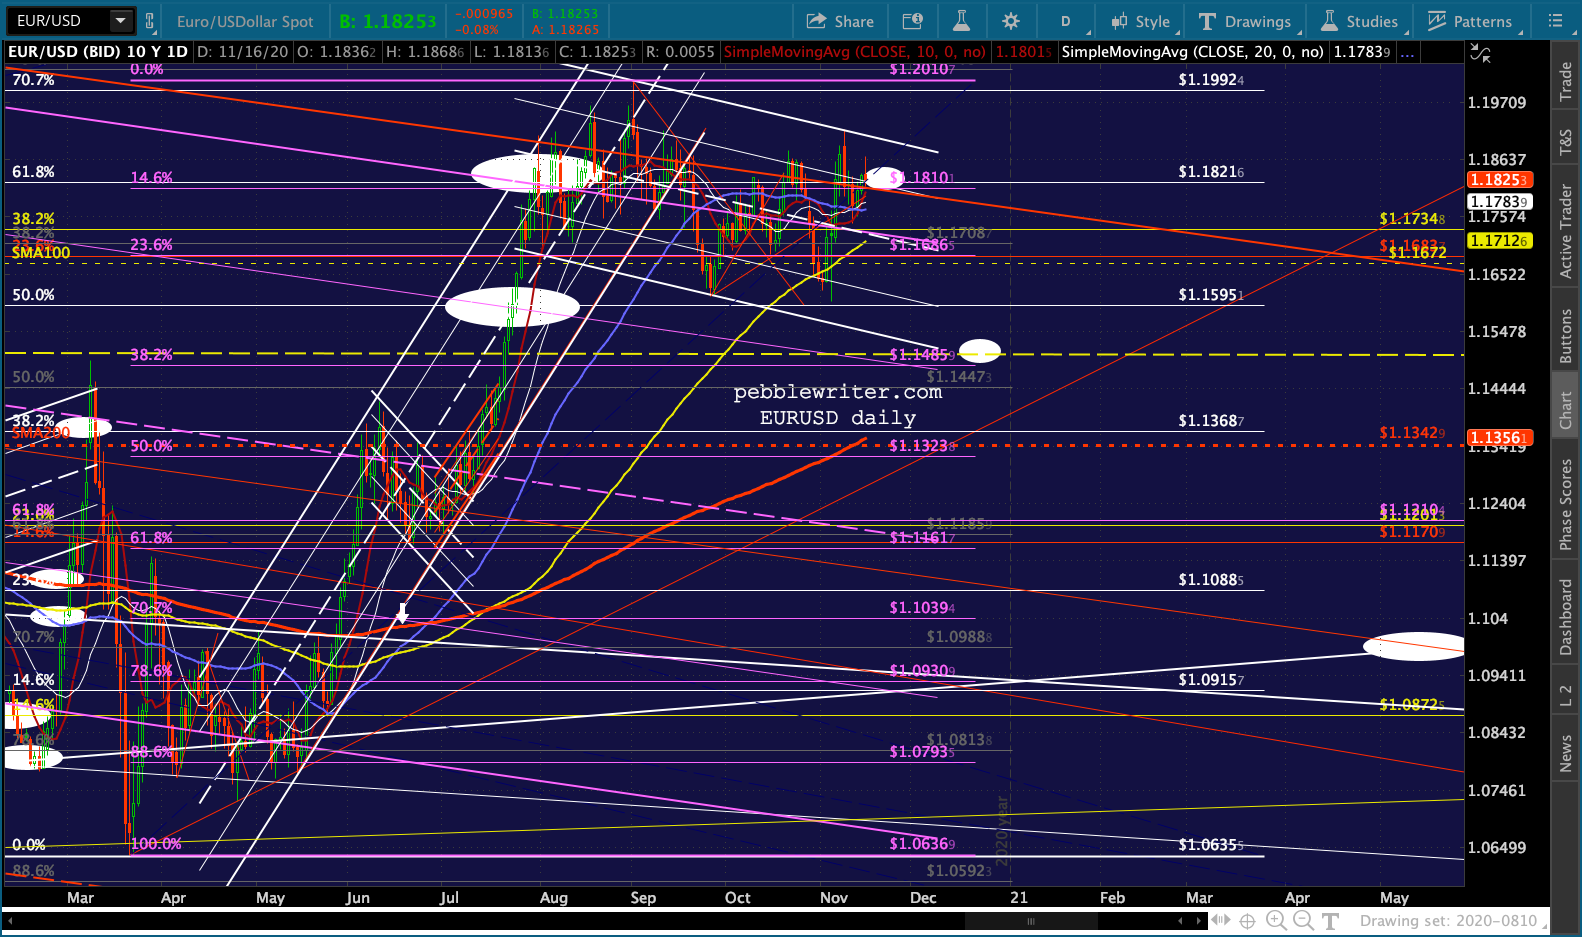 …this has resulted in a DXY which is taking its sweet time to reach constructive support.
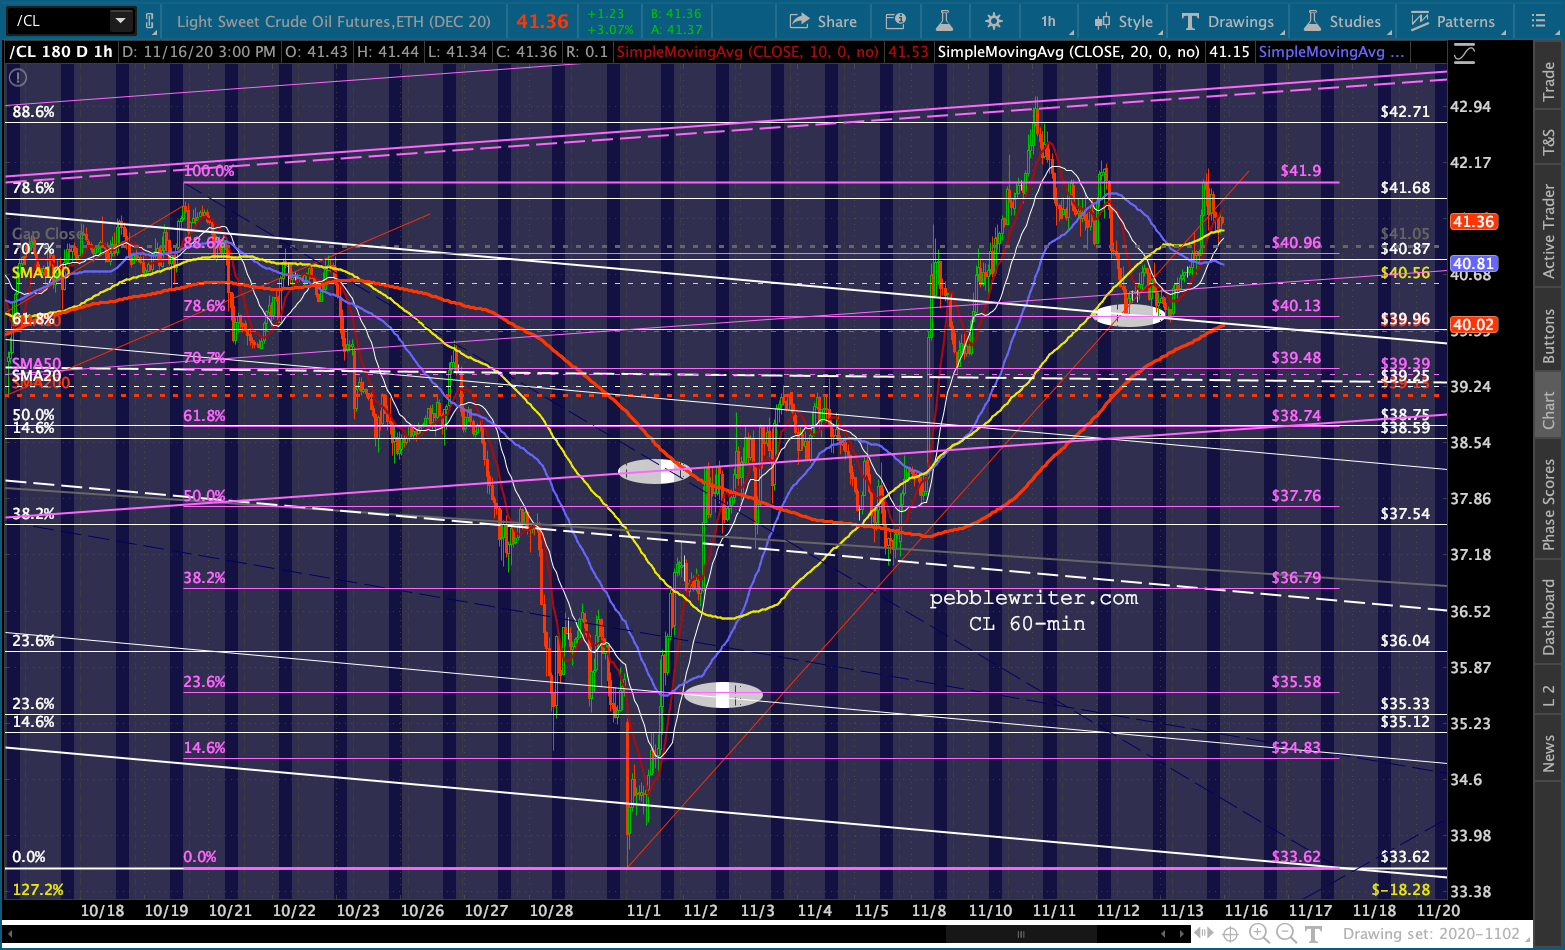
 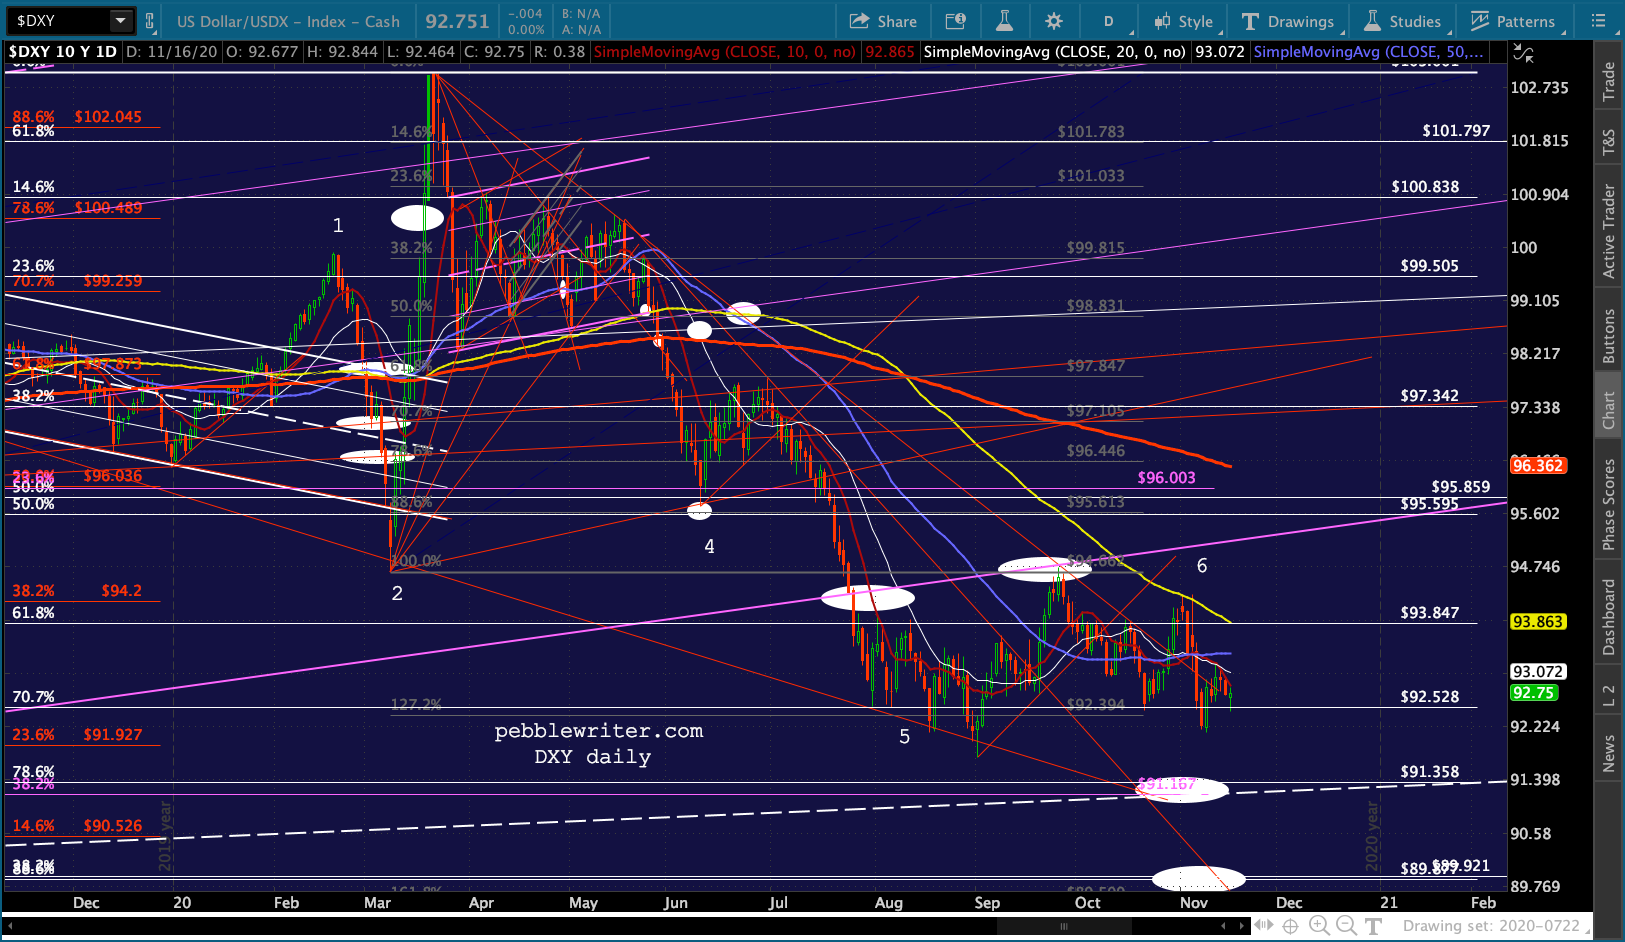 With infection and death rates rising sharply in the US and elsewhere…
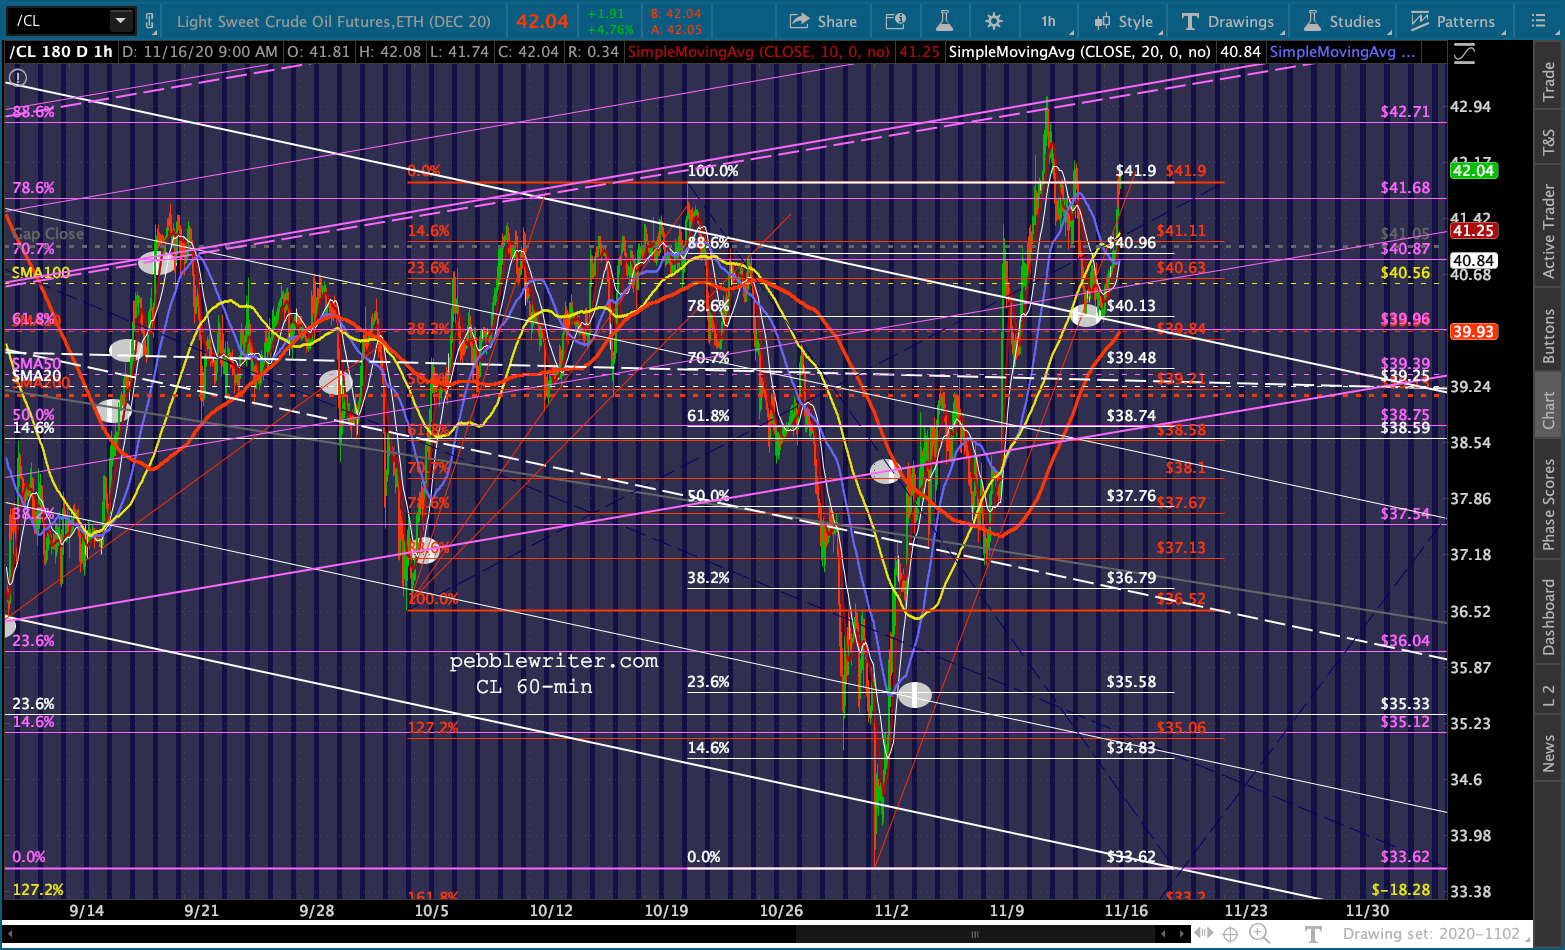
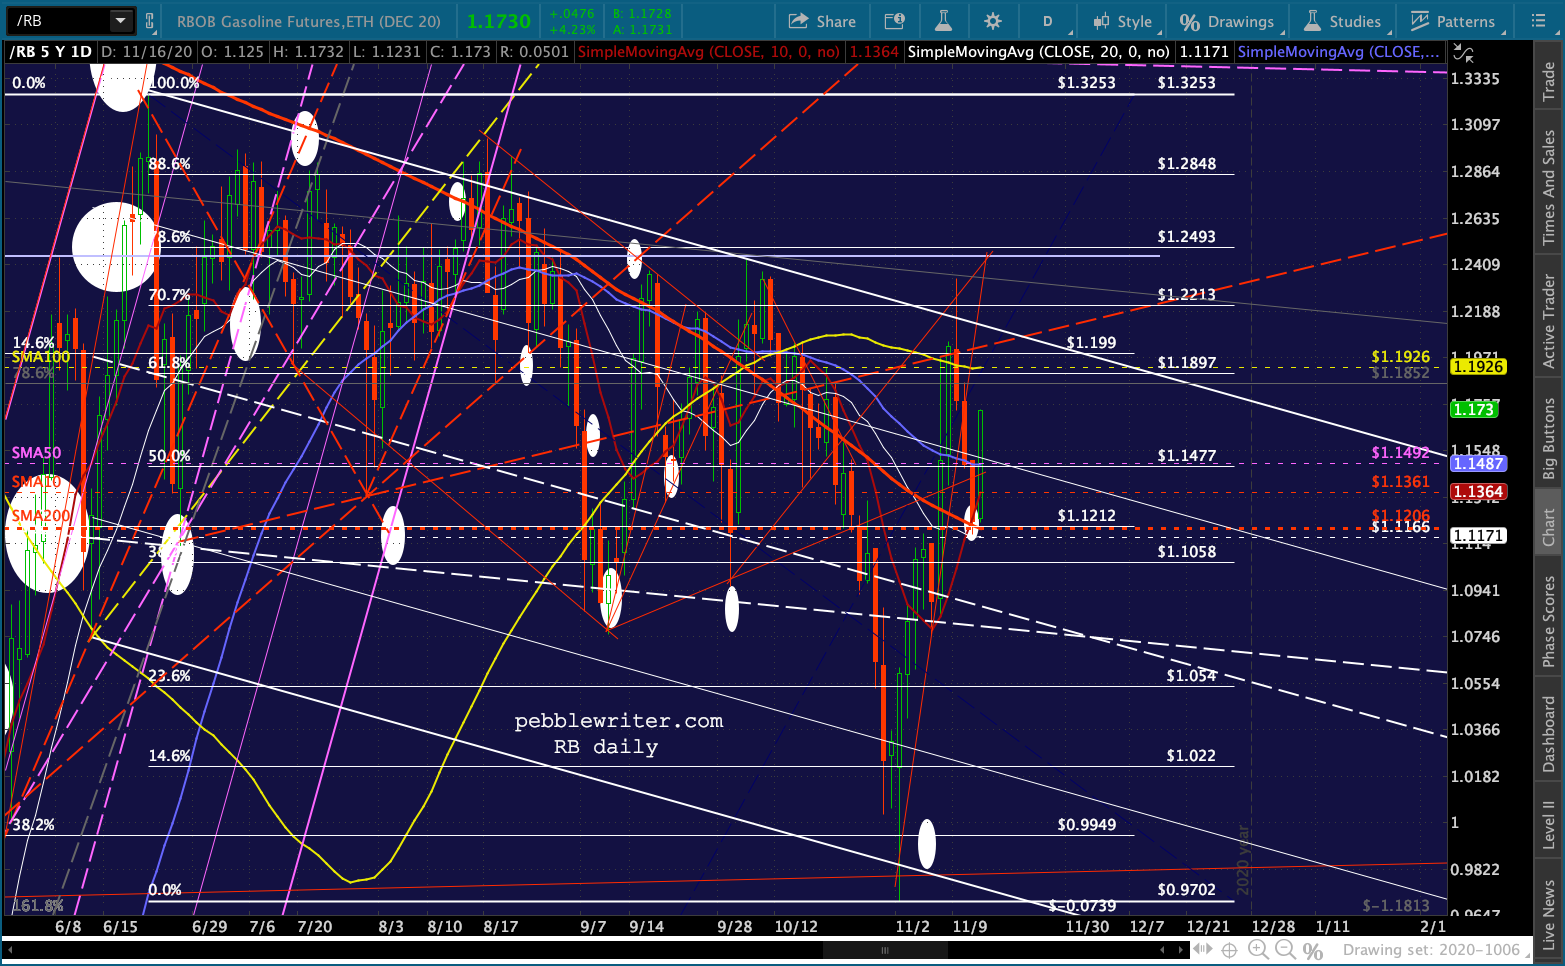
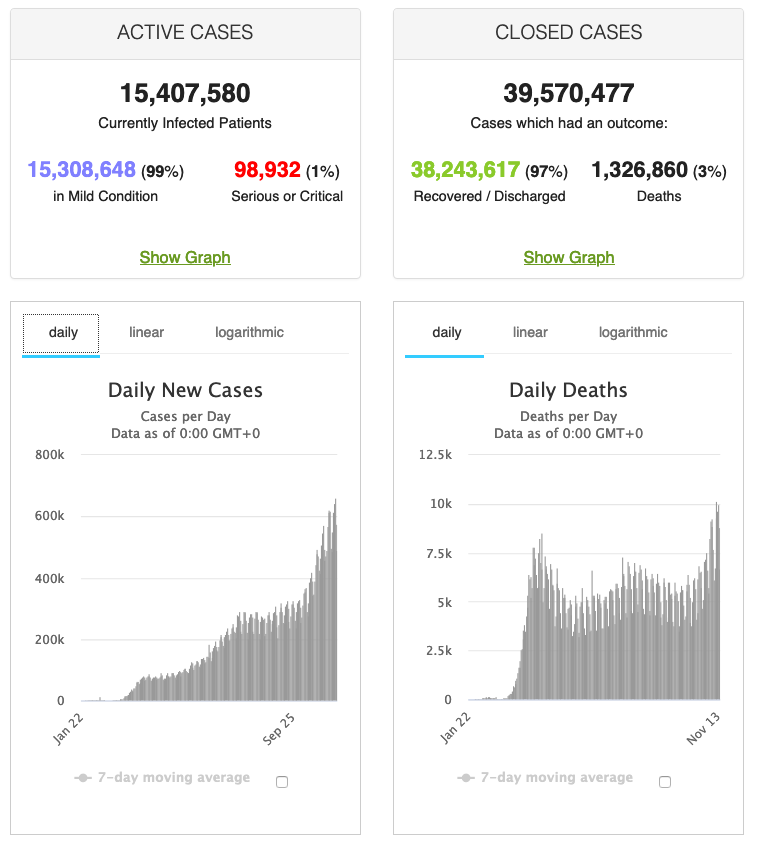 …one might think oil prices would be sliding. Yet, we’re seeing another sharp pre-market rally in both CL (which completed a Bat Pattern last Wednesday) and RB.
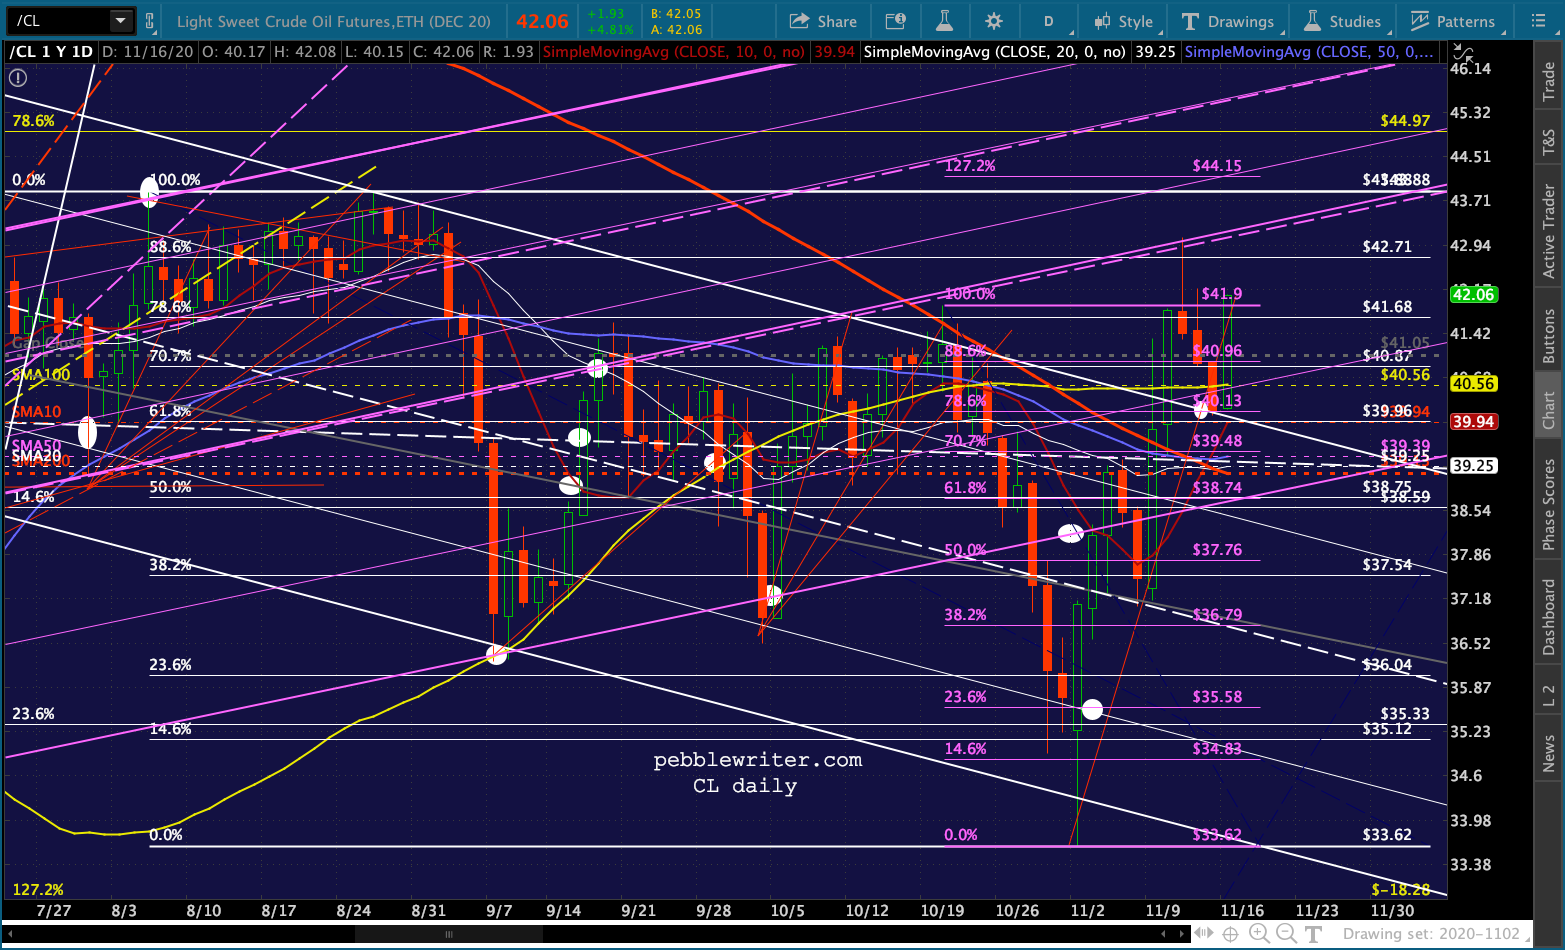
 UPDATE: 3:30 PM
The initial 30-pt ramp job has held up nicely so far. Note that the broken channel backtest hasn’t resulted in the channel bring re-joined. But, there’s nothing to keep ES from bumping successively higher along the underside of the channel.
This could go on all week and, given that Friday is OPEX, wouldn’t surprise anyone. By Dec 1, for instance, the channel bottom will have reached 3730.
 Our yield curve model is still warning of a correction by virtue of its breakout above the former highs at .69ish.
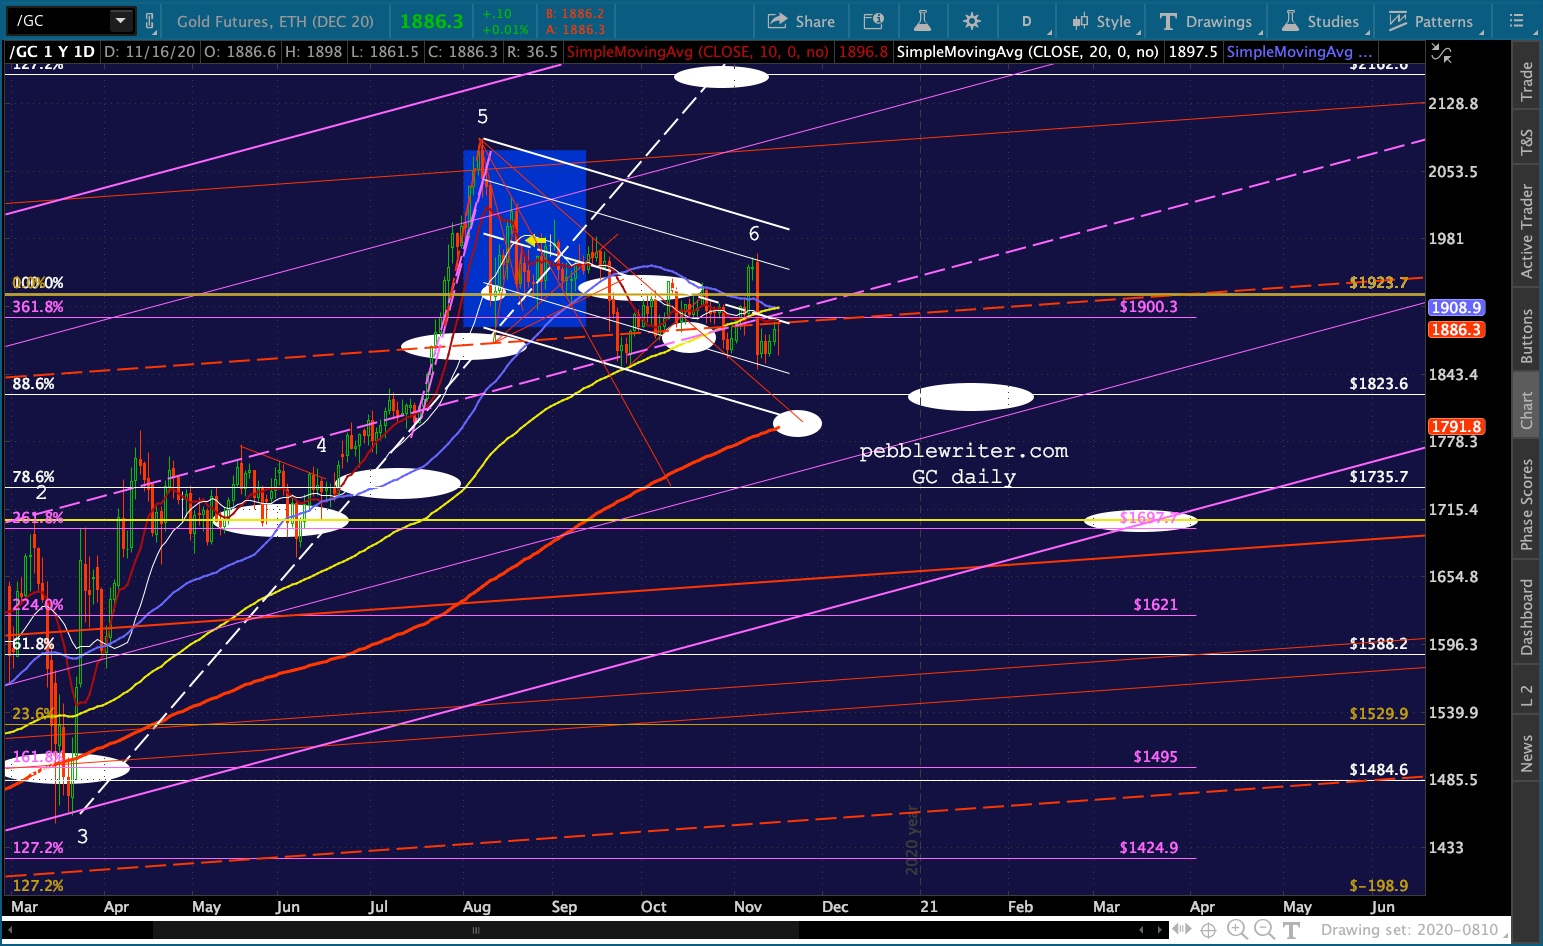
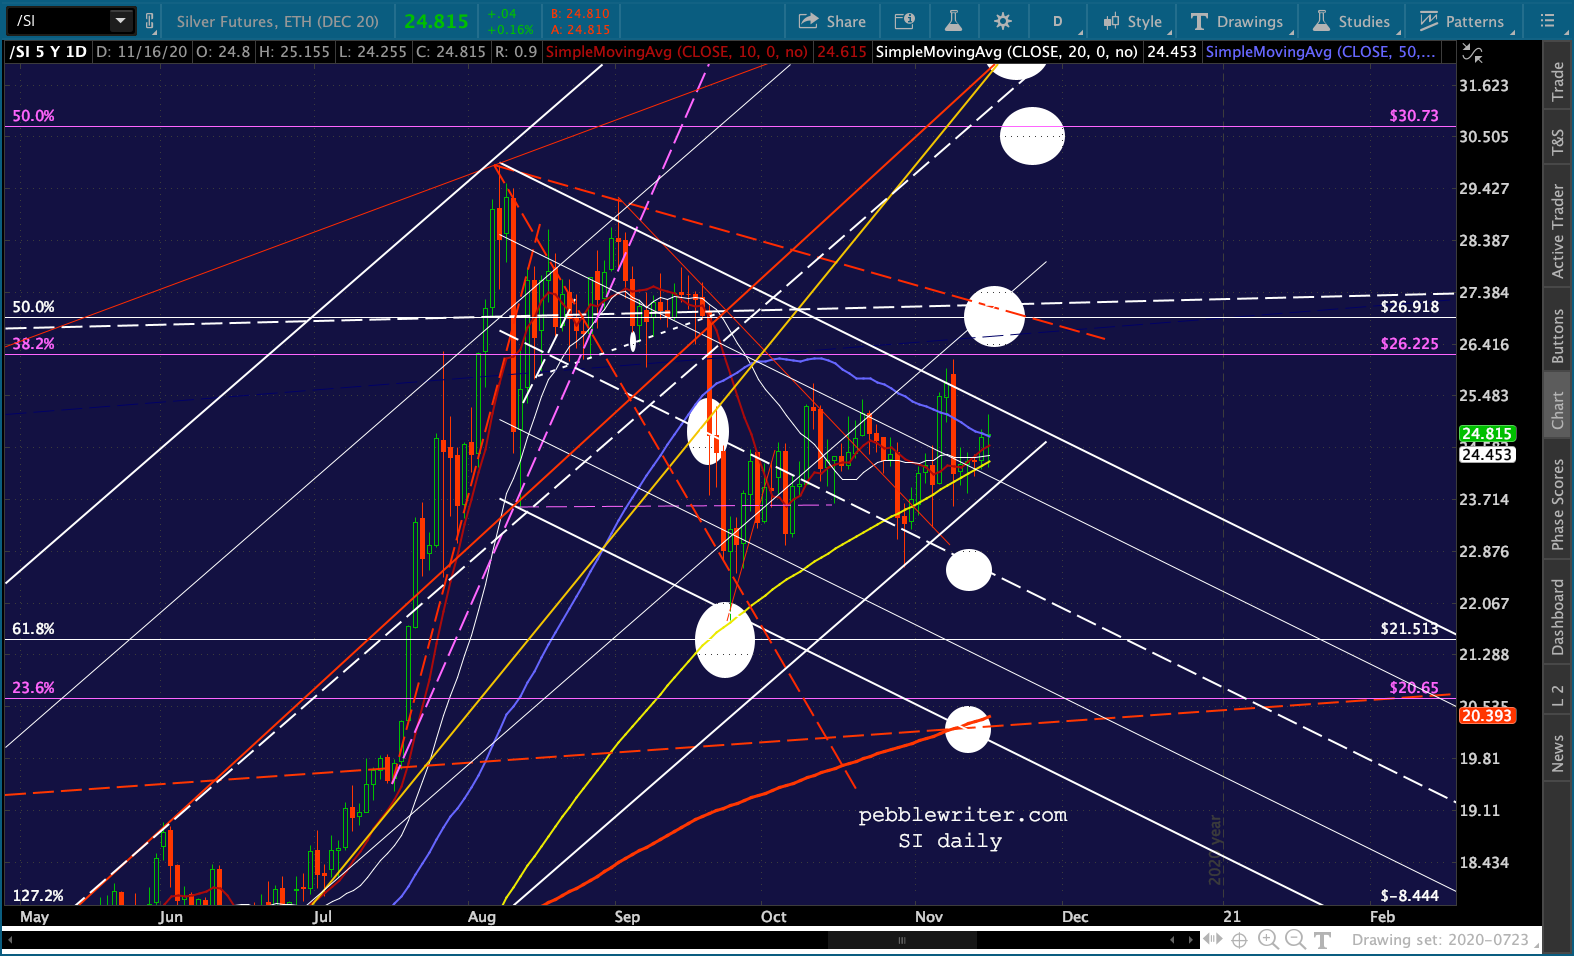
 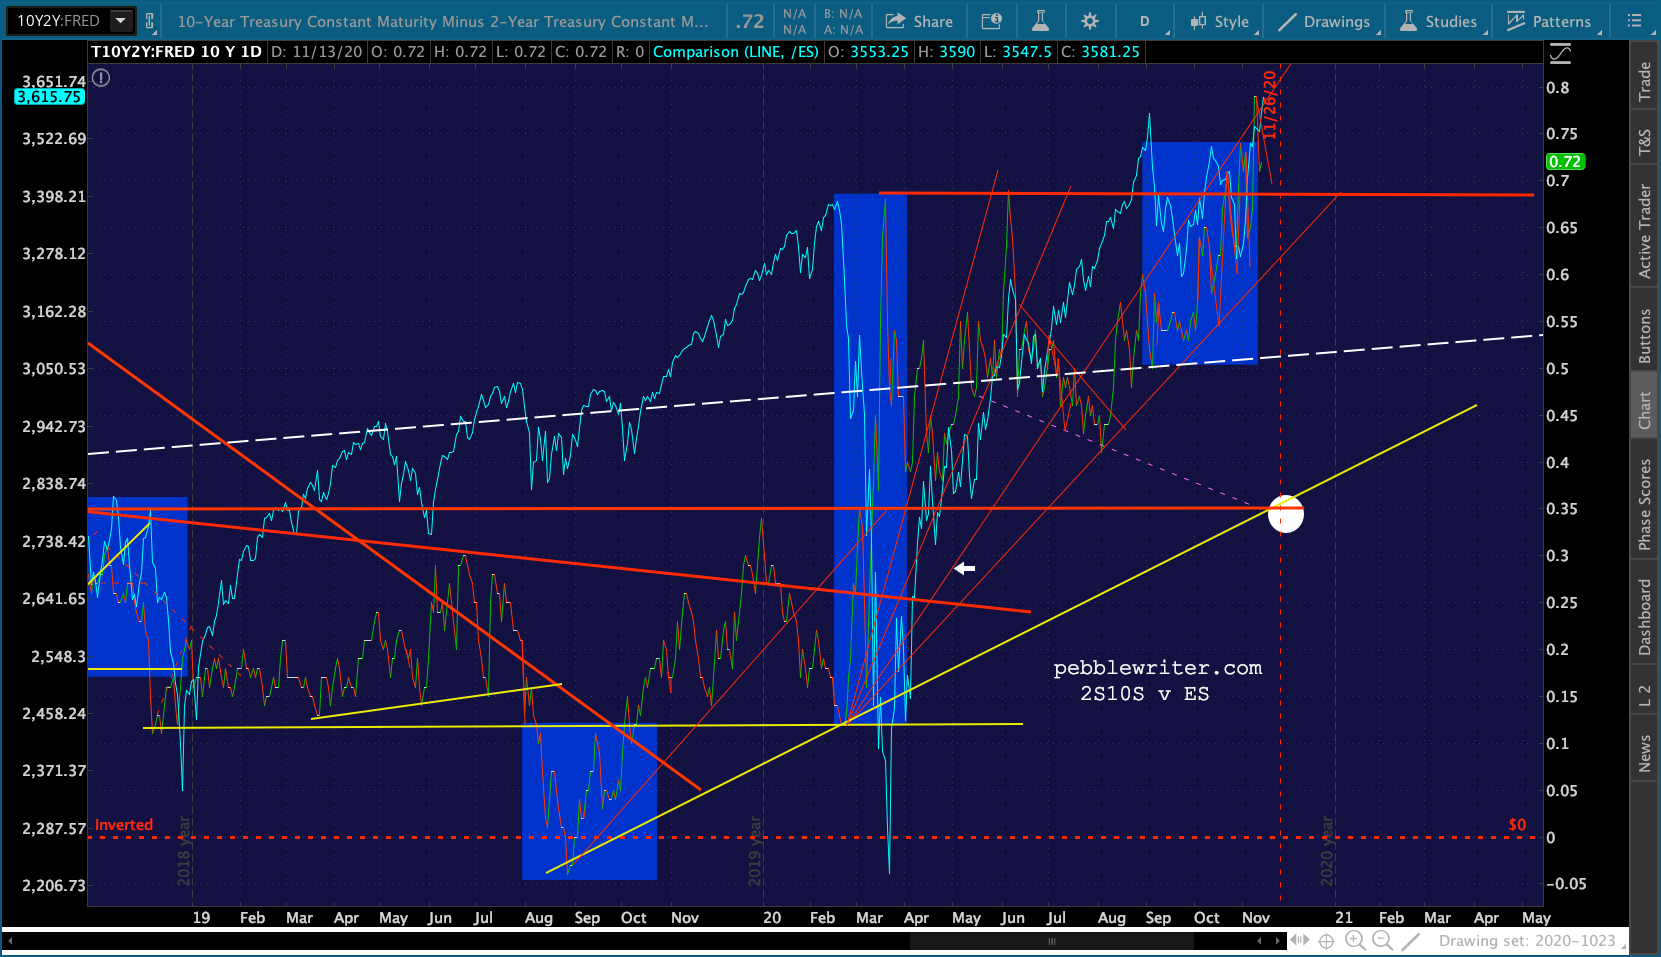 And, the triangle playing out in GC and SI suggest a denouement sometime around Nov 27 – the Friday after Thanksgiving when markets are open but volume is so low that equity prices could easily be “managed.”