

 The headlines on June 29, 2006 were fairly unremarkable. The House voted to end the offshore drilling ban. The Devil Wears Prada was being released in theaters. And, the Senate confirmed new Treasury Secretary
 Lord Voldemort Hank Paulson — who was paid $48 million to take the job and subsequently ushered in the worst financial crisis since the Great Depression.
It was also the last time the FOMC increased the Fed Funds rate (the 17th hike in a row, to 5.25%.) I’ve scoured the news, and can’t find a single headline from back then warning of impending financial armageddon from the increase.
In fact, the market rallied 2.1% over the next several days — before shedding 4.4% a week later. But, beyond the immediate effects, two things stand out from the historical data:
- the S&P 500 gained 26.5% over the next 16 months as the FOMC reversed course and lowered rates through the peak in Oct 2007 (and, of course, throughout the subsequent crash)
- the FOMC had no frikkin’ idea how to manage the economy via rate changes.
Now, 3,451 days later, we’re told the Fed might raise rates again. How can we expect the “markets” to react?
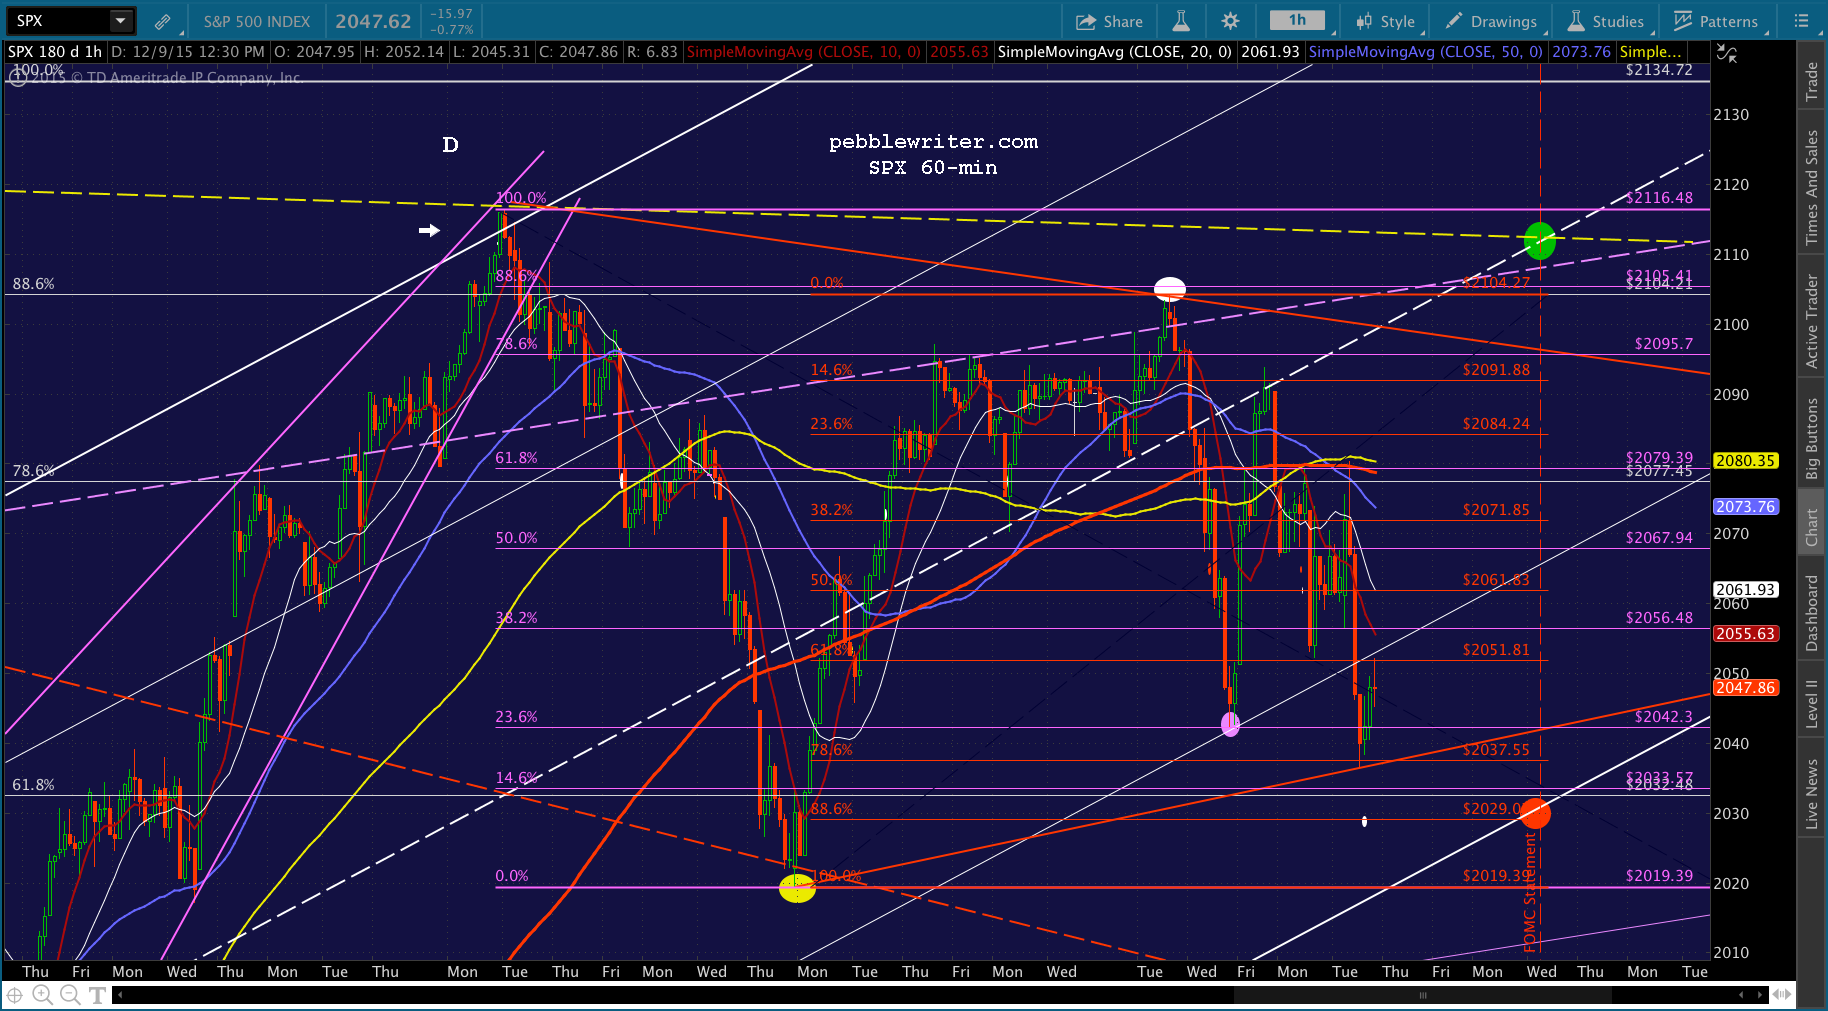
continued for members…We’ll focus on the big picture in this space throughout the day, in between commenting on intraday moves down below. Here’s a primer of likely upside and downside targets I put together for later discussion.
 The relationship between interest rates and stock prices is a complex one. At the risk of oversimplifying it…
In general, higher interest rates have a negative effect on stocks because they increase the cost of doing business for the underlying corporations and, from a valuation standpoint, depress the present value of future earnings.
But, fixed income instruments are substitutes for stocks. So, when stocks are judged to be overpriced or potentially too volatile, some money moves into fixed income instruments of varying maturities — driving up prices and, thus, depressing yields. This is a fear trade.
The converse of the fear trade is that investors see great opportunities in stocks and shift money out of bonds. Bond prices fall and yields rise — presumably reflecting a rosy outlook.
These assumptions have proven to be mostly accurate over the years. But, things have changed since central banks began artificially depressing yields and boosting stock prices with the advent of QE.
 In every instance since 1999, lower interest rates were accompanied by a drop in stock prices. From roughly Dec 2013 thru Feb 2015, however, 10 yr yields dropped from 3.0% to 1.65% while SPX climbed 15%. Here’s a closer look:
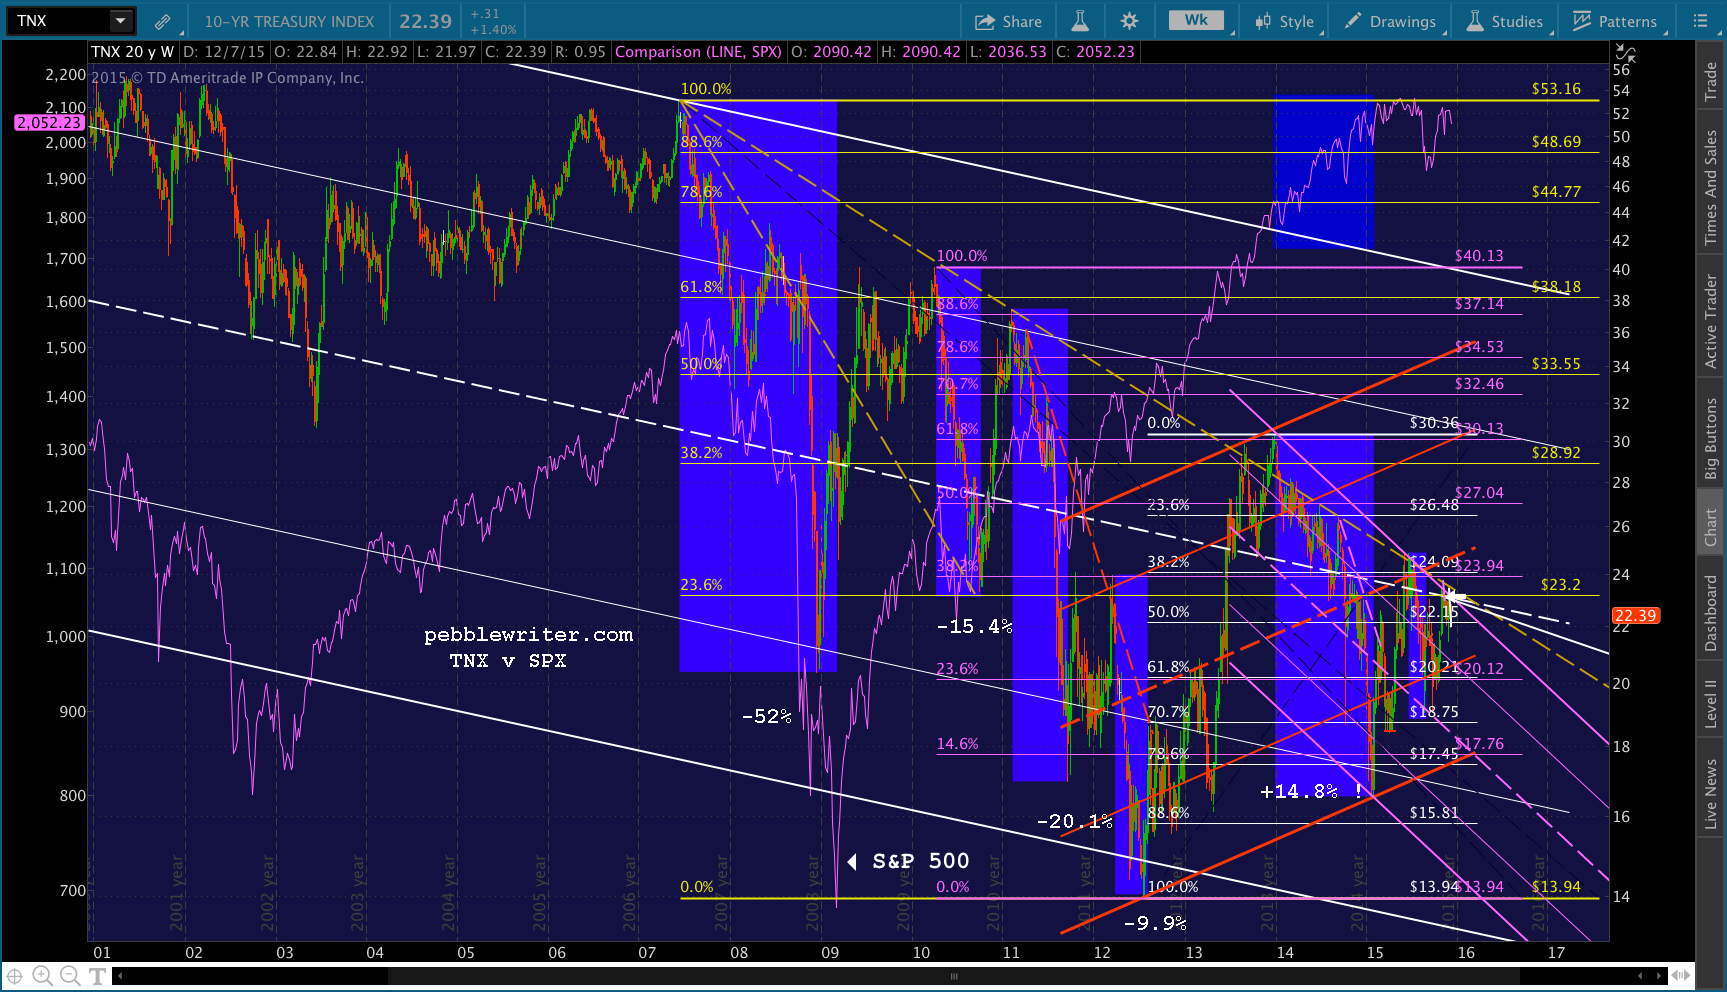 Graphs comparing stocks and the short end of the curve, of course, are completely nonsensical. Beginning in 2008, fed funds went to zero and stayed there. FRED doesn’t offer SPX prior to 2006, so I’ve sketched a rough approximation of what went down.
 The chart does show, however, that lowering rates did nothing to drive SPX higher. Keeping rates at zero for the past six years did.
Again, from a fundamental standpoint, it makes perfect sense. If I can borrow no cost and invest in a venture that has even a marginally positive cash flow, I’m making money. And, the value of that cash flow is higher in a zero rate environment.
But, what happens when those companies are forced to pay higher interest? All those marginally profitable ventures are suddenly a drag on cash flow and thus earnings. And, those future earnings aren’t worth as much anymore because the discount rate has risen.
So, we have a conflict. Higher rates can sap companies of earnings, but can also be a sign of increasing optimism. And, that’s where Central Banks come in. By insisting that higher rates are necessary because the economy is heating up, the Fed is peddling economic snake oil.
The Fed is hoping investors will buy the premise that higher rates are necessary because the economy is heating up. Whether they’re successful in peddling this economic snake oil will depend entirely on how the “market” reacts to an increase in rates.
We know they can drive SPX higher just about any time they like by ramping USDJPY or CL higher. If they’re successful in forcing stocks higher in the wake of the announcement, then investors will have no choice but to buy the narrative — whether or not it makes any sense.
And, that’s where I’ll leave you, dear readers. It’s going to come down to whether the force of market manipulation the Fed, BoE, ECB and BoJ unleash can overcome common sense. I think they can, especially with the Christmas holidays coming up. It worked in 2013.
SPX tagged 1823, the 1.272 extension of the drop from 1576 in 2007 to 666 in 2009, on Friday, Dec 20. On Monday the 23rd, with 90% of investment managers on holiday, it popped up to 1829. On Christmas Eve, it slipped a little higher still. By the 31st, it was up to 1849.44. It topped 1850 on January 15th.
From then on, it was a matter of defending the previous day’s highs. Dips were recklessly bought, ES ramped overnight, USDJPY ratcheted higher almost every day, etc. It can be done.
Will they be able to do it again? I truly hope I’m wrong, but I can’t see why not. And, it will have virtually nothing to do with micro- or macroeconomics, fundamentals, earnings, who’s in the White House, etc.
Having said all that, there is one other possibility that shouldn’t be completely ignored. As we’ve seen in the past, a sudden, severe plunge in stocks can be very effective in changing the FOMC’s plans.
Were SPX to drop to, say, 1920, 1856 or 1823 in the next several sessions (6.4, 9.6 or 11.2%), there’s a pretty good chance that the Fed would delay actual implementation of a rate hike.
Stay tuned.
* * * * *
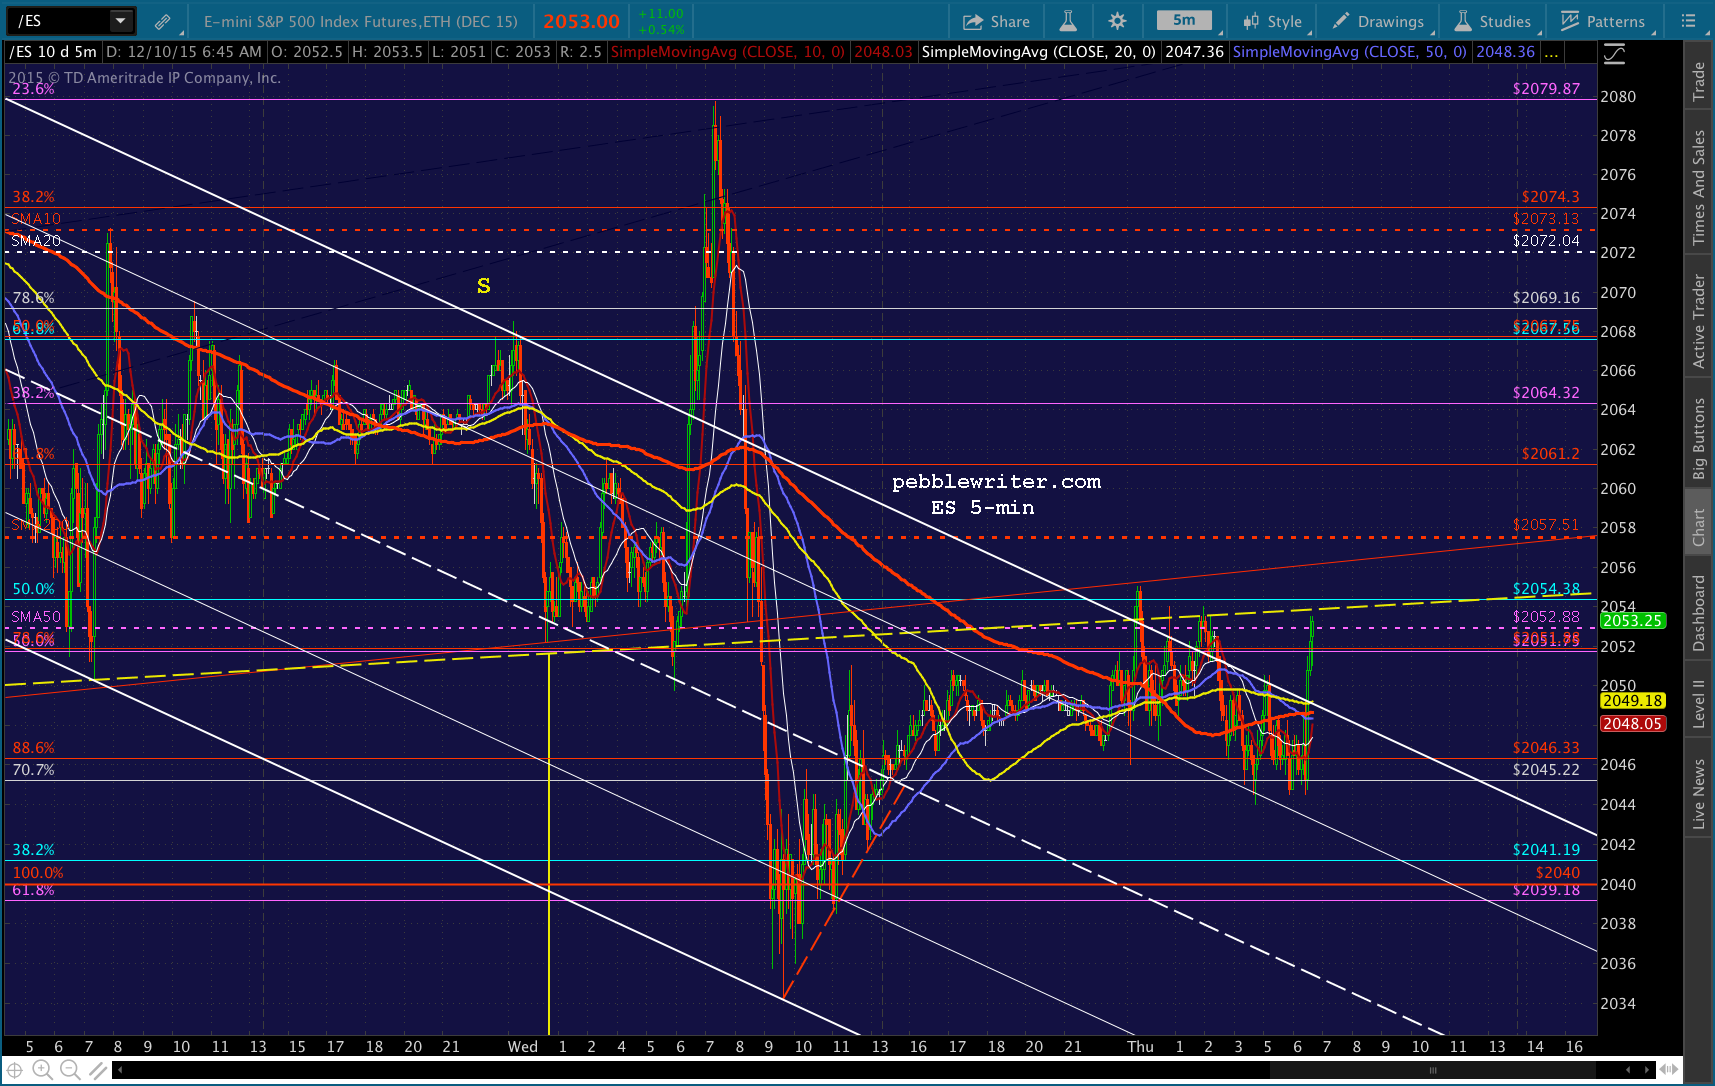
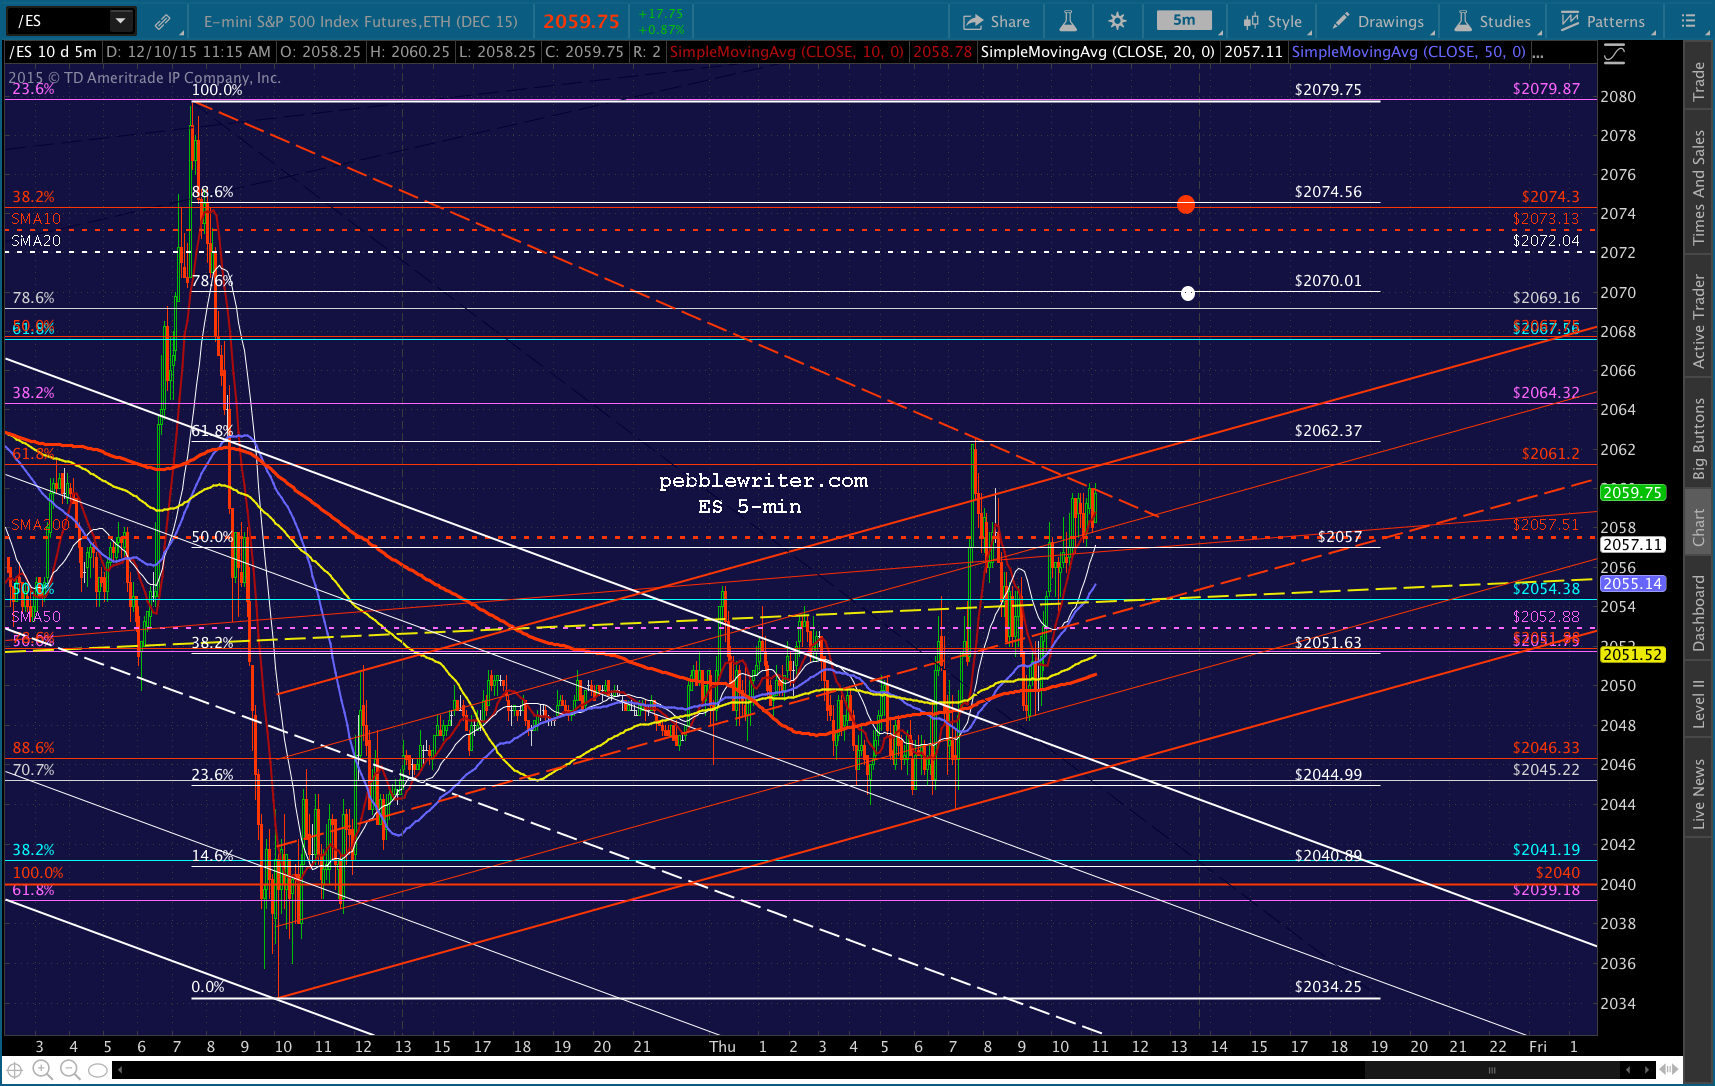
Yesterday, ES completed its H&S Pattern, backtesting the neckline overnight.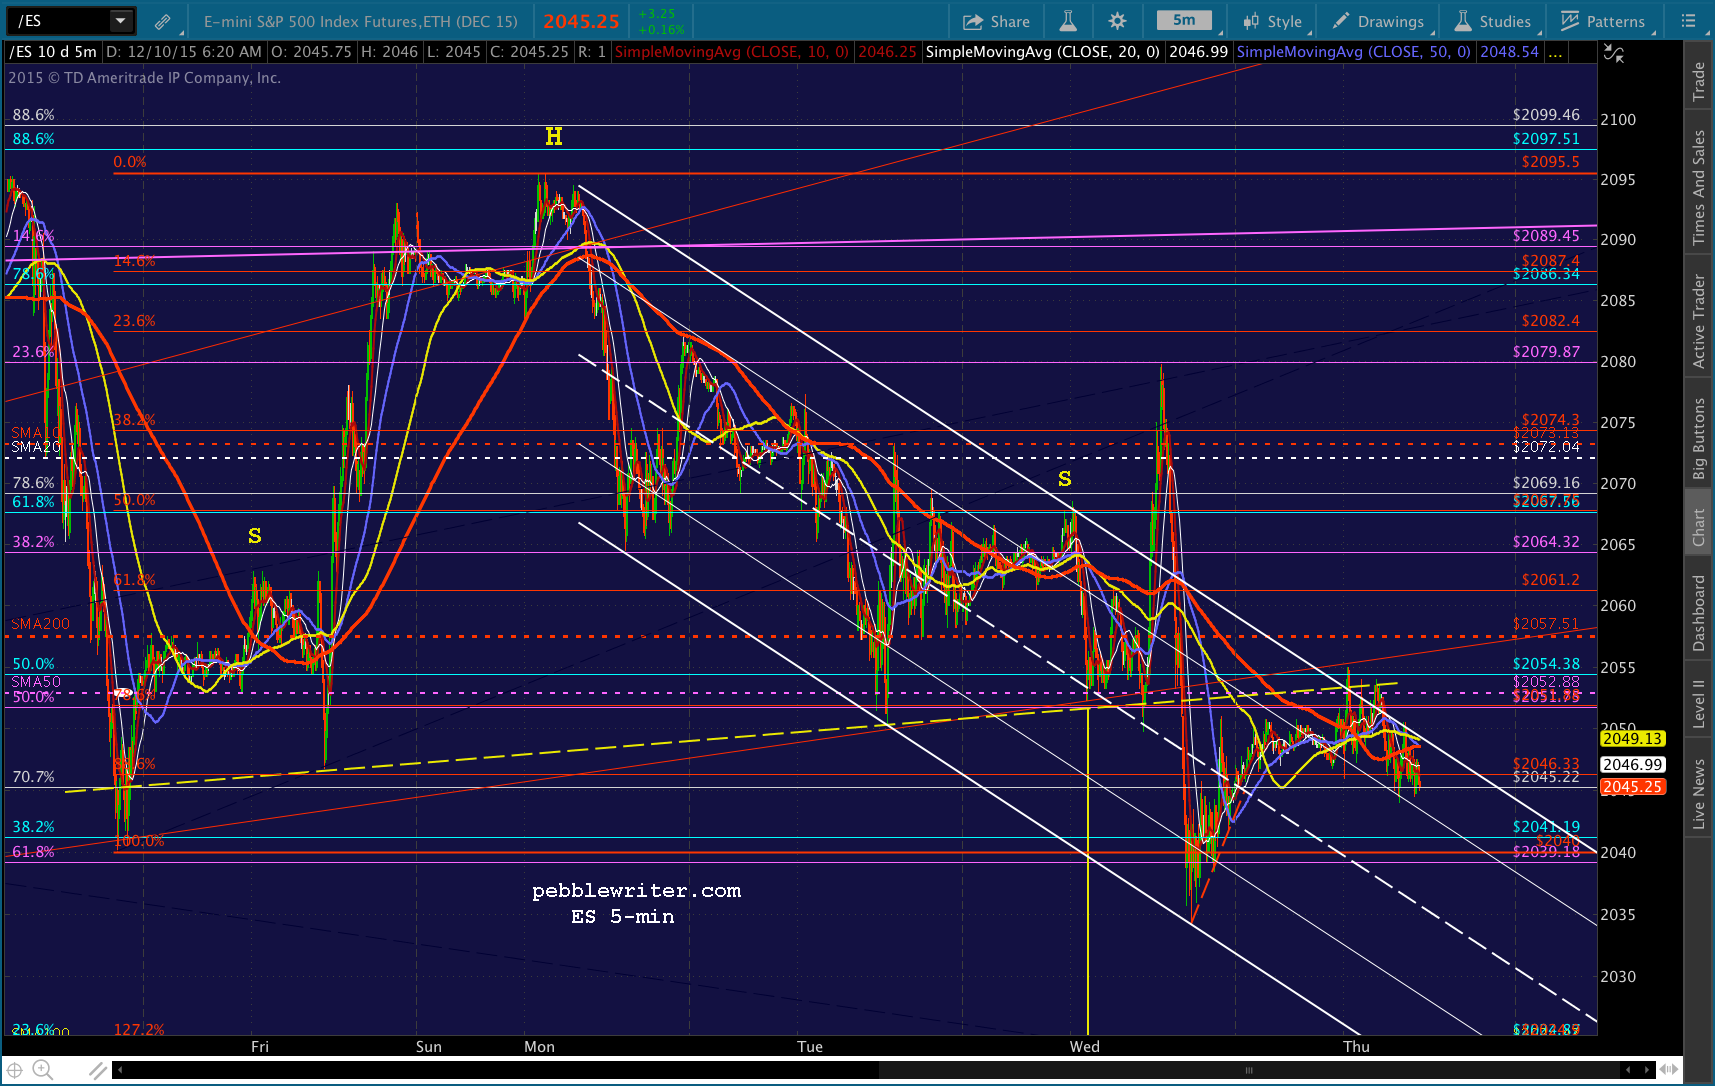 USDJPY is back below its SMA200 and CL is still slumping, meaning we should see continued pressure on SPX. I’ll be looking to short after the initial pop, with yesterday’s downside targets still in mind.
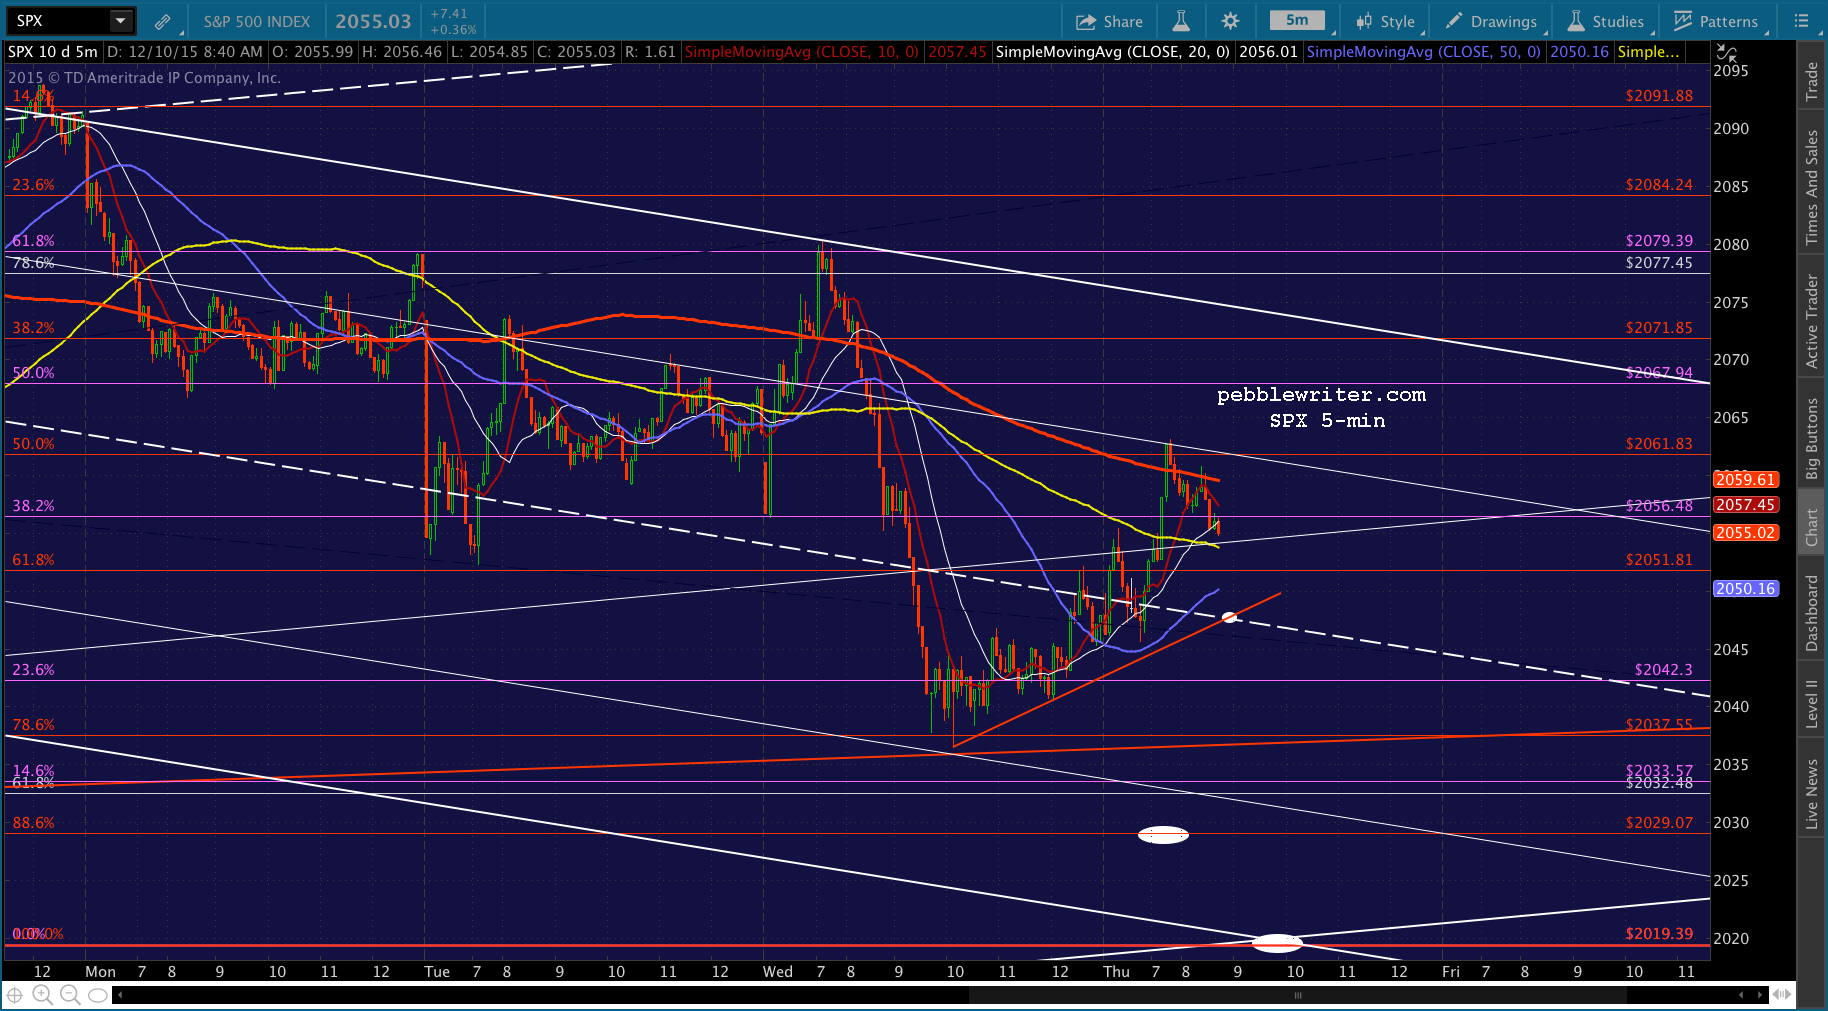
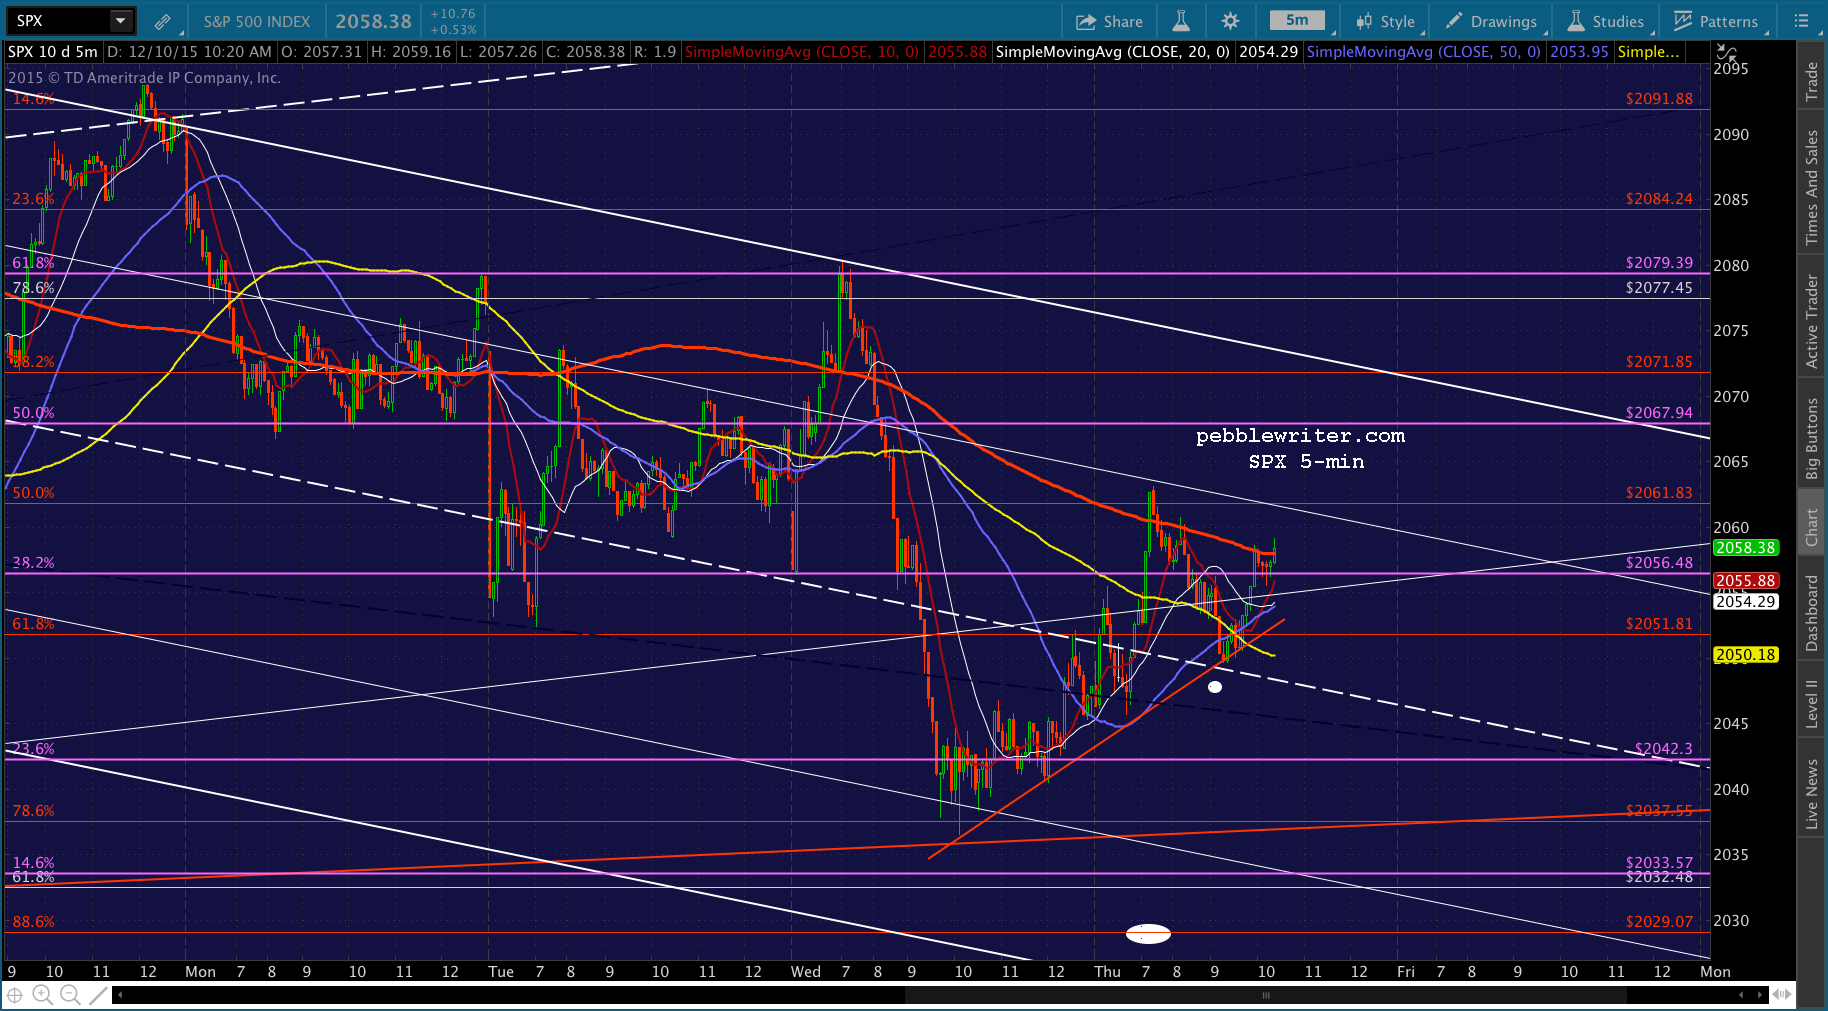
 The initial target is the red .886 at 2029.07, with the rising white channel line down at 2019ish. Though, it could move lower if it moves quickly. It all depends on how CL and USDJPY react in the opening 30 min or so.
UPDATE: 9:32 AM
SPX just backtested its white midline and seems to be reversing. USDJPY and CL aren’t doing much. So, I’ll open a short position here at 2048.78.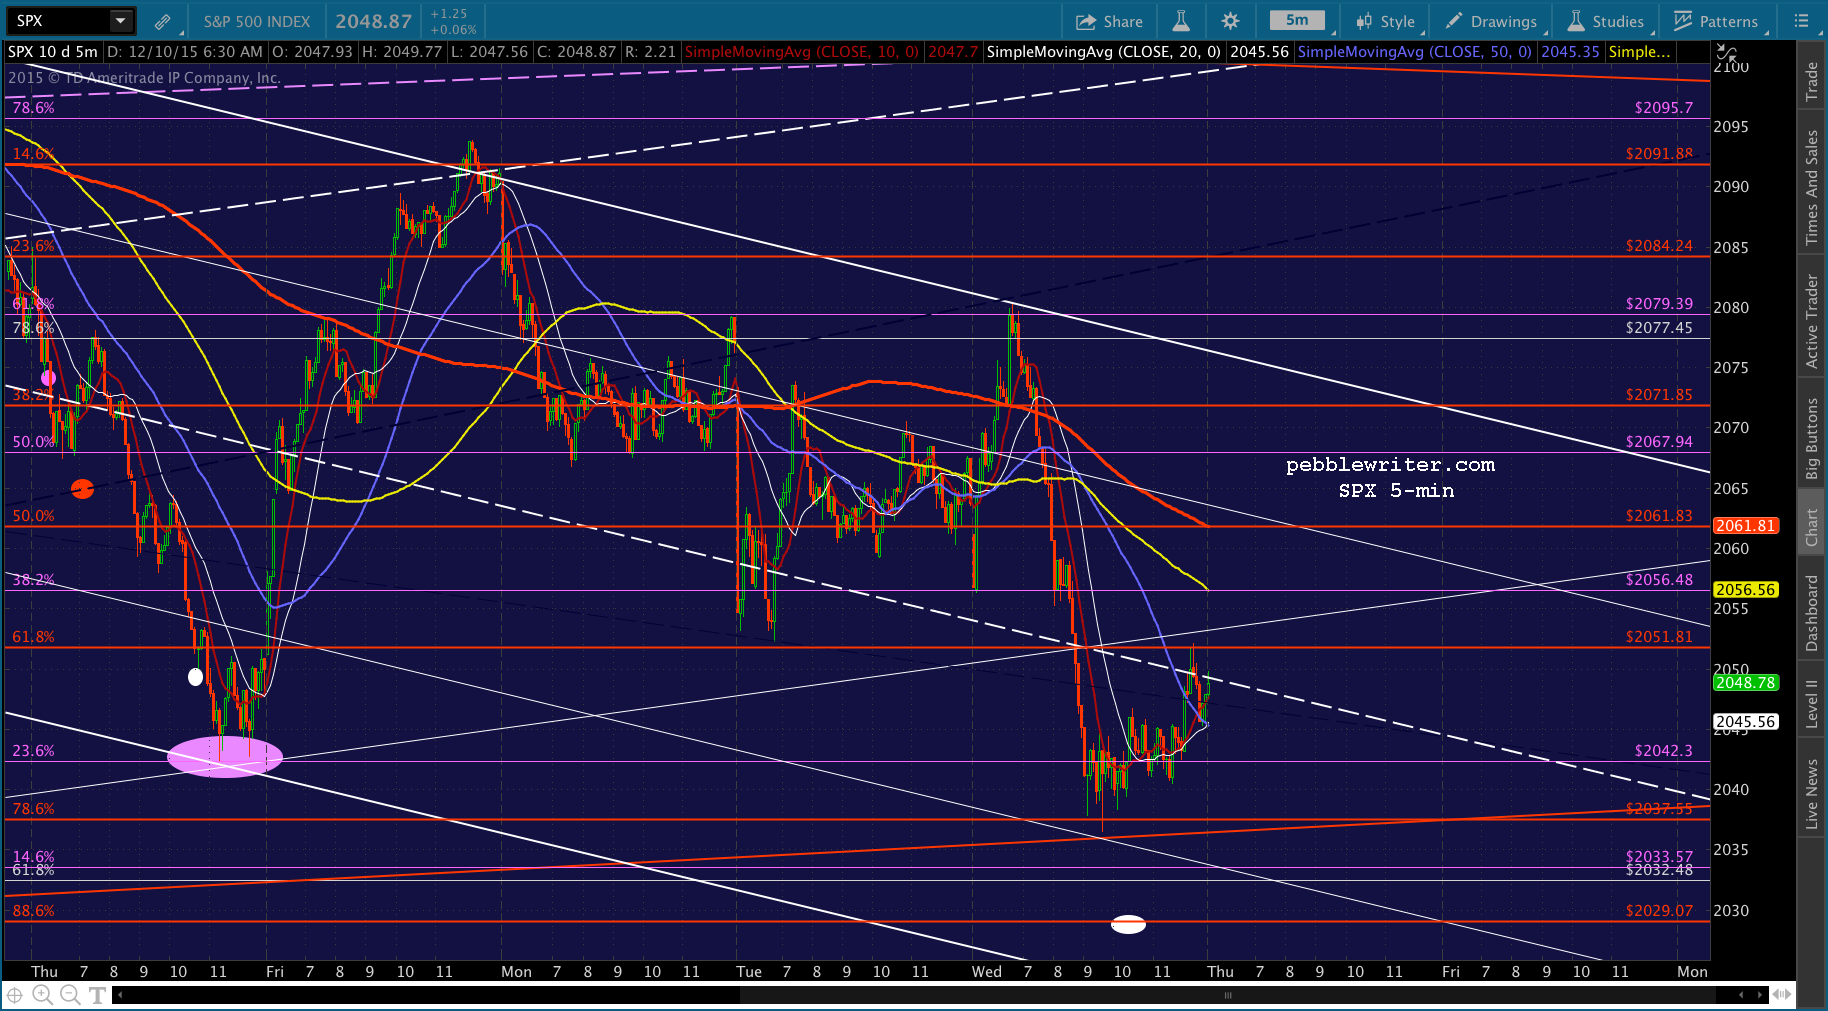 UPDATE: 9:37 AM
USDJPY is moving up towards the midline of a little flag pattern it’s formed. The midline of this channel is the SMA200, so we’d expect a backtest there. Whether it stops there or not will determine whether SPX reverses. But, for now, it’s breaking higher.
So, we’ll dump the short position here at 2049.01. Channel convention says we should get a bounce off the .786 line after one off the .236 line. That would take SPX up to the 5-min SMA200 at 2061ish. Not sure it can get all the way there, though, as ES is backtesting its neckline and the daily SMA50. If it can pop through, hold long. If it reverses, then it’s time to revert to short.

 UPDATE: 9:49 AM
ES is reversing off the neckline, and CL is backing off its MAs. So, I’d revert to short here. Tight stops are advised, though, as USDJPY is climbing a well-defined rising TL.
It could suddenly pop up to the SMA200 target mentioned above, which would give SPX a bounce at its white channel midline. In fact, I rather expect that to happen and will very likely switch back to long with the midline backtest.

 UPDATE: 9:58 AM
SPX testing the midline. But, USDJPY still inching higher. I’ll revert to long here, but will dump it at the first sign of USDJPY faltering.
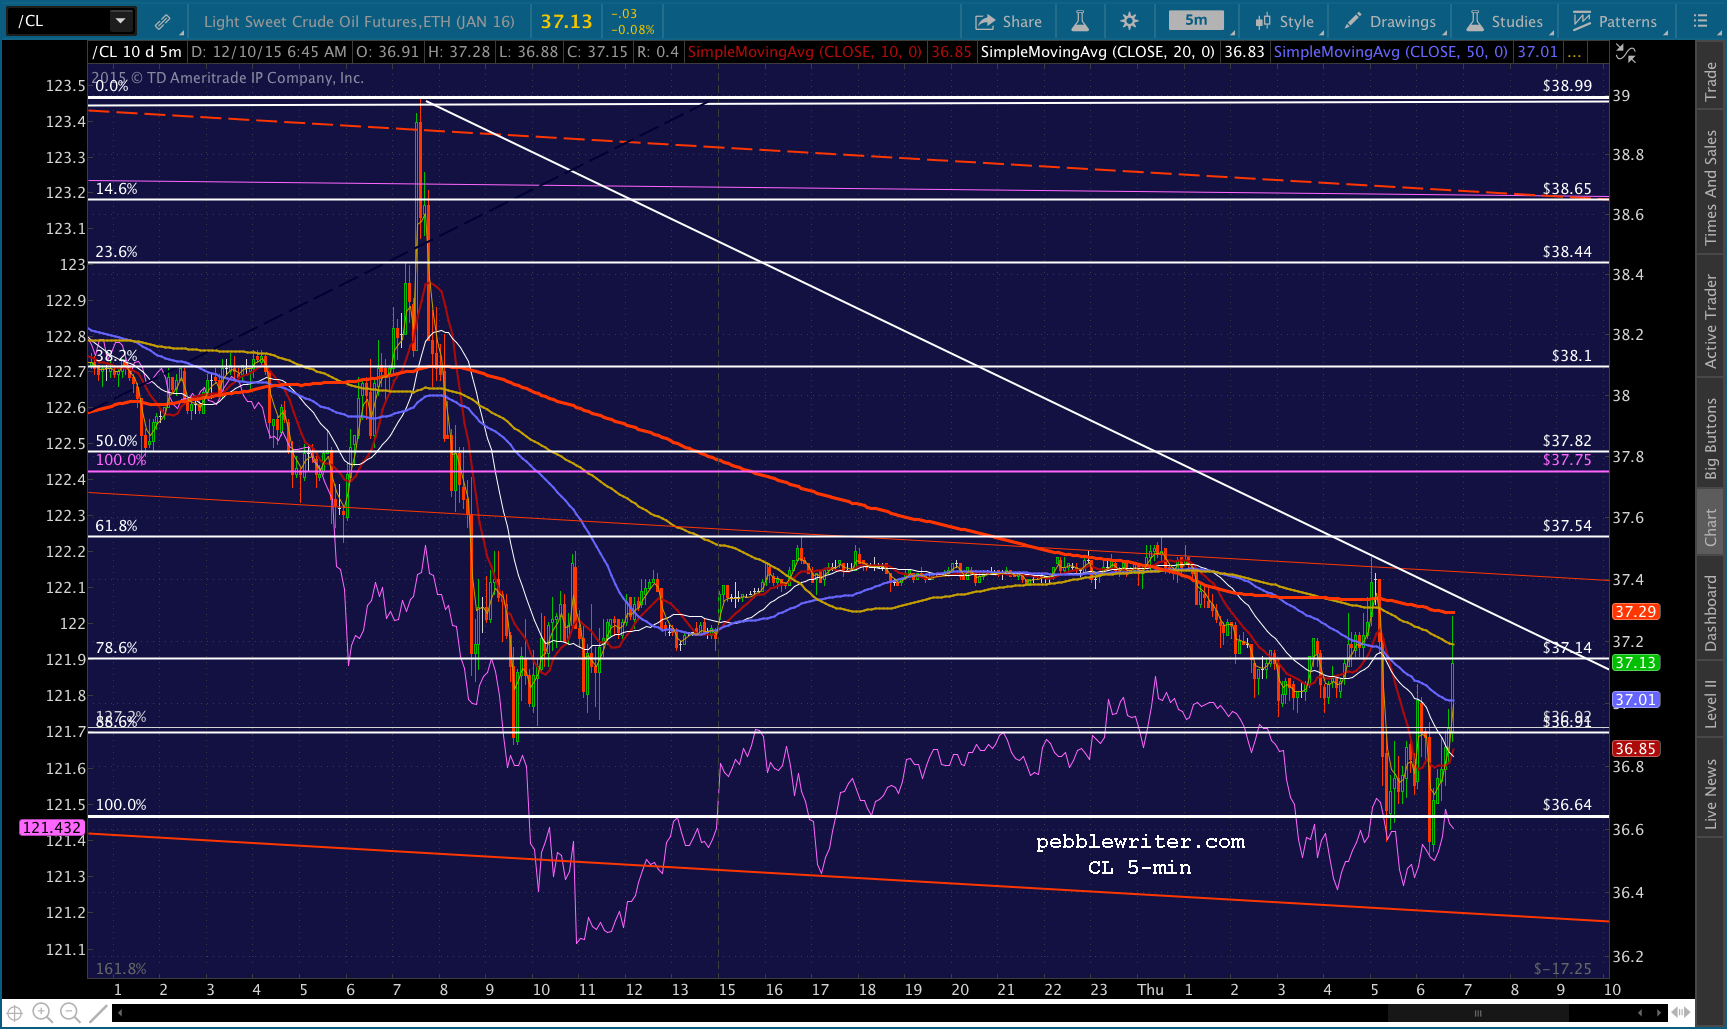
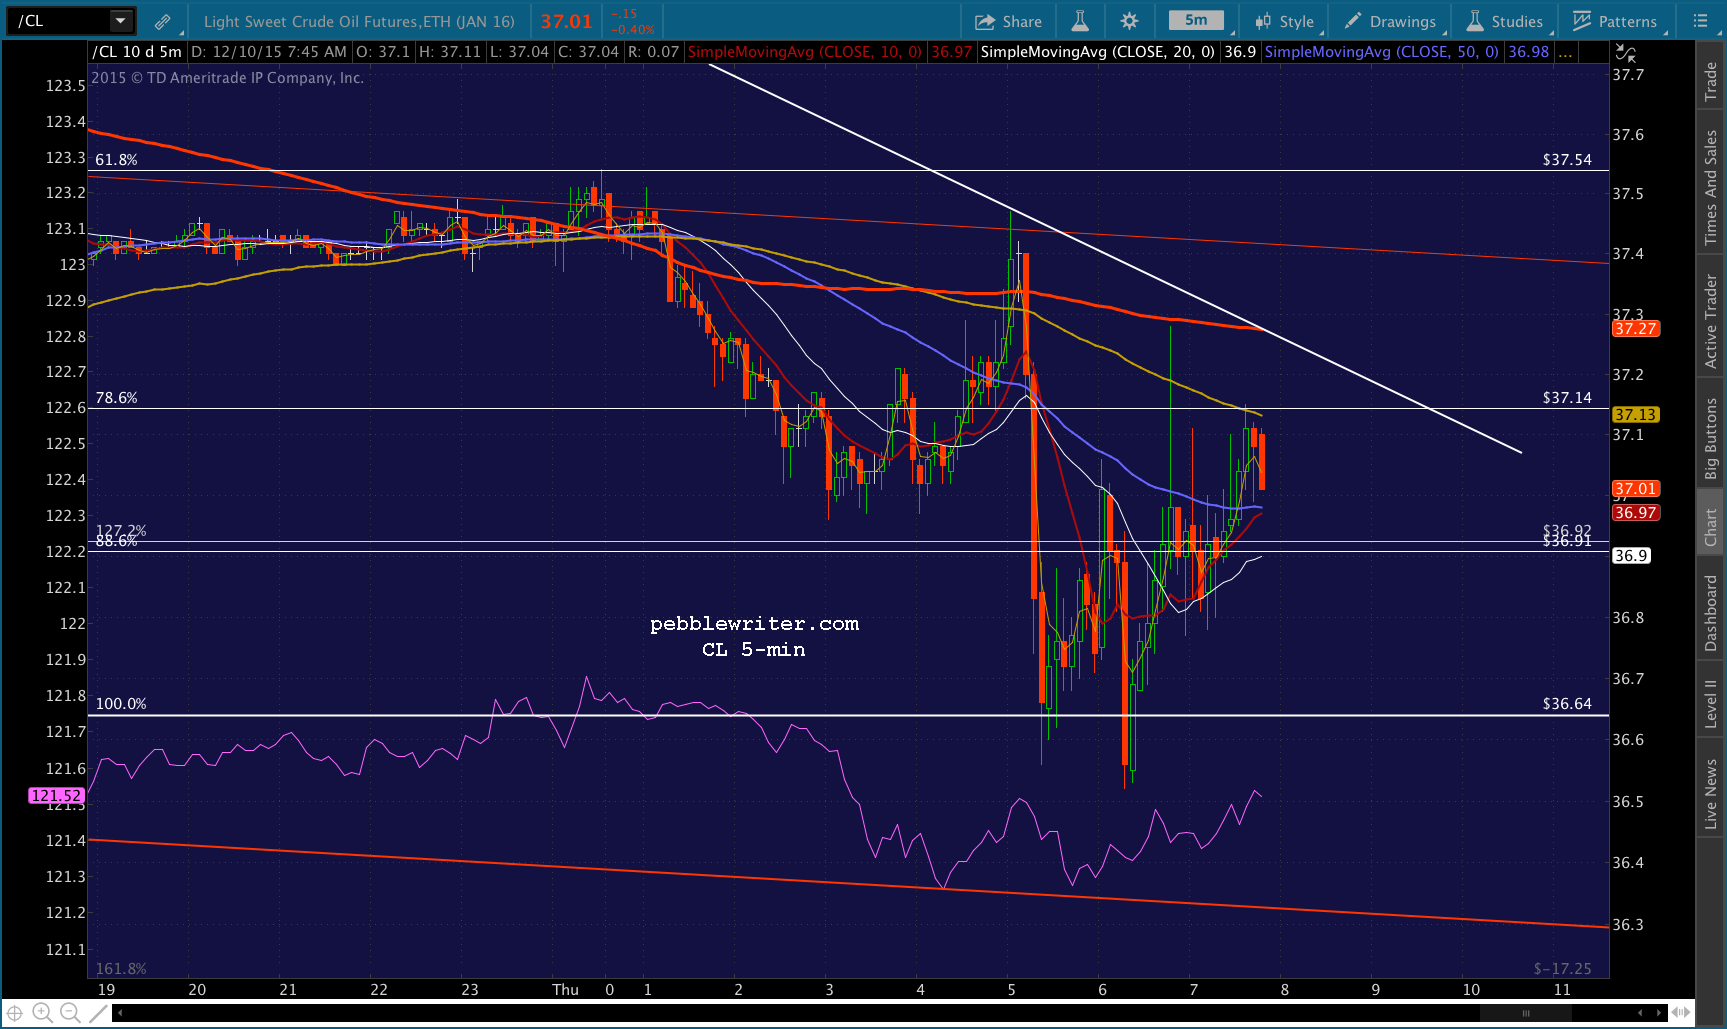
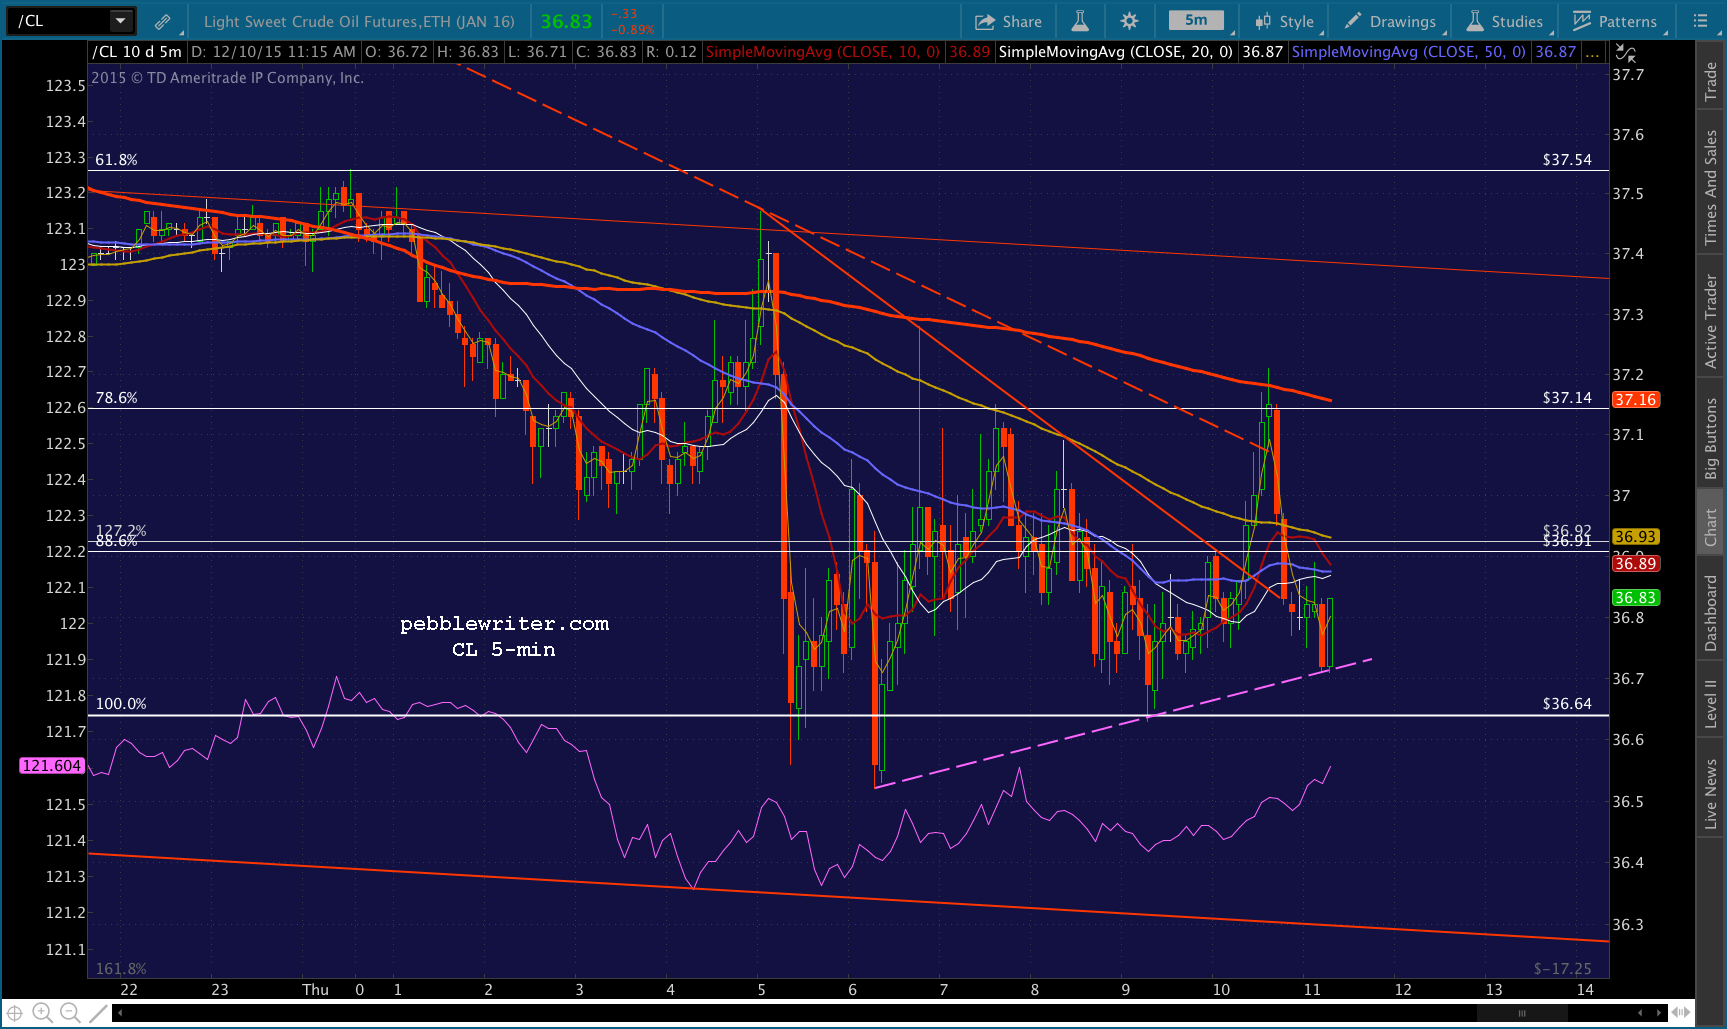
 CL is sitting on the sidelines for now. Very unusual for this troublemaker.
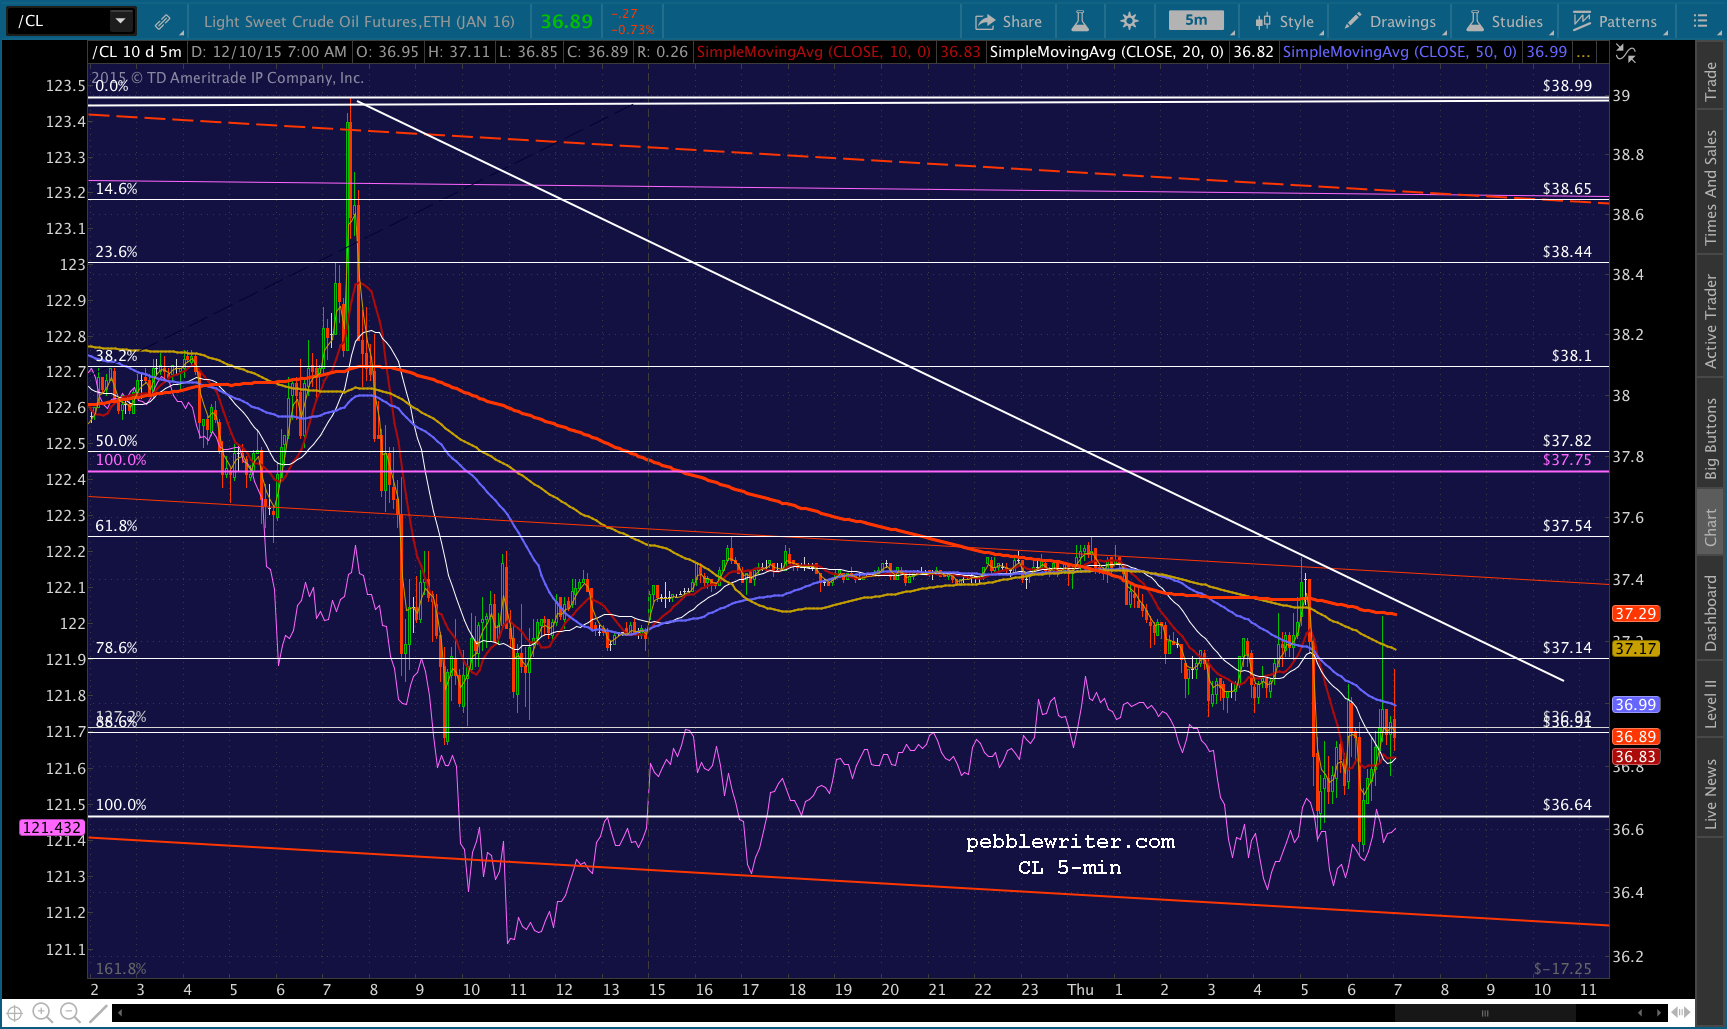 UPDATE: 10:09 AM
USDJPY just poked through that little red TL, but might bounce off the SMA10. I assume they’re looking for a way to get SPX down to its 5-min SMA50 and red TL, so will revert to short here. It would be a quick trip if the TL holds — say, 2044.44.
 CL is still AWOL. And, ES is still looking weak, but hasn’t exactly broken down after backtesting the neckline for the 4th time.
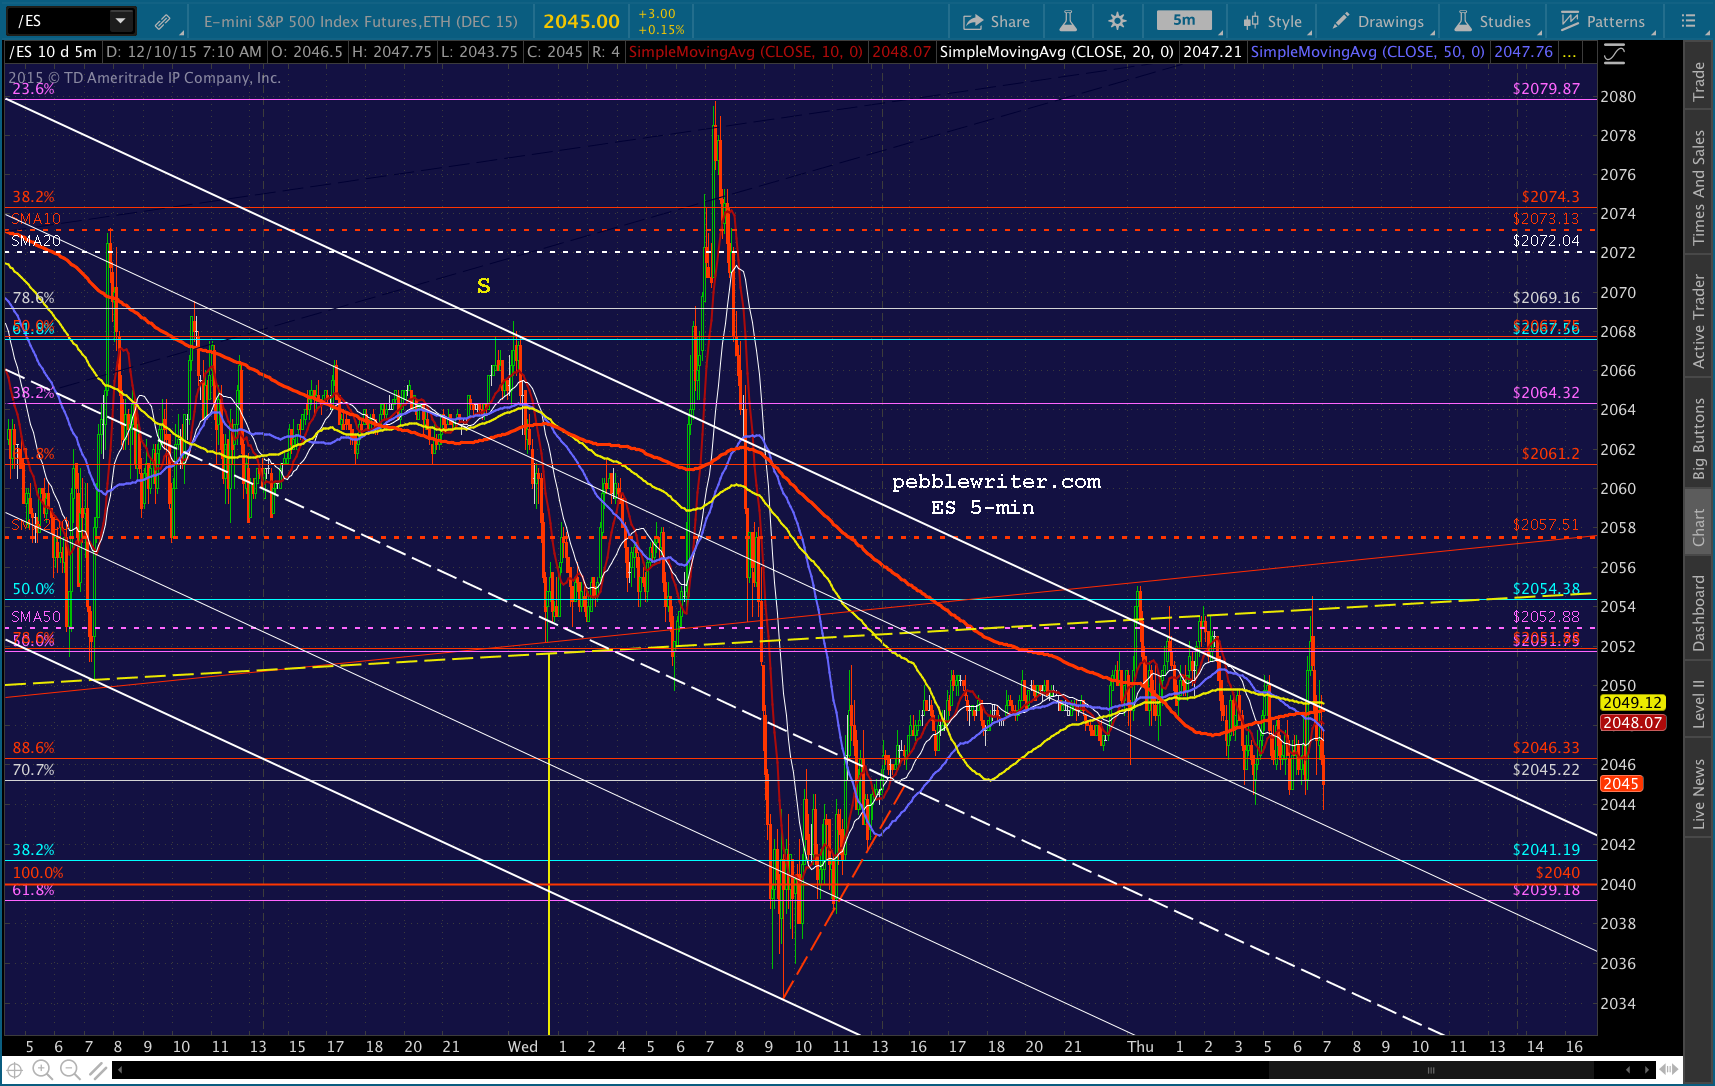 UPDATE: 10:19 AM
USDJPY popping back through the TL and ES out of the white channel. We’re getting whipsawed. So, I’ll just close the position altogether and wait for more clarity.
 UPDATE: 10:46 AM
SPX just tagged the .786 channel line. I’d try a short position here at 2062.88 with an initial objective of 2048. Tight stops advised, as CL and USDJPY, which are both reversing at the moment, still have upside potential. Also, ES has poked up through its daily SMA200. Volume is light, so they can easily run it up to 2075.31 (top of white channel) if they like by running USDJPY up through the SMA200.
 UPDATE: 11:45 AM
Getting some movement here…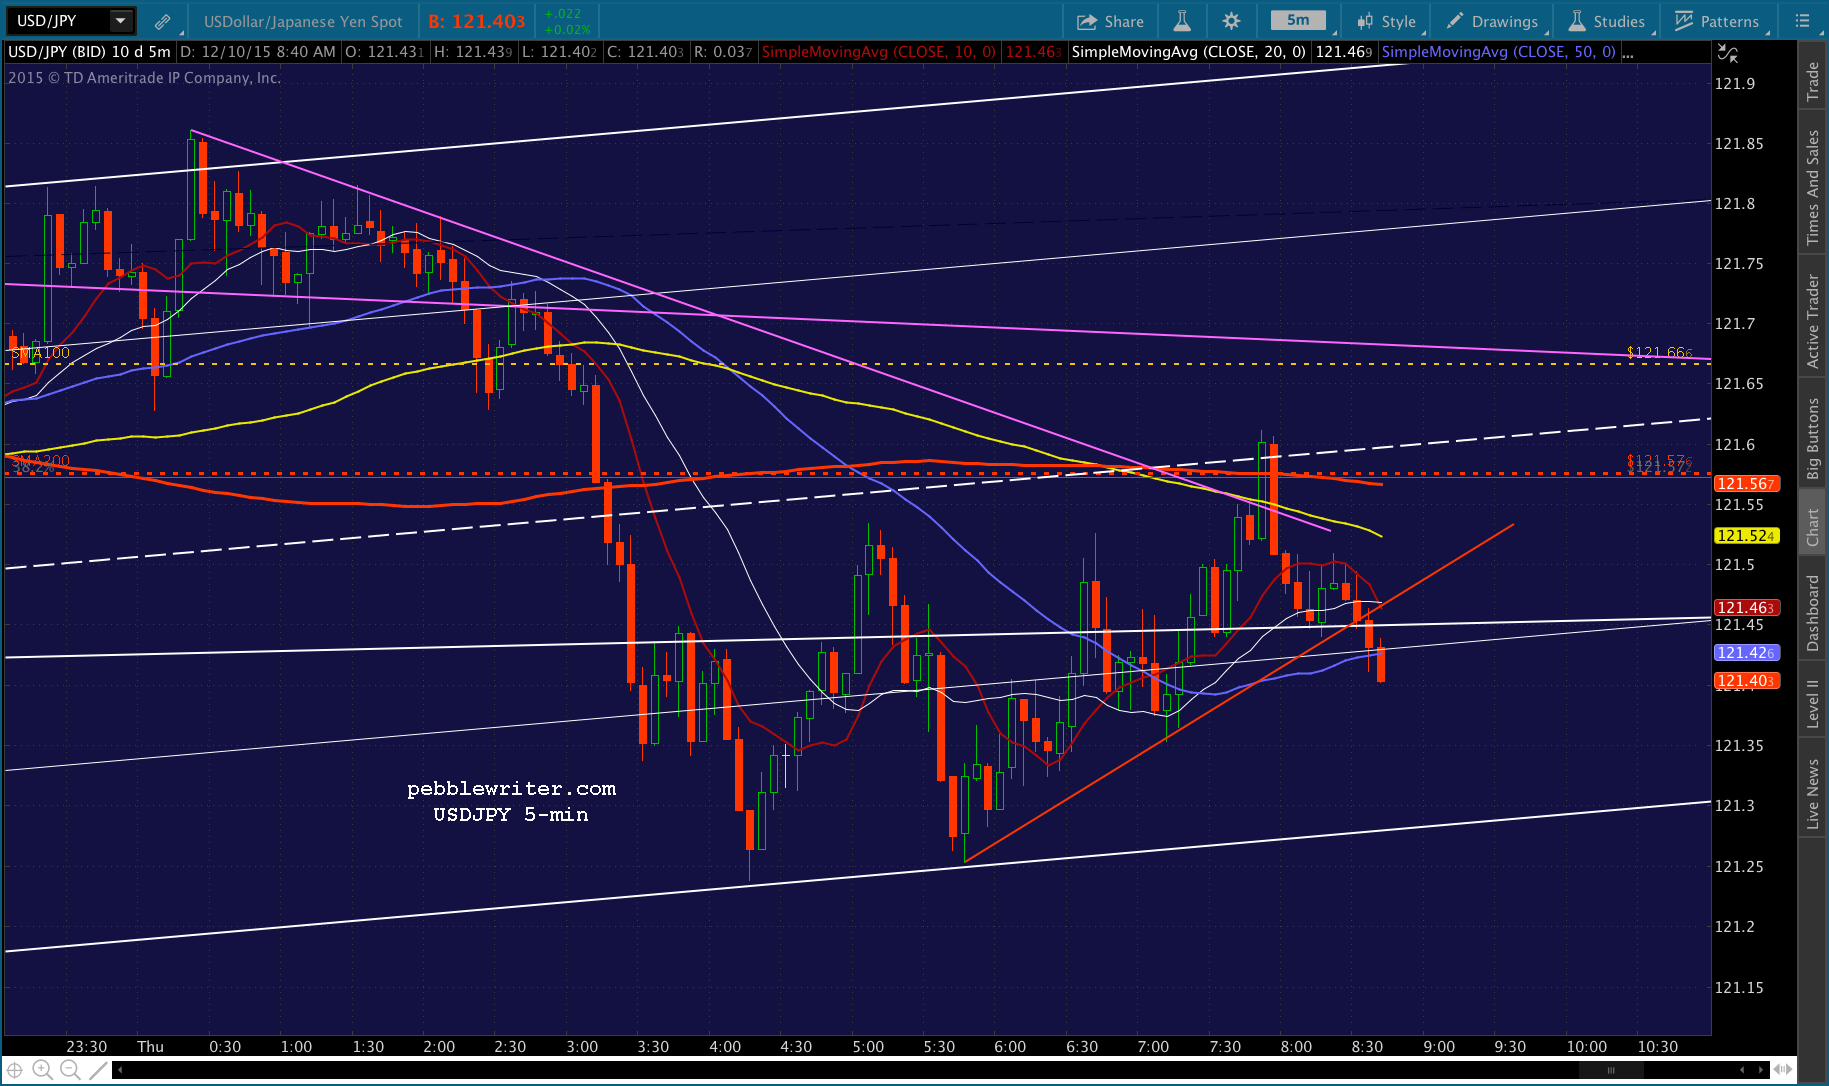
 UPDATE: 12:22 PM
USDJPY is starting to bounce, and SPX is close enough to our target. I’ll cover the short here at 2049.68 and go to cash. The ES channel, in particular, is a little fuzzy. Based on earlier action, I might be off a little. If so, this constitutes a backtest of the breakout.
Likewise, SPX bounced a little earlier than the white channel midline yesterday morning. So, I could be off on that as well.


 UPDATE: 12:33 PM
I’ll reopen the short on any push through the red TL at 2050ish. Keep an eye on NKD, which has cropped back below its SMA200, but has good TL/channel support. A drop through it would be a good sign to short.
 UPDATE: 12:59 PM
Shorting again here at the 5-min SMA200 as USDJPY reaches the purple TL…
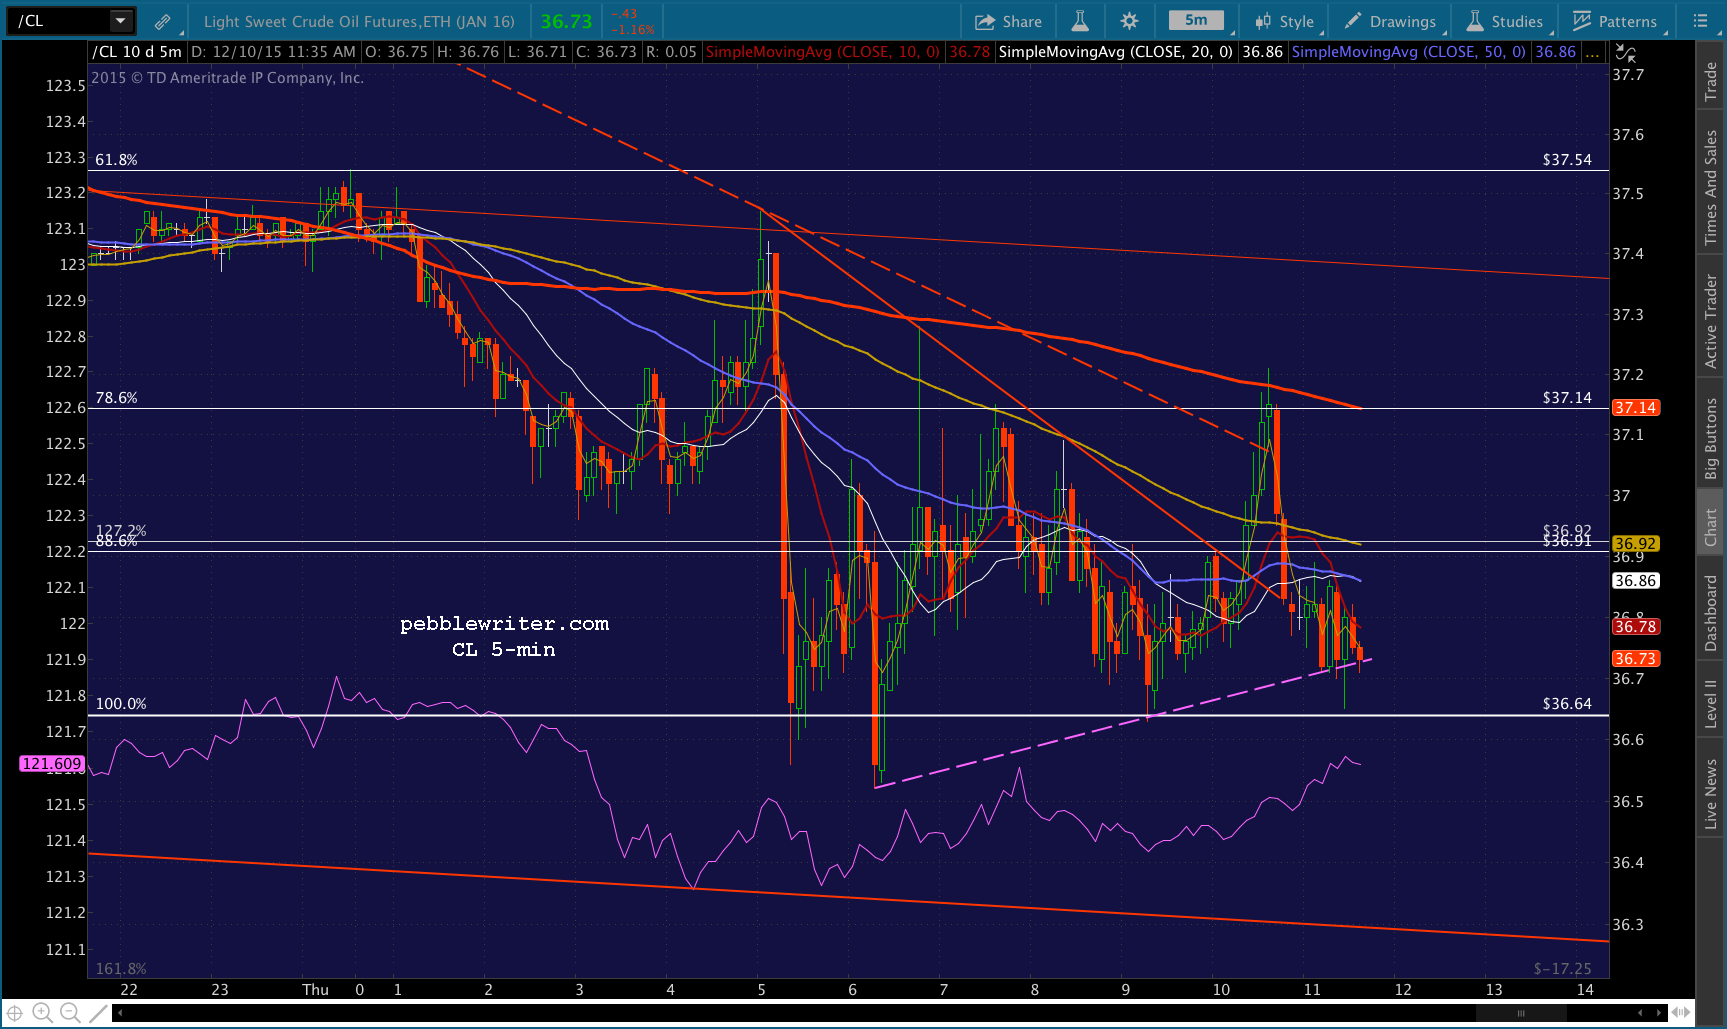
 …CL runs into overhead TL resistance…
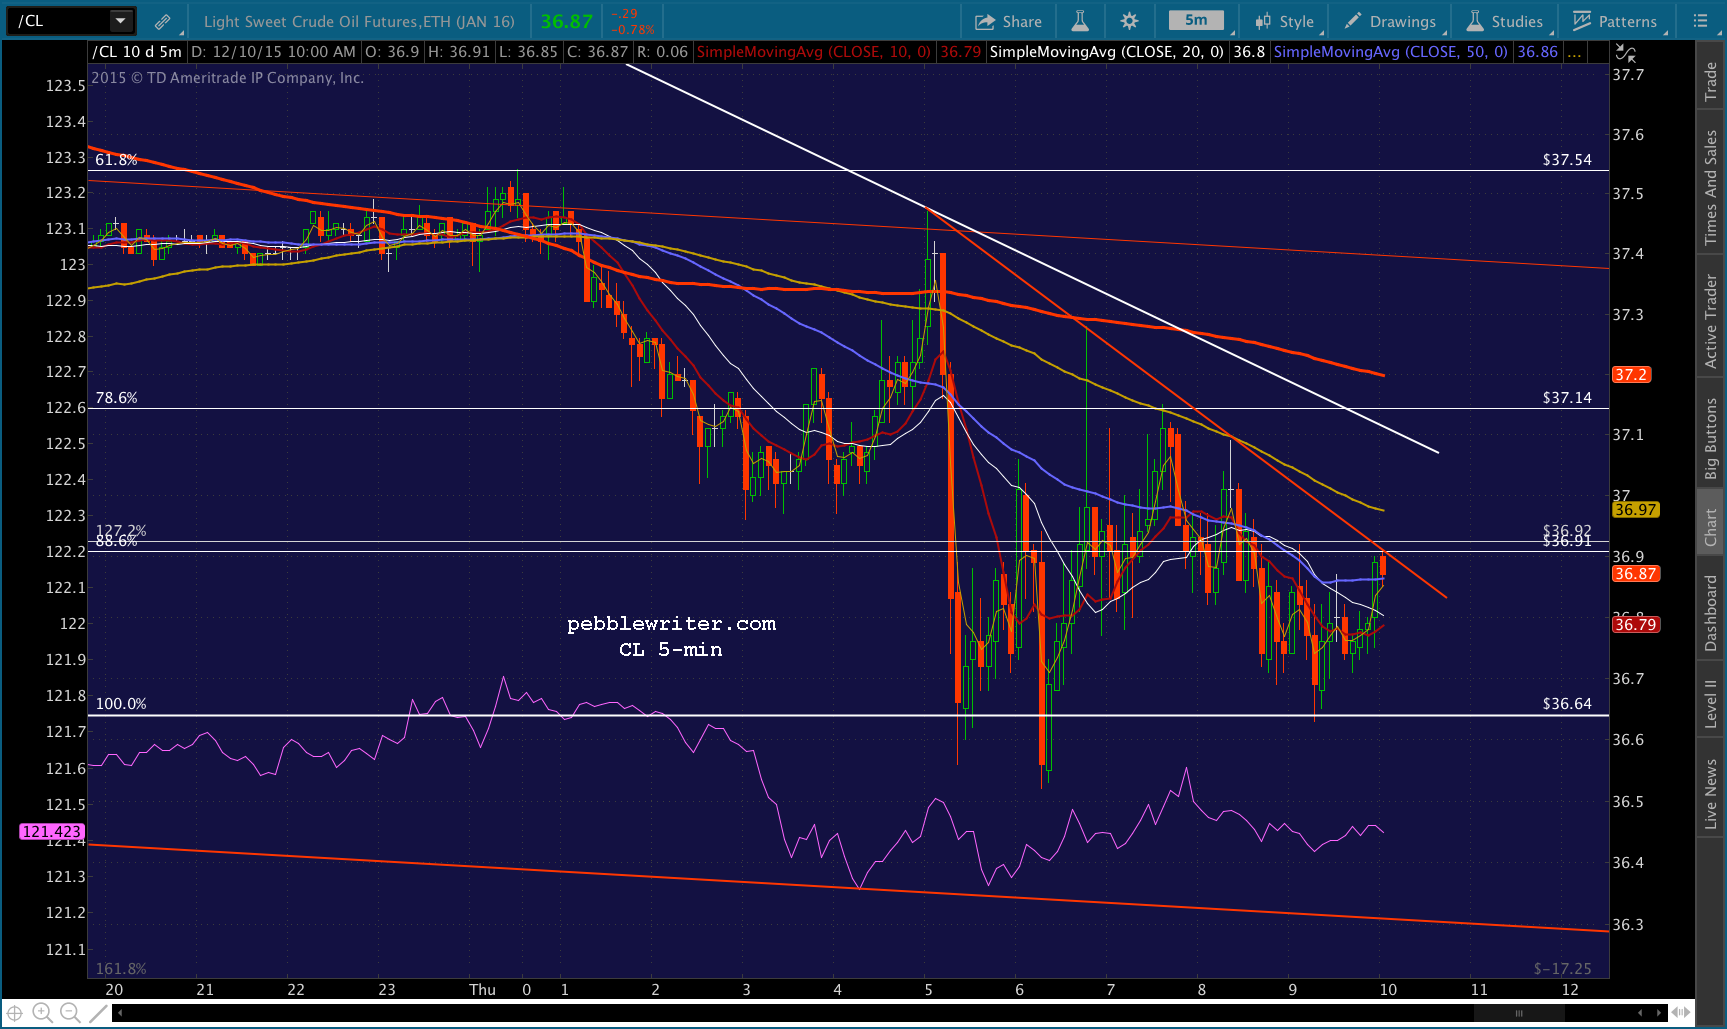 …and, ES reverses off the daily SMA200 yet again.
 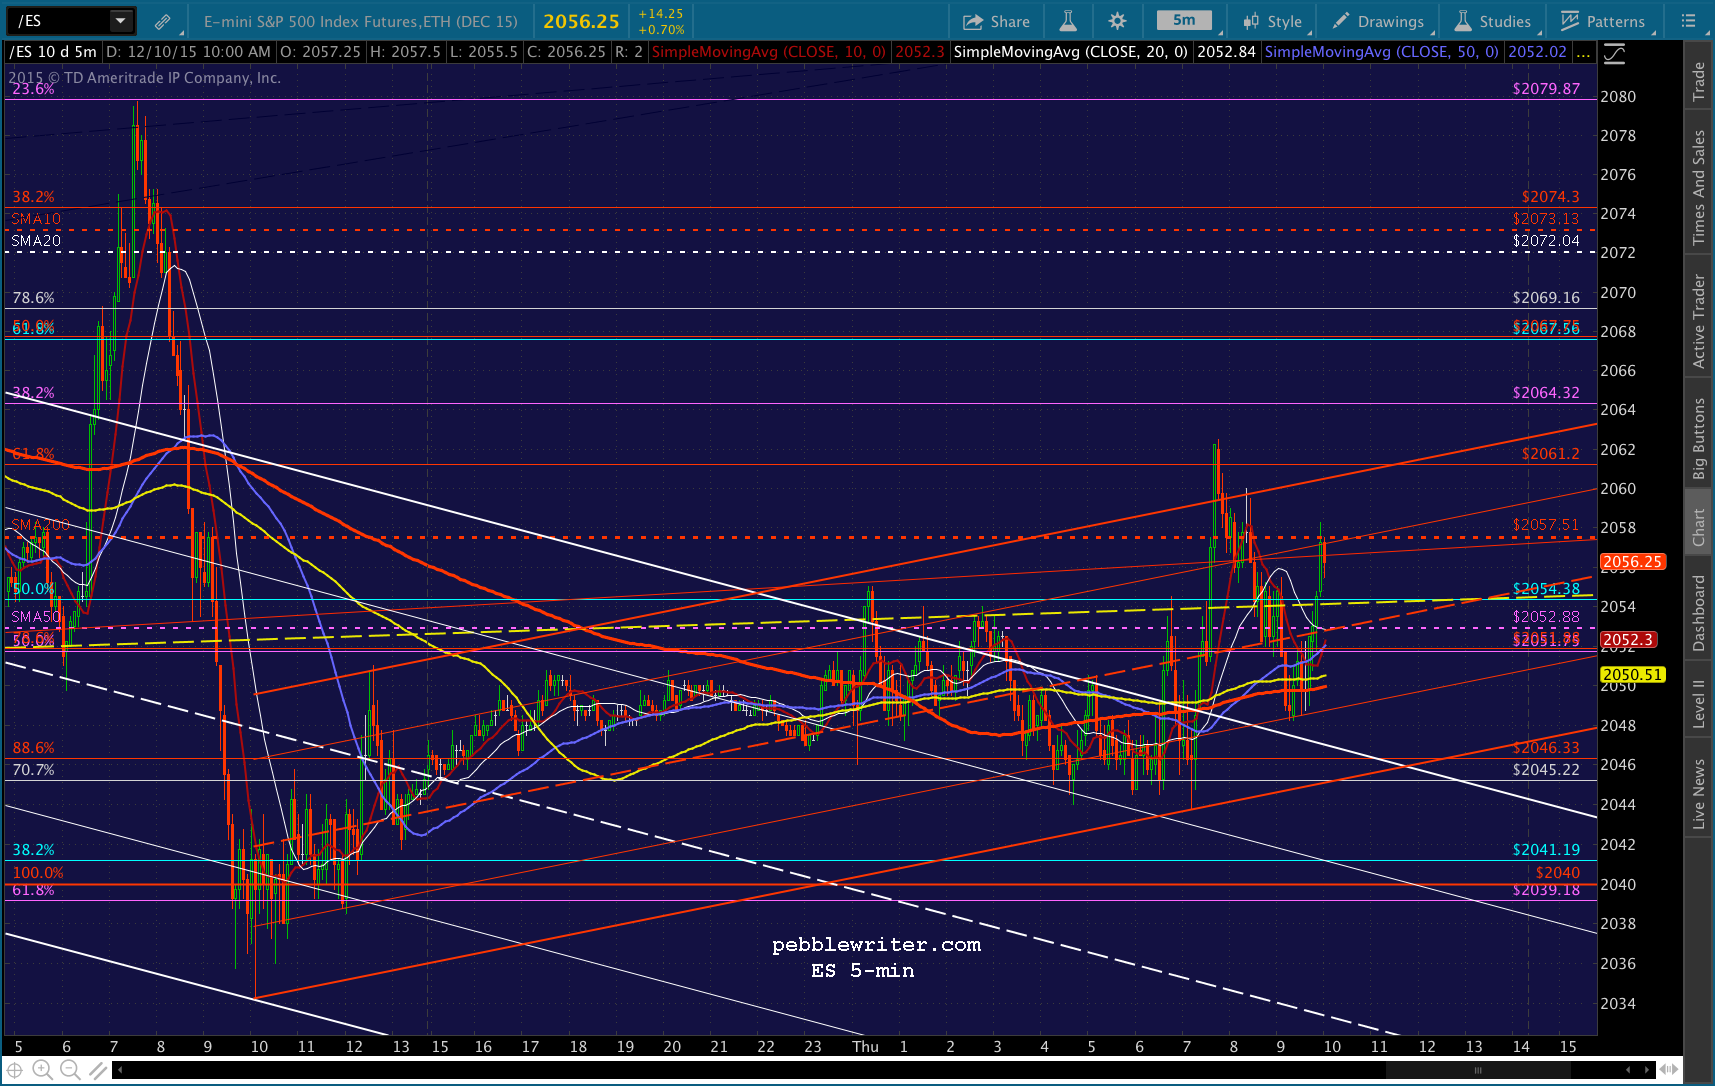 Any of these things can obviously move through resistance, but at least it’ll be easy to see coming and switch to long.
UPDATE: 1:25 PM
USDJPY and CL are suggesting a breakout here. Watch your stops here.
 UPDATE: 1:33 PM
Giving up on the short. Back to cash and likely done for the day.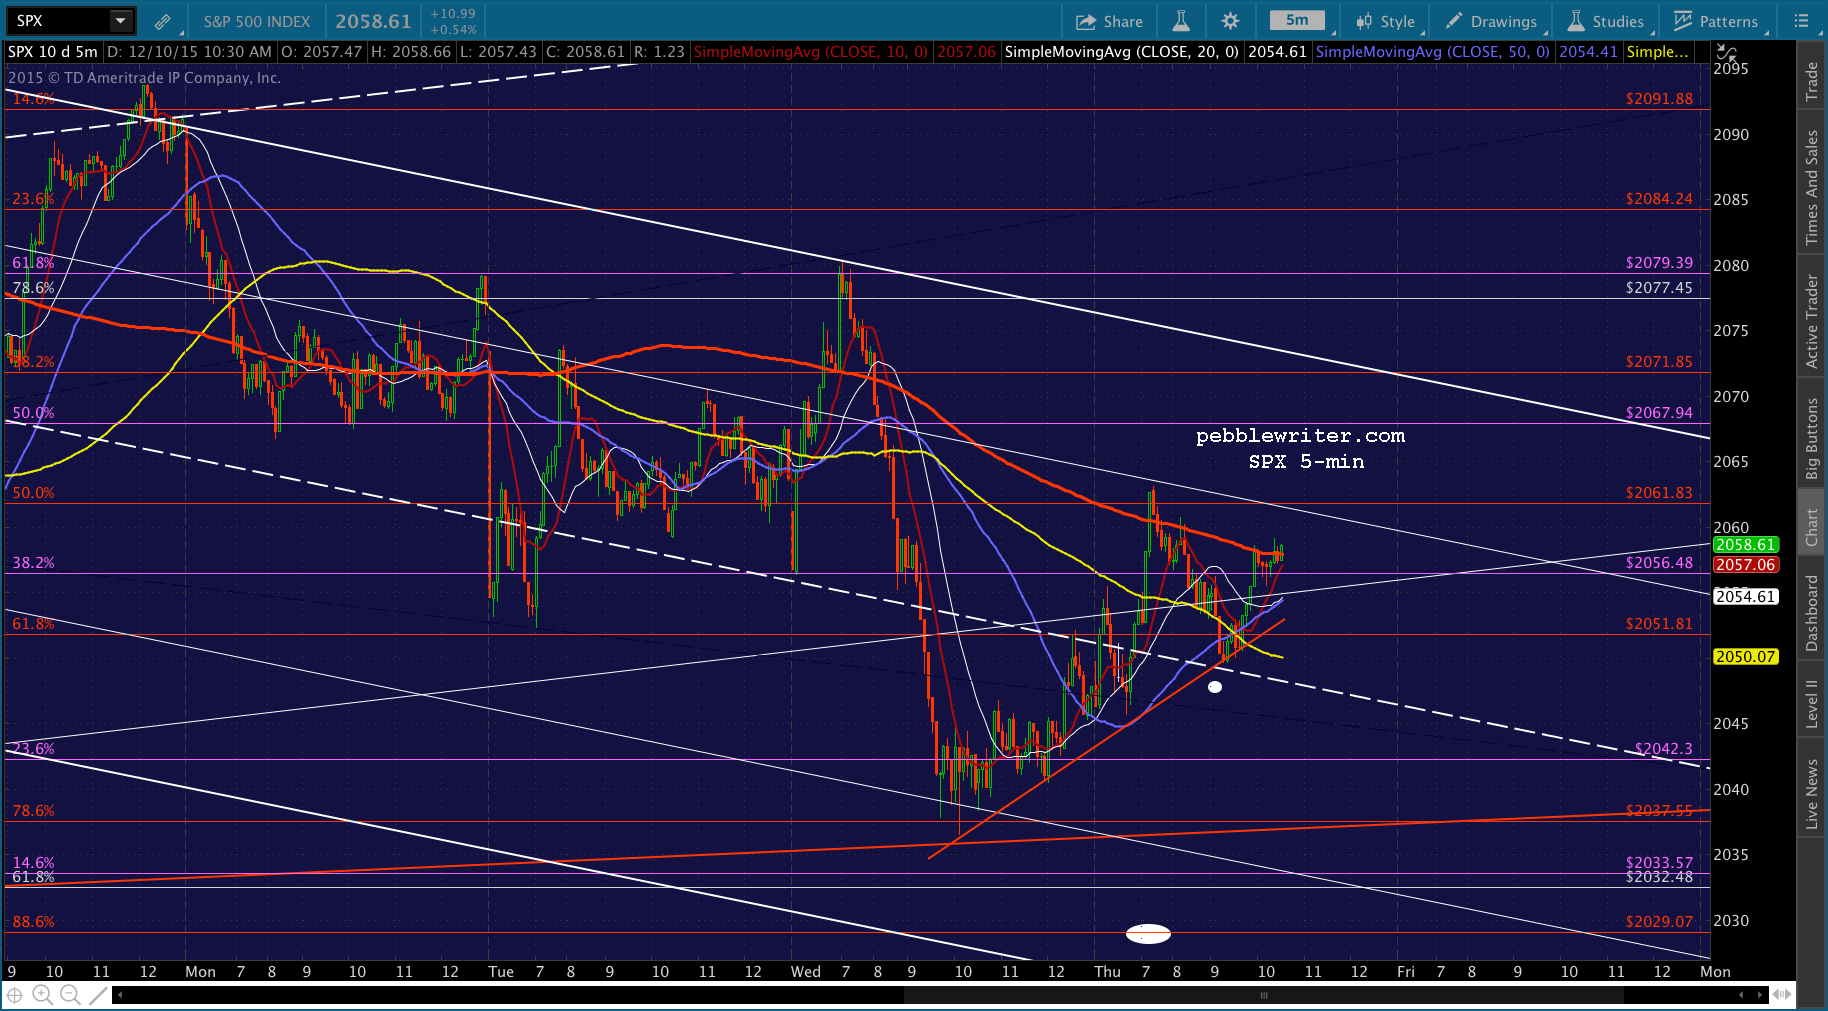 UPDATE: 2:17 PM
I’ll play along on the long side if it breaks out here.
 UPDATE: 2:30 PM
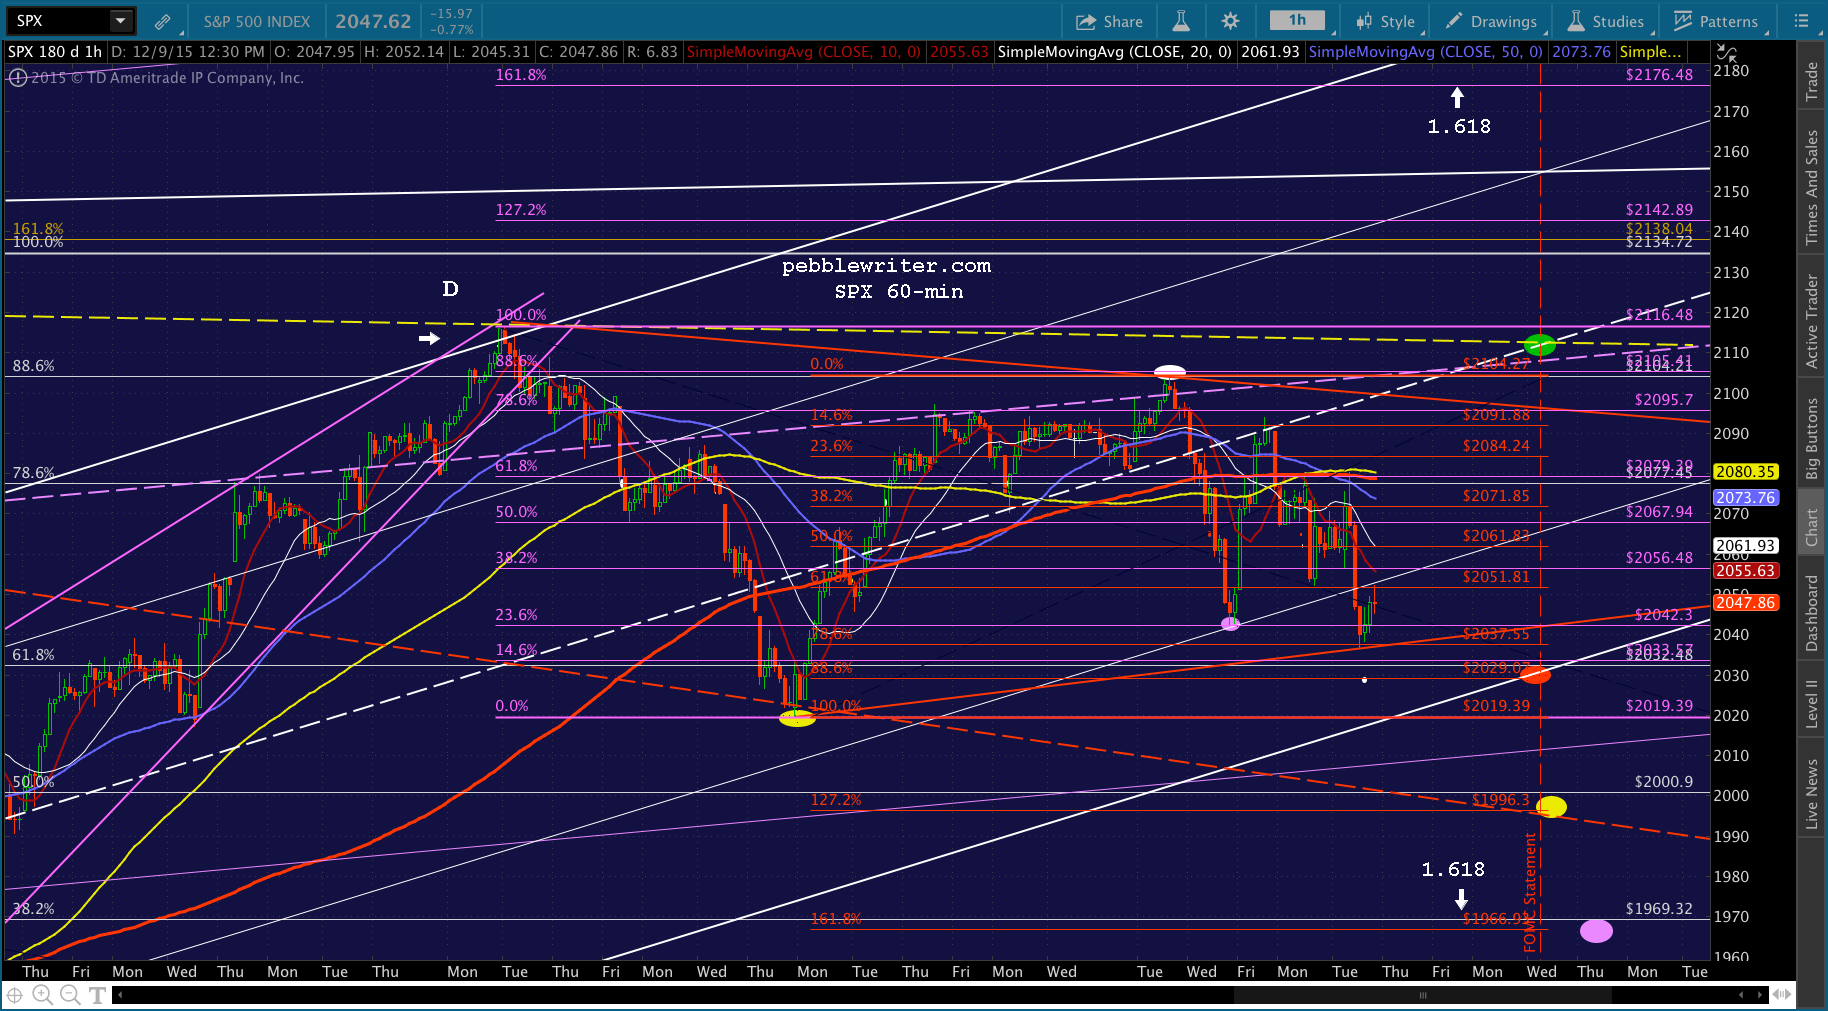
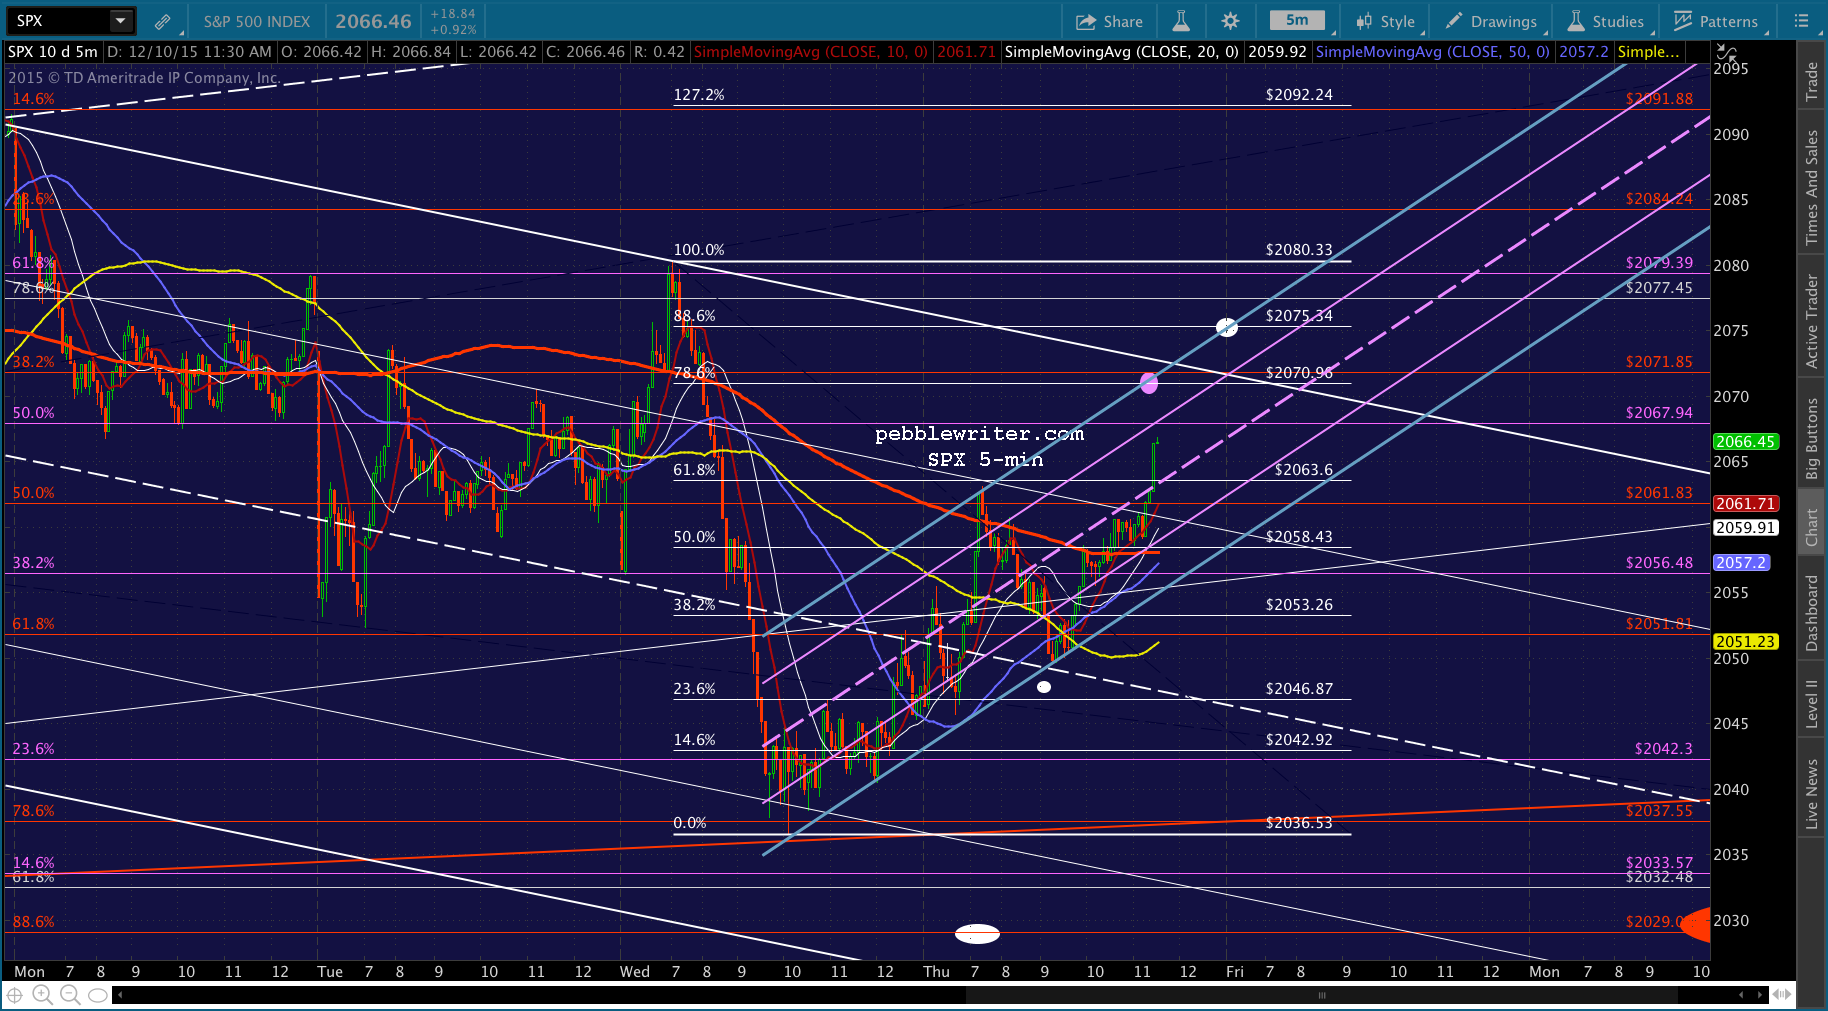
I’ve redrawn the upside target(s) to the .786 (completes a Gartley) in purple and the .886 i white. Note that the white target would mean a breakout of the falling white channel, so it’s theoretically less likely. But, the fact that it occurs at the intersection of the .886 and purple channel top and the closing bell intrigues me.
If I had to guess, I’d say we’ll get a reversal at the purple dot, followed by a pullback to a MA or Fib or channel midline, and a final push into the close to the white dot. This is all algo driven now, so there shouldn’t be any sudden lurches – just drip, drip, drip.
Also, note that the white .786 is at roughly the same level as the red .382. Since SPX reversed at the red .786 yesterday, a retrenchment to the .382 would be logical. The .886 has no such overlapping target that I can see.
 Not sure exactly what to expect from USDJPY, CL and NKD at this point, as they’re all in “Draghi mode” (whatever it takes.)
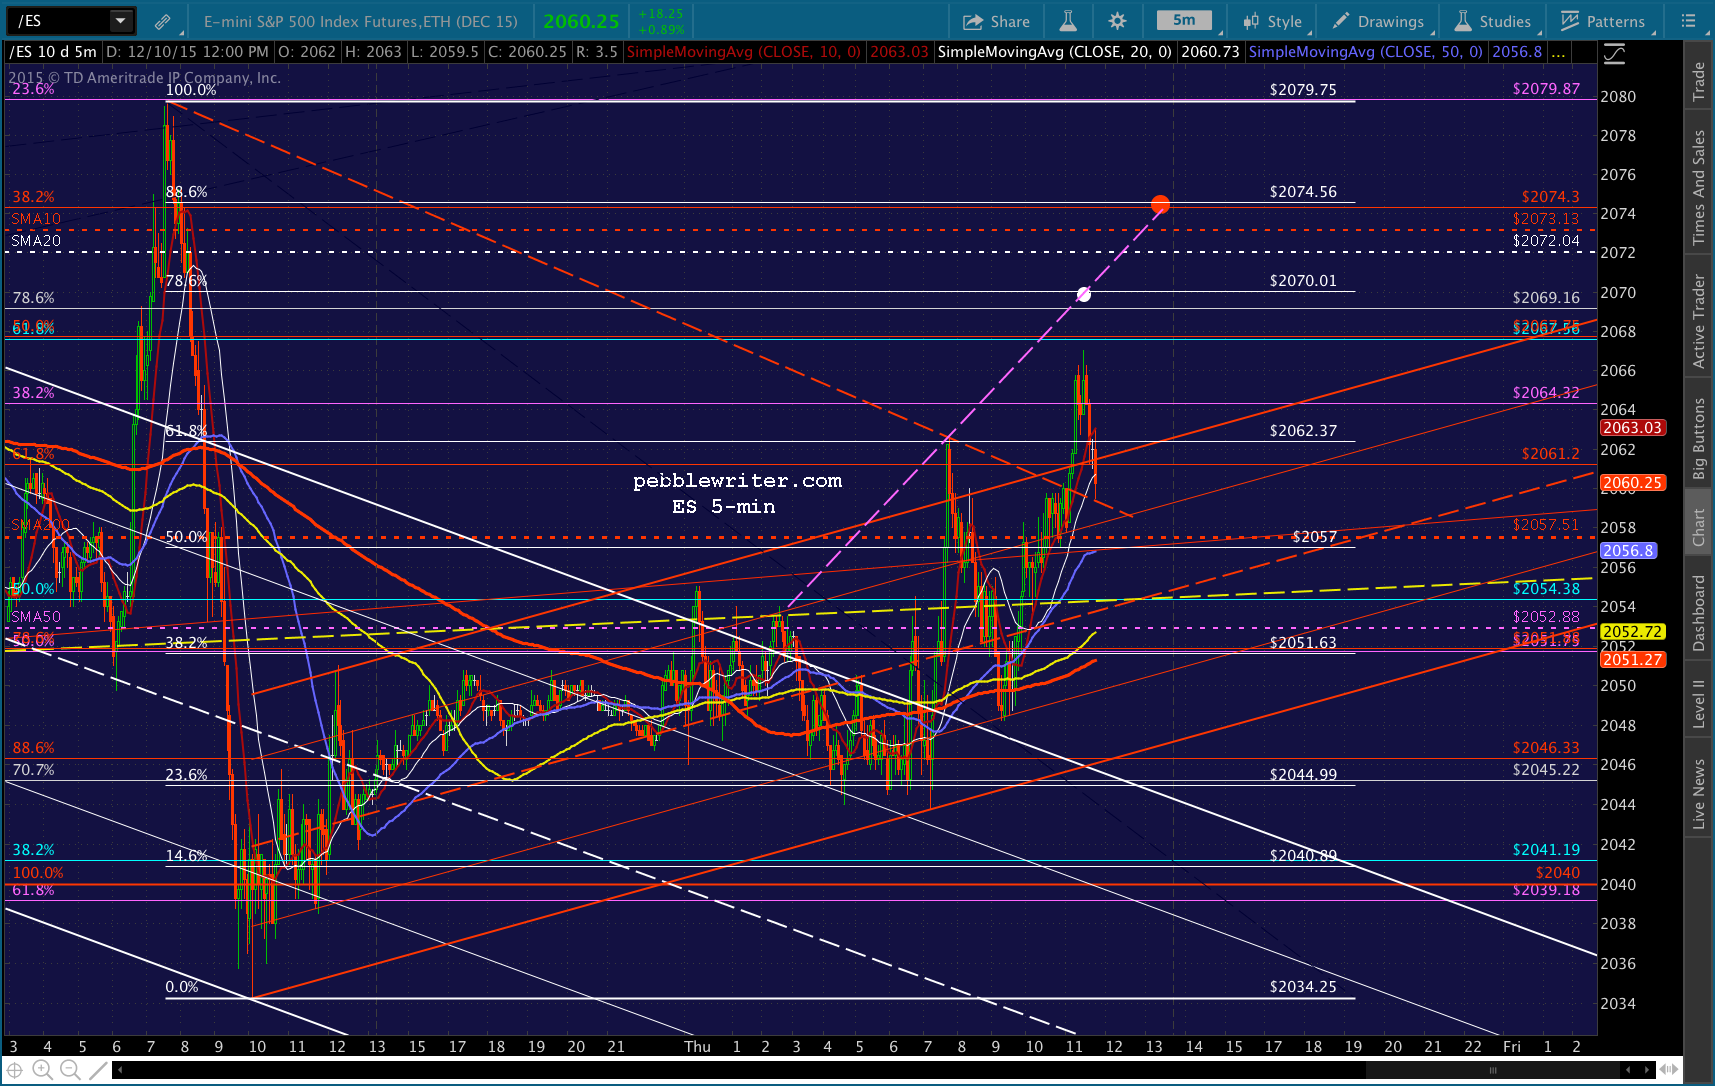
 ES’ likely targets…
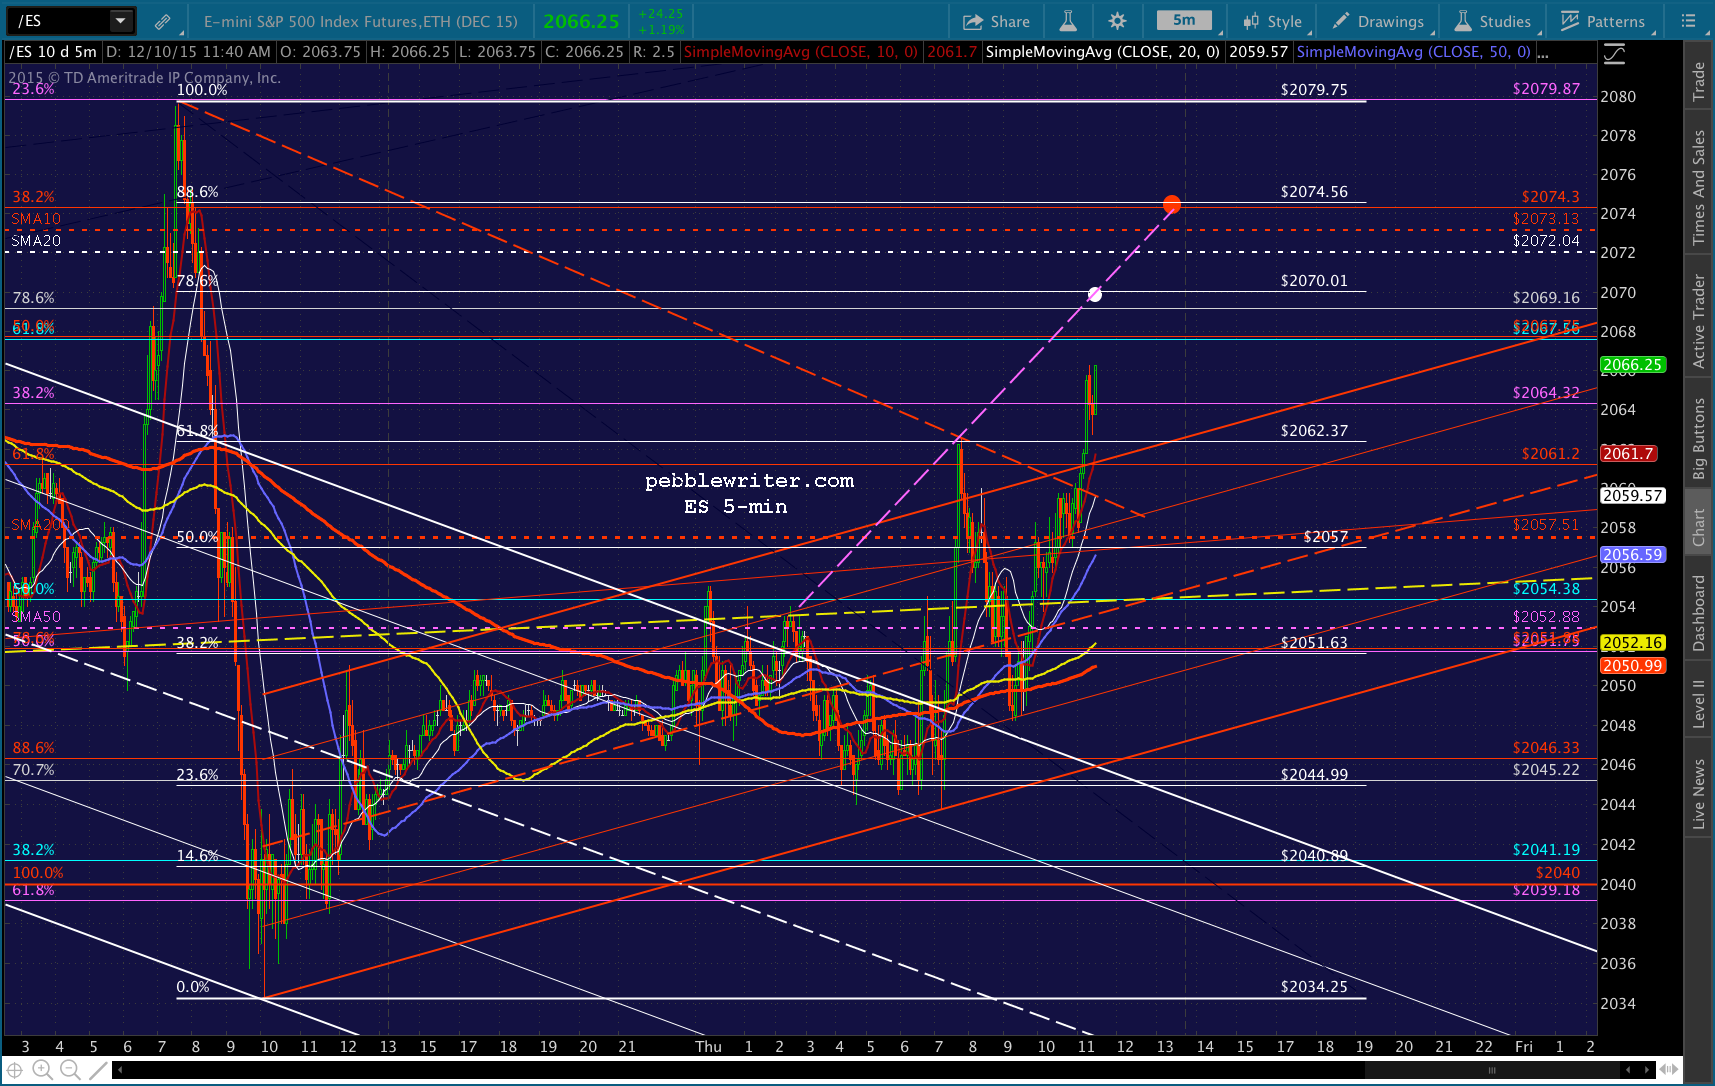 UPDATE: 3:06 PM
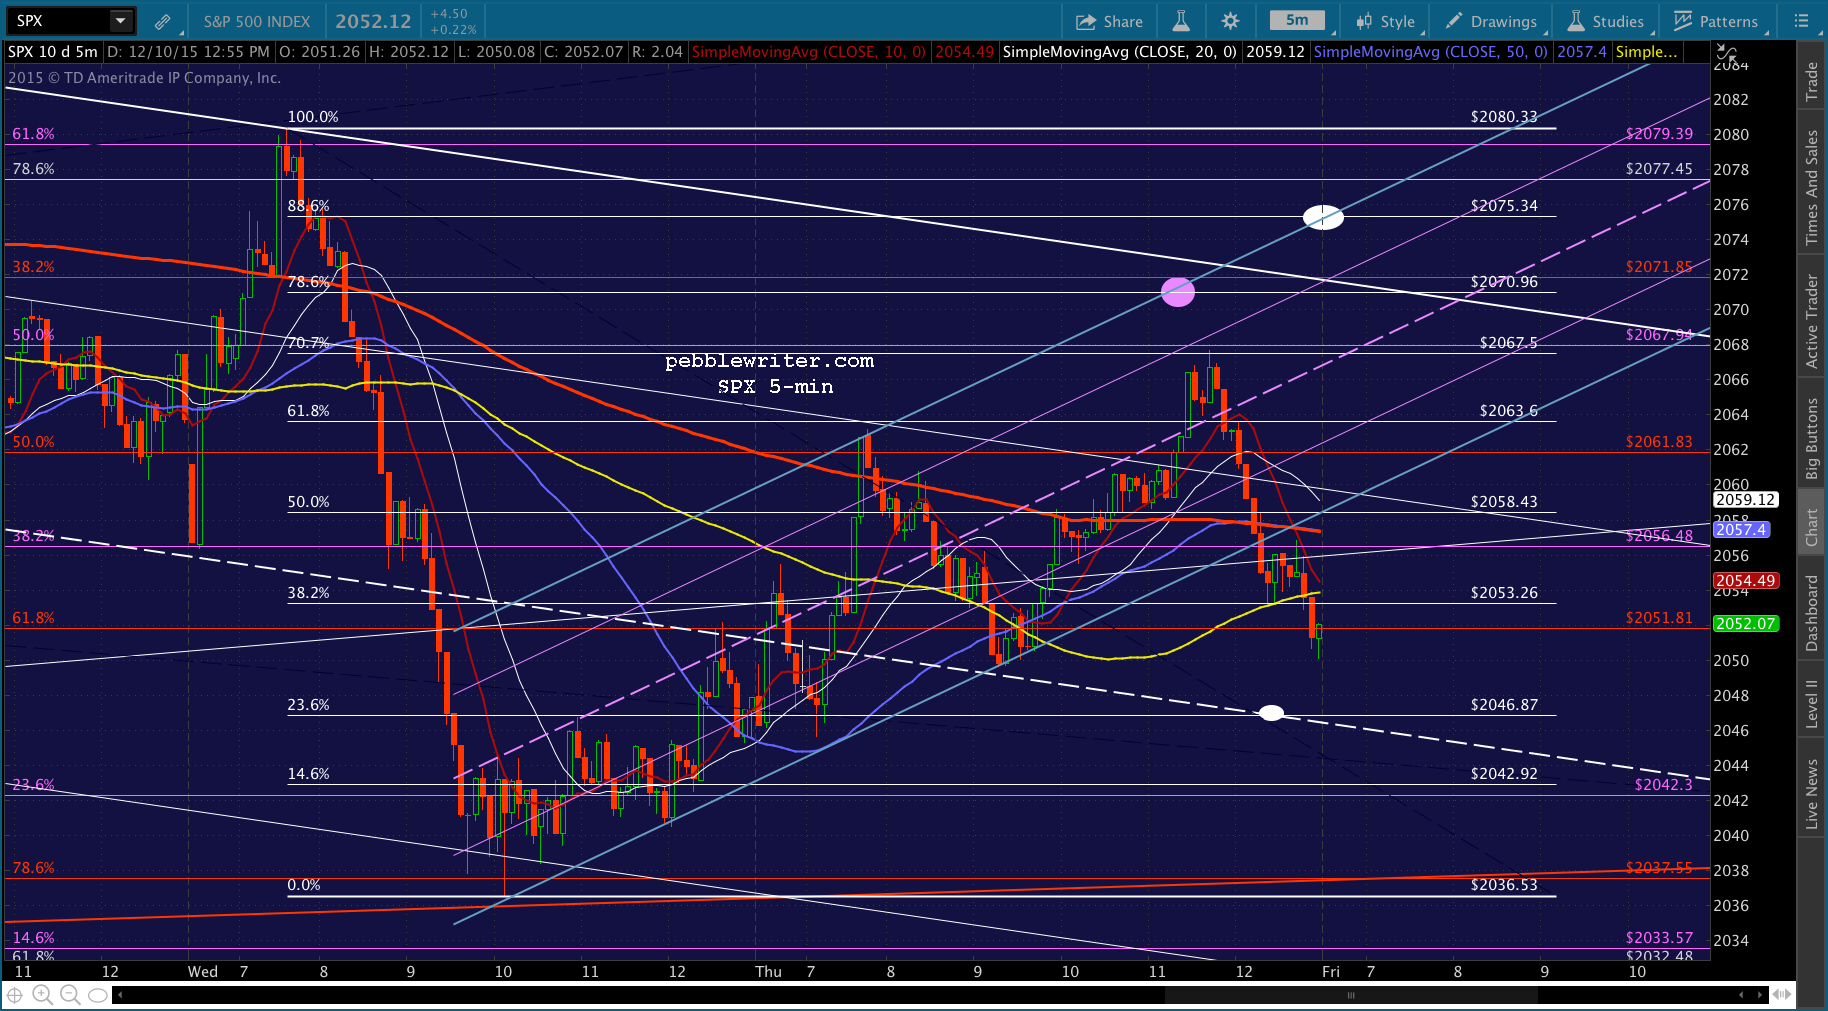
SPX just tumbled back to the white channel .786 line for, presumably for a backtest. If it holds at 2066.40 or so, 2075 looks good. Otherwise, 2056 is the immediate downside target, followed by 2053, 2046 and 2029.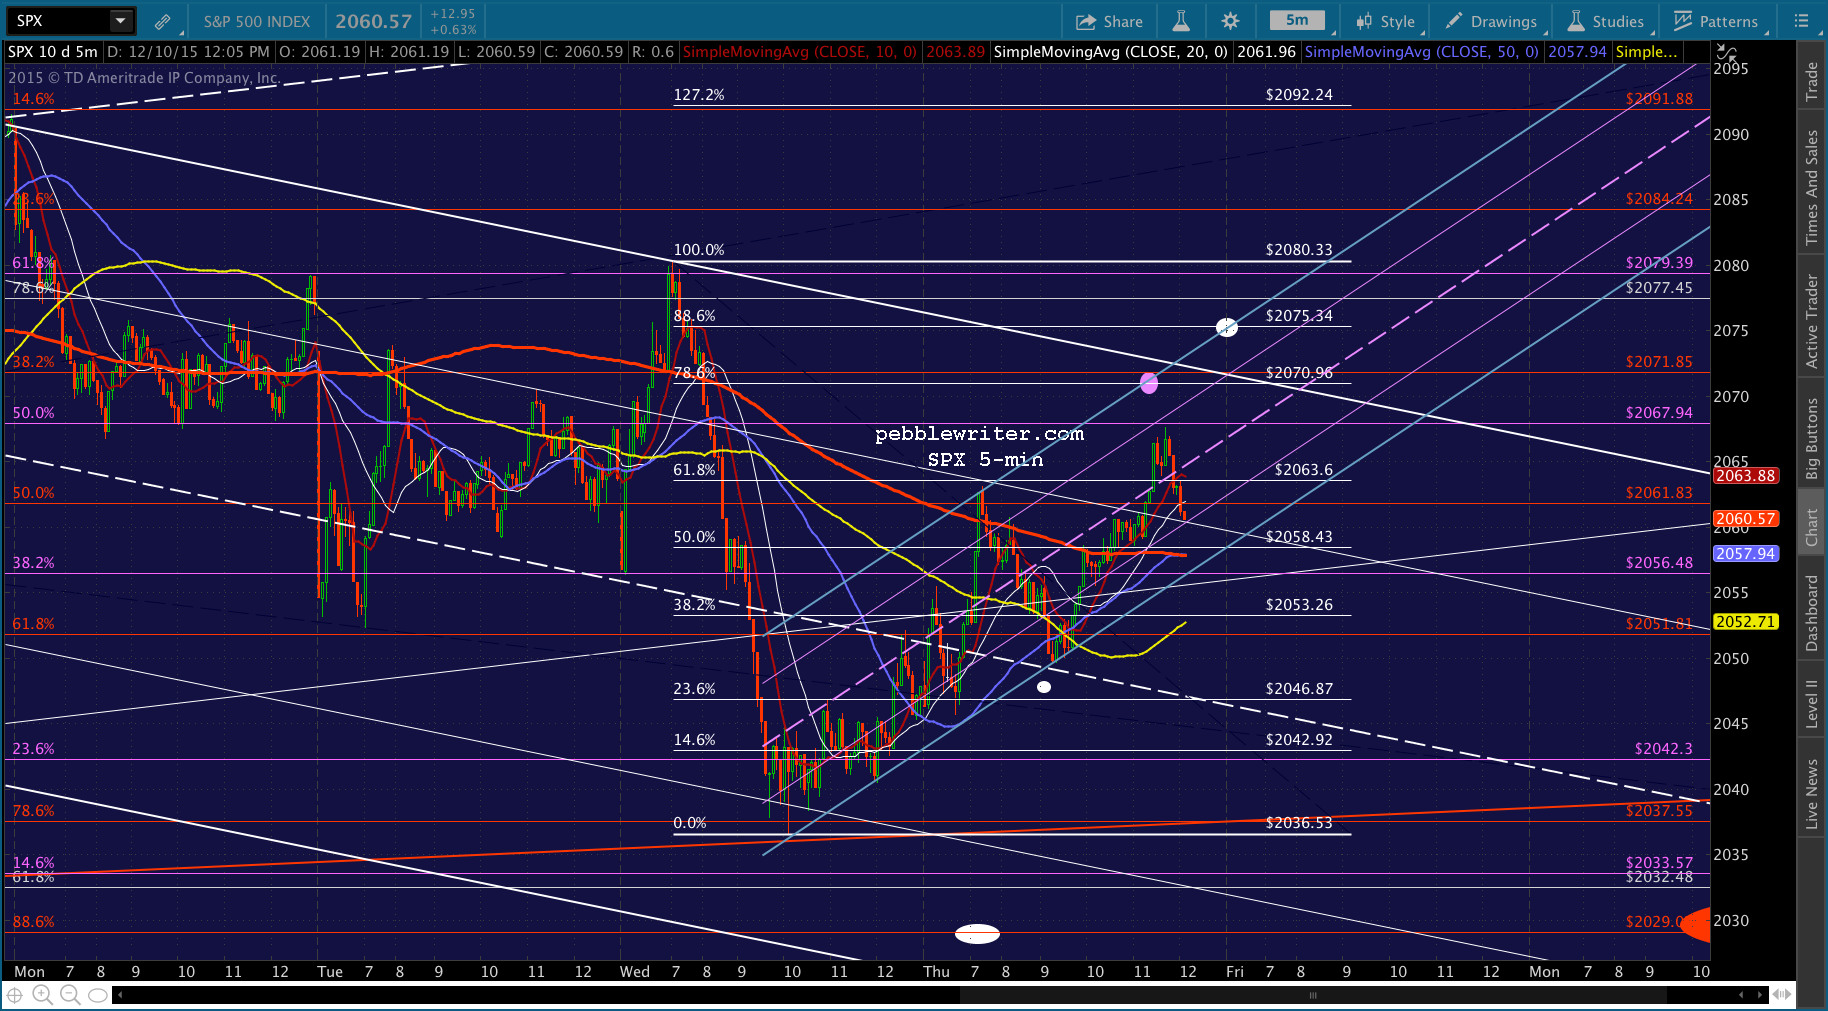
 UPDATE: 3:09 PM
ES is back below its SMA200, so we’re back to short. This weakness is unnerving.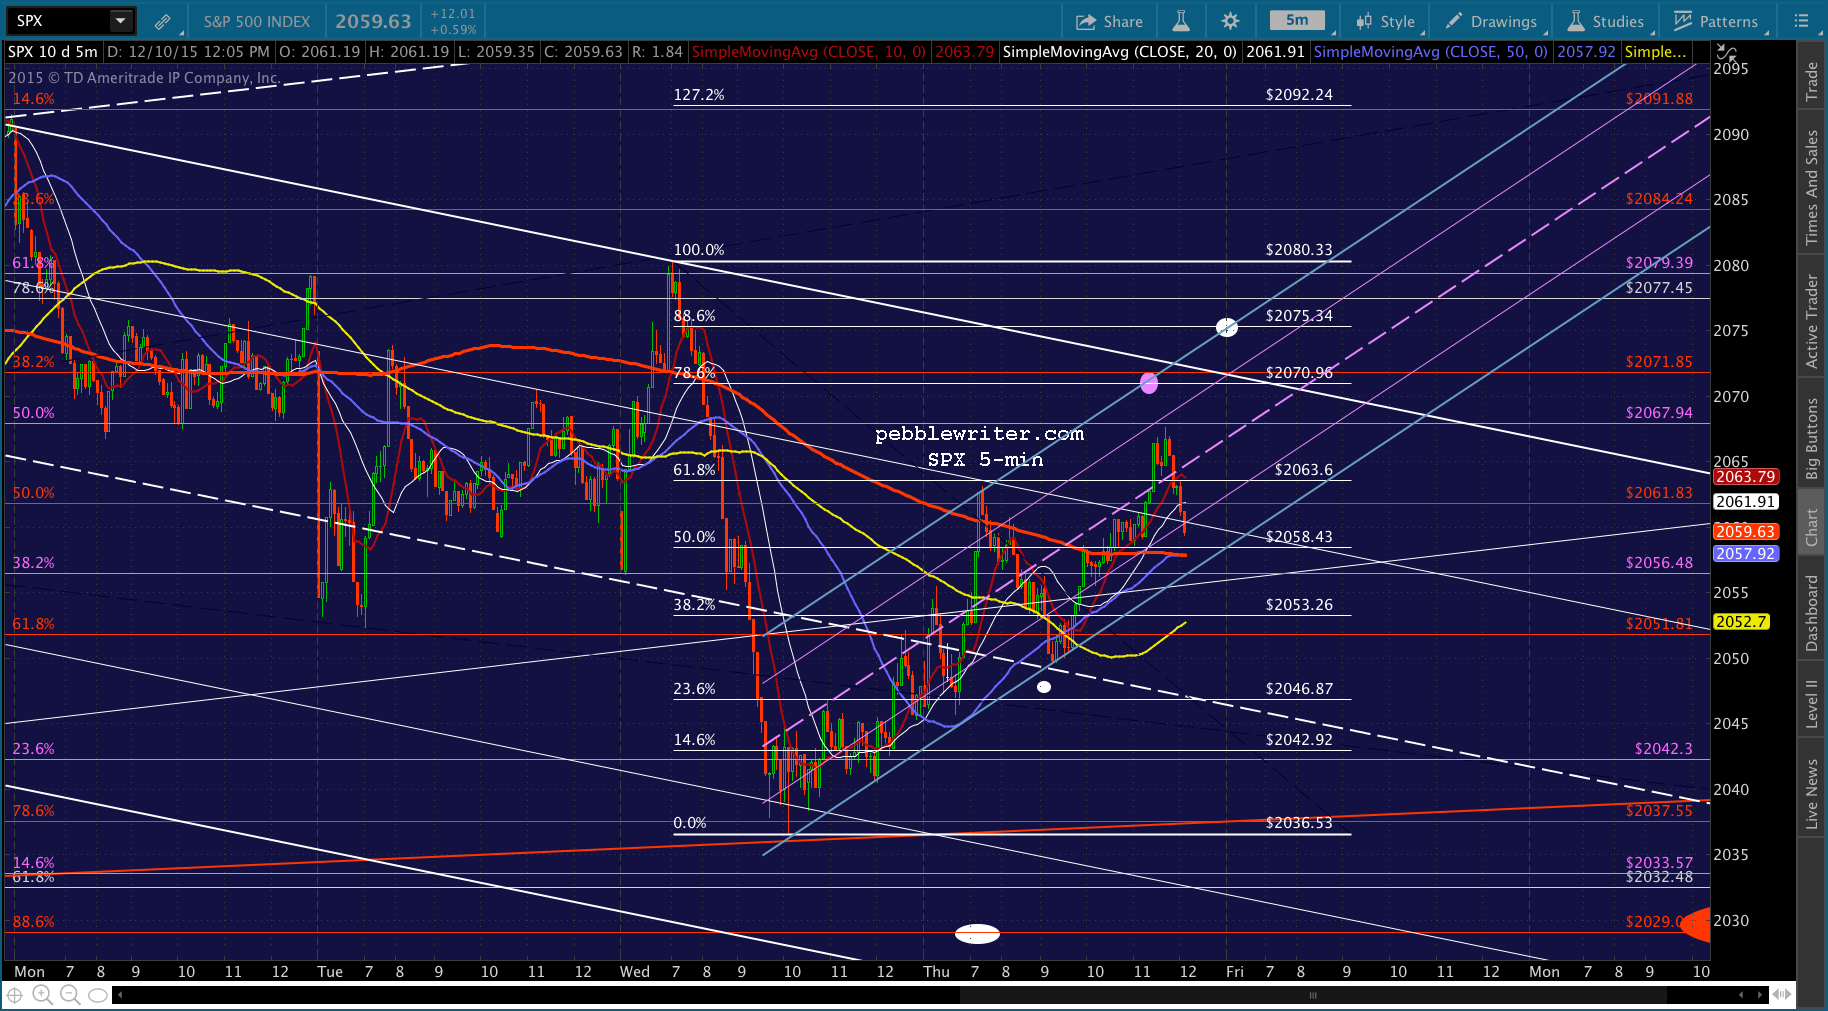 UPDATE: 3:15 PM
SPX is all the way back to the bottom of its channel. Back to long here. But, from the way it’s acting, it might not hold.  UPDATE: 3:21 PM
That certainly didn’t last long. Back to short.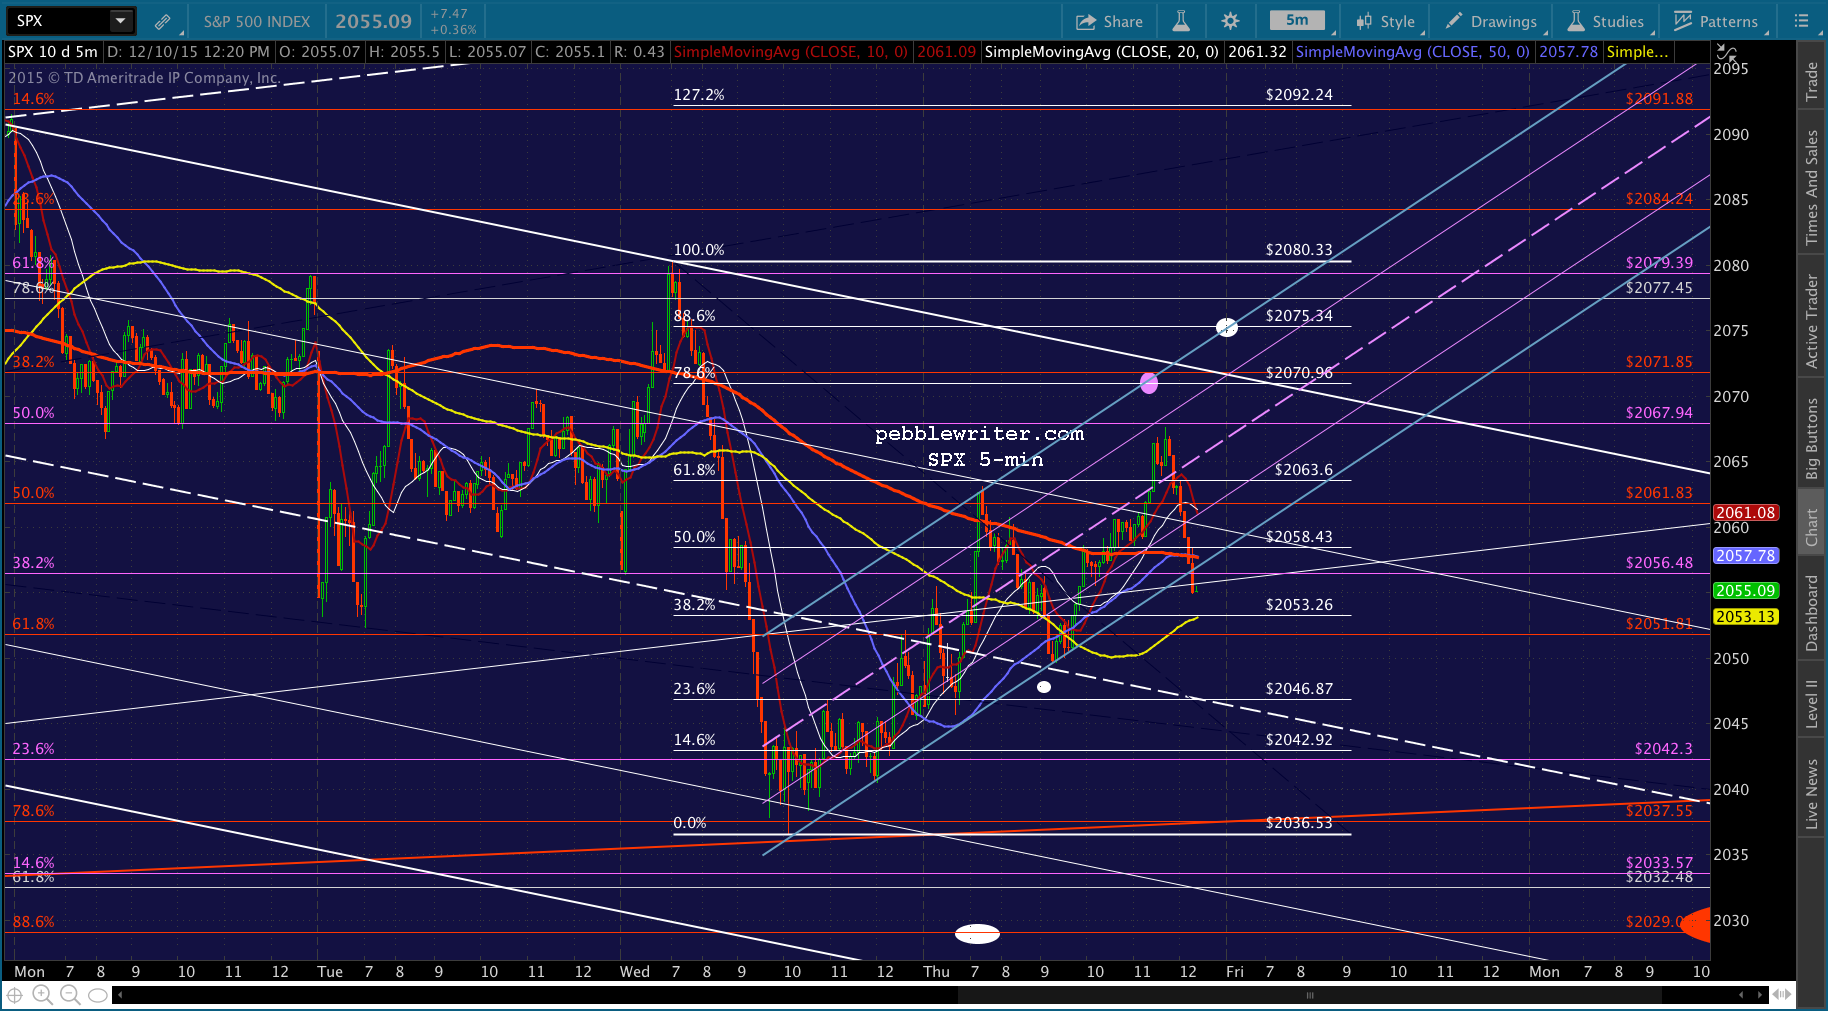 UPDATE: 3:57 PM
Overall a pretty frustrating day. Closing out the short here as USDJPY is temporarily backtesting the broken SMA200.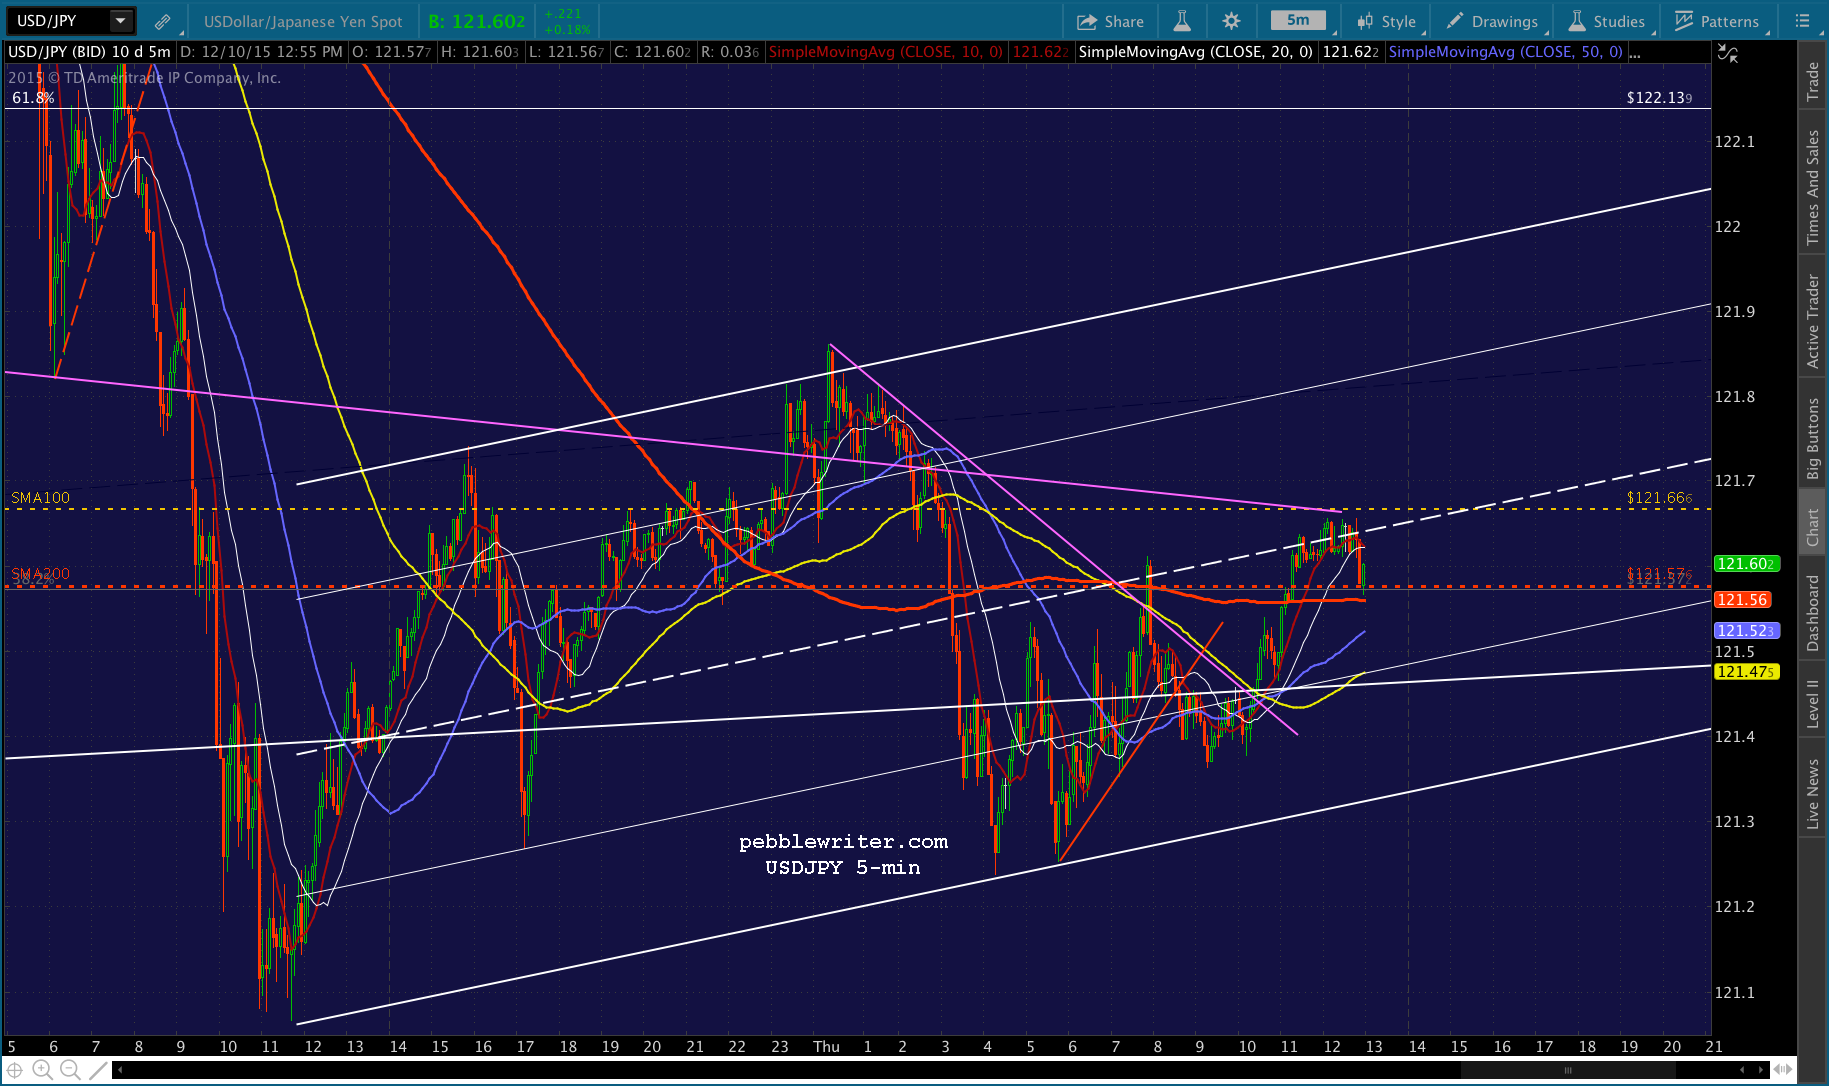
Comments
4 responses to “Now and Then”
you think those upside targets still valid or has it been negated
can a rate hike actually be bullish for equities since they move together, USD & spx? Since a rate hike will actually rocket USD up.. and so far the decline this week doesn’t seem impulsive at all.
switched to new contract. When will you be doing that thanks will switch back if you are not makes the numbers all different for me anyway
For charting purposes, I generally stay with the continuous contract ES, which is still showing December. Otherwise, I have to move all 100+ chart drawings from one symbol to another — and, something often gets lost in the translation. More shortly…