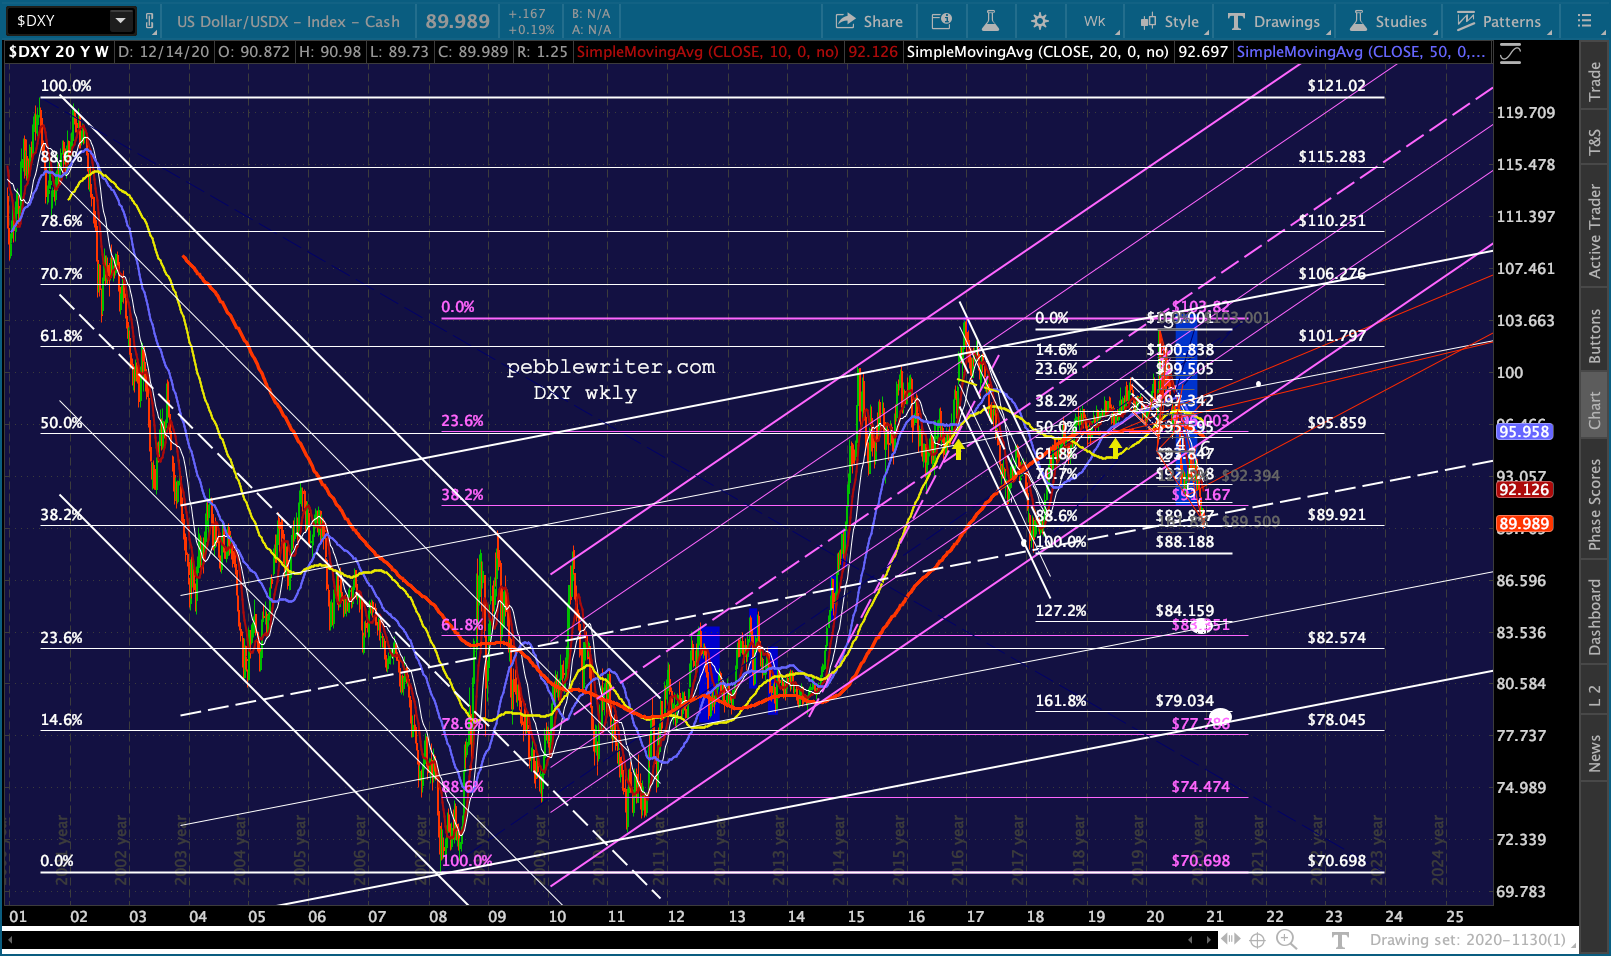
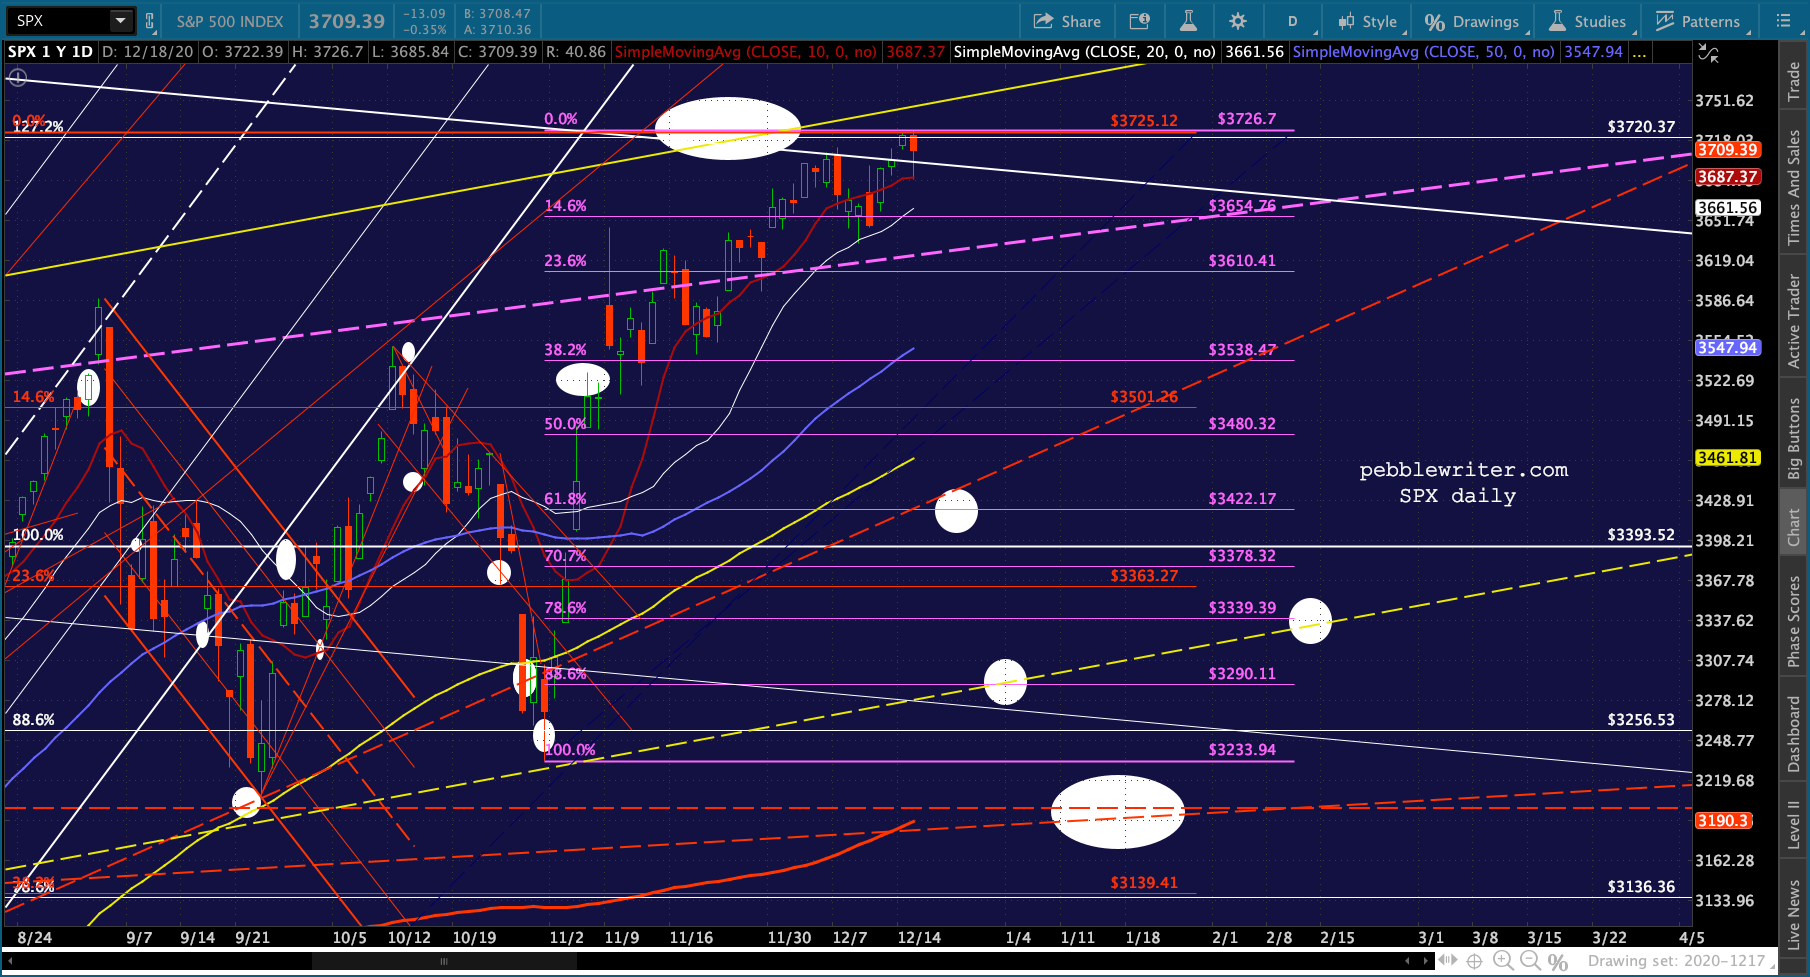
Almost four months ago [see: Aug 24, 2020 Update] we noted that the next overhead resistance once ES broke above its Feb 3397.50 highs was the 1.272 Fib extension at 3730.37.
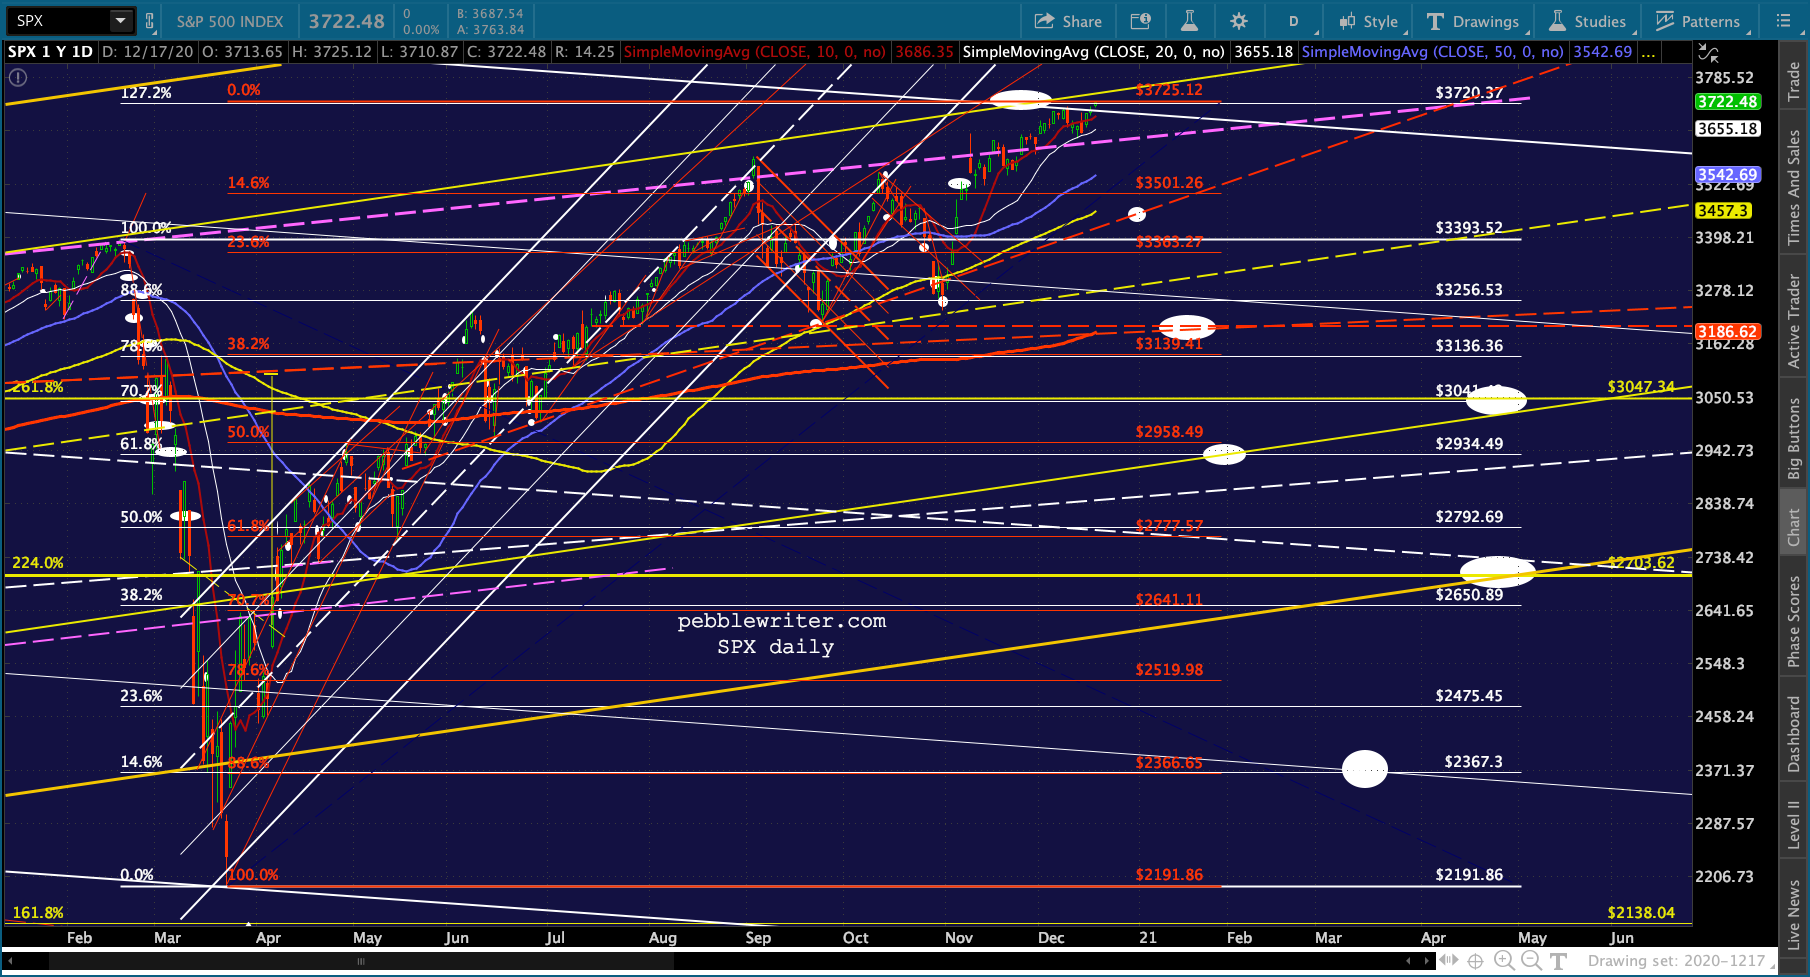
Seeing ES pop above its former highs means there is no specific overhead Fib resistance until the 1.272 extension at 3730.29 (SPX 3720.37.)
I didn’t consider gaining another 10% all that likely, so didn’t even bother showing it on a chart at the time. In fact, ES’ first two pushes above 3397.50 failed miserably. It wasn’t until Nov 4 that it finally left the former highs in its rear view mirror.
Last night ES got within 7 points of that resistance we discussed all those months ago, reaching 3723 on quad-witching eve – begging the question “has the rally run its course this time?” It certainly appears so. continued for members…
The bigger picture shows a nice intersection of trend lines, channel lines and that Fib. 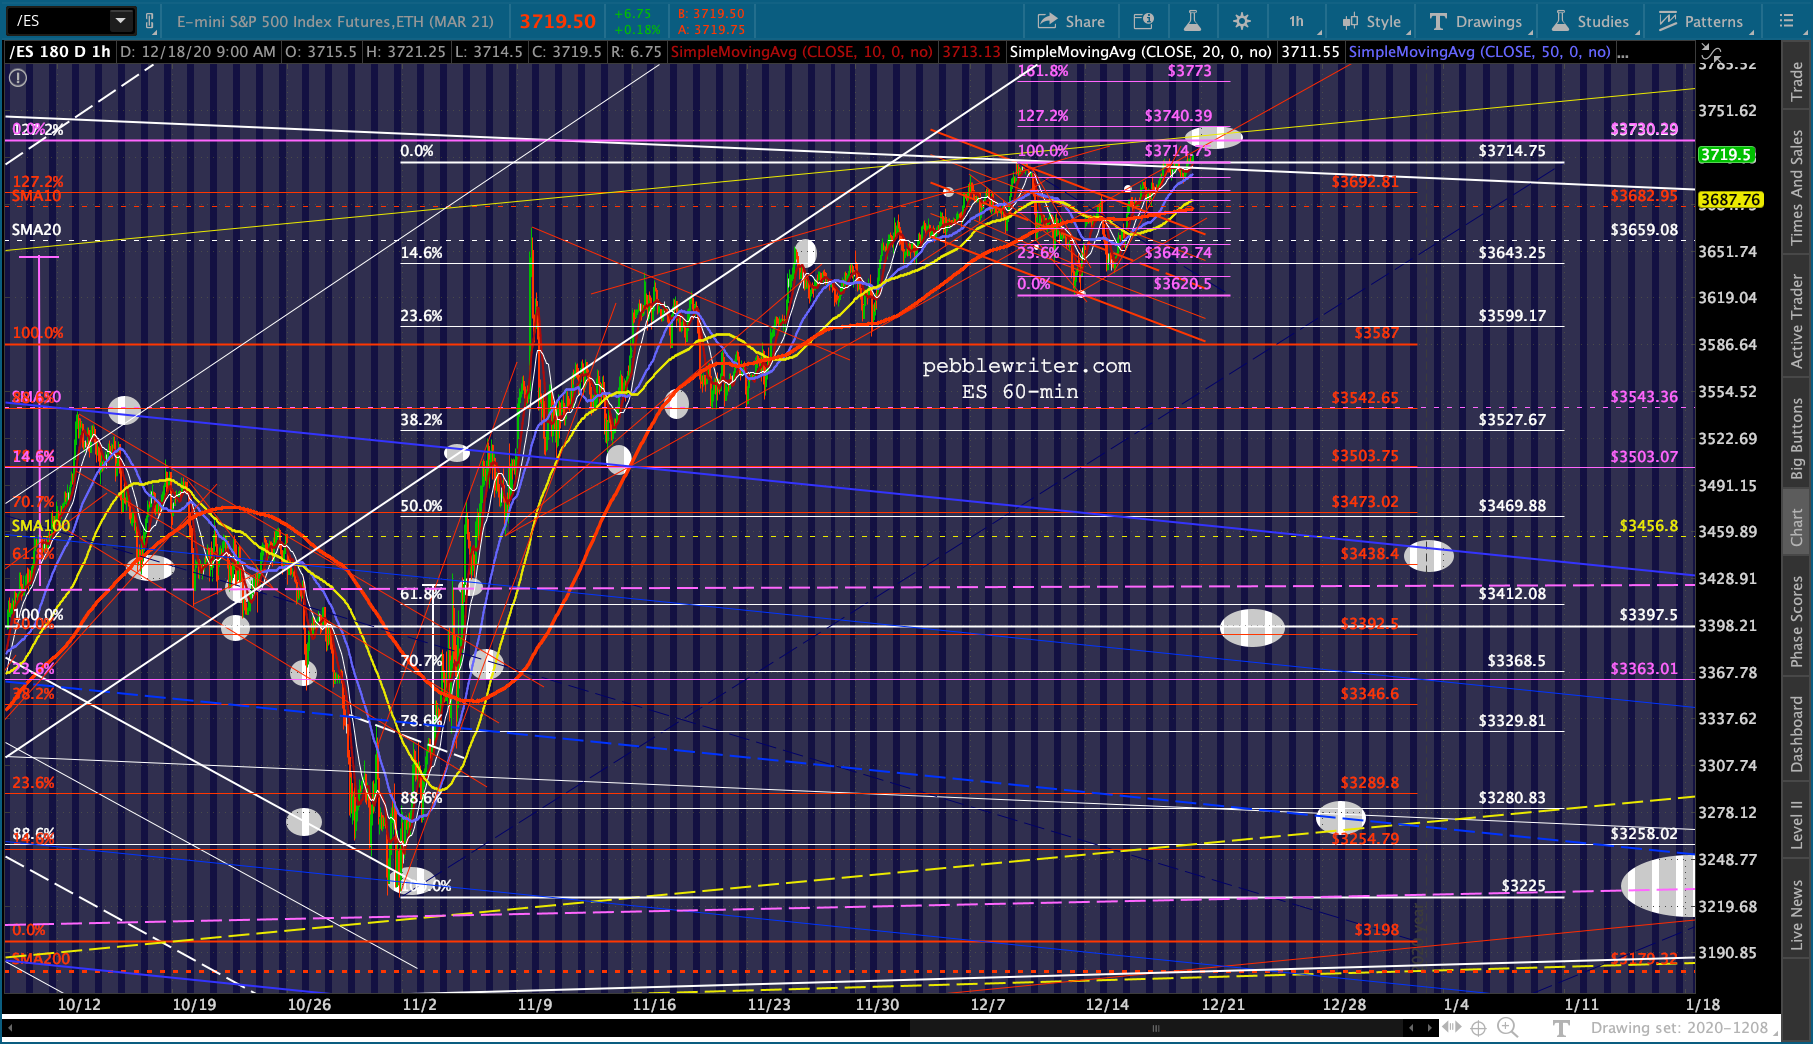 Especially for SPX.
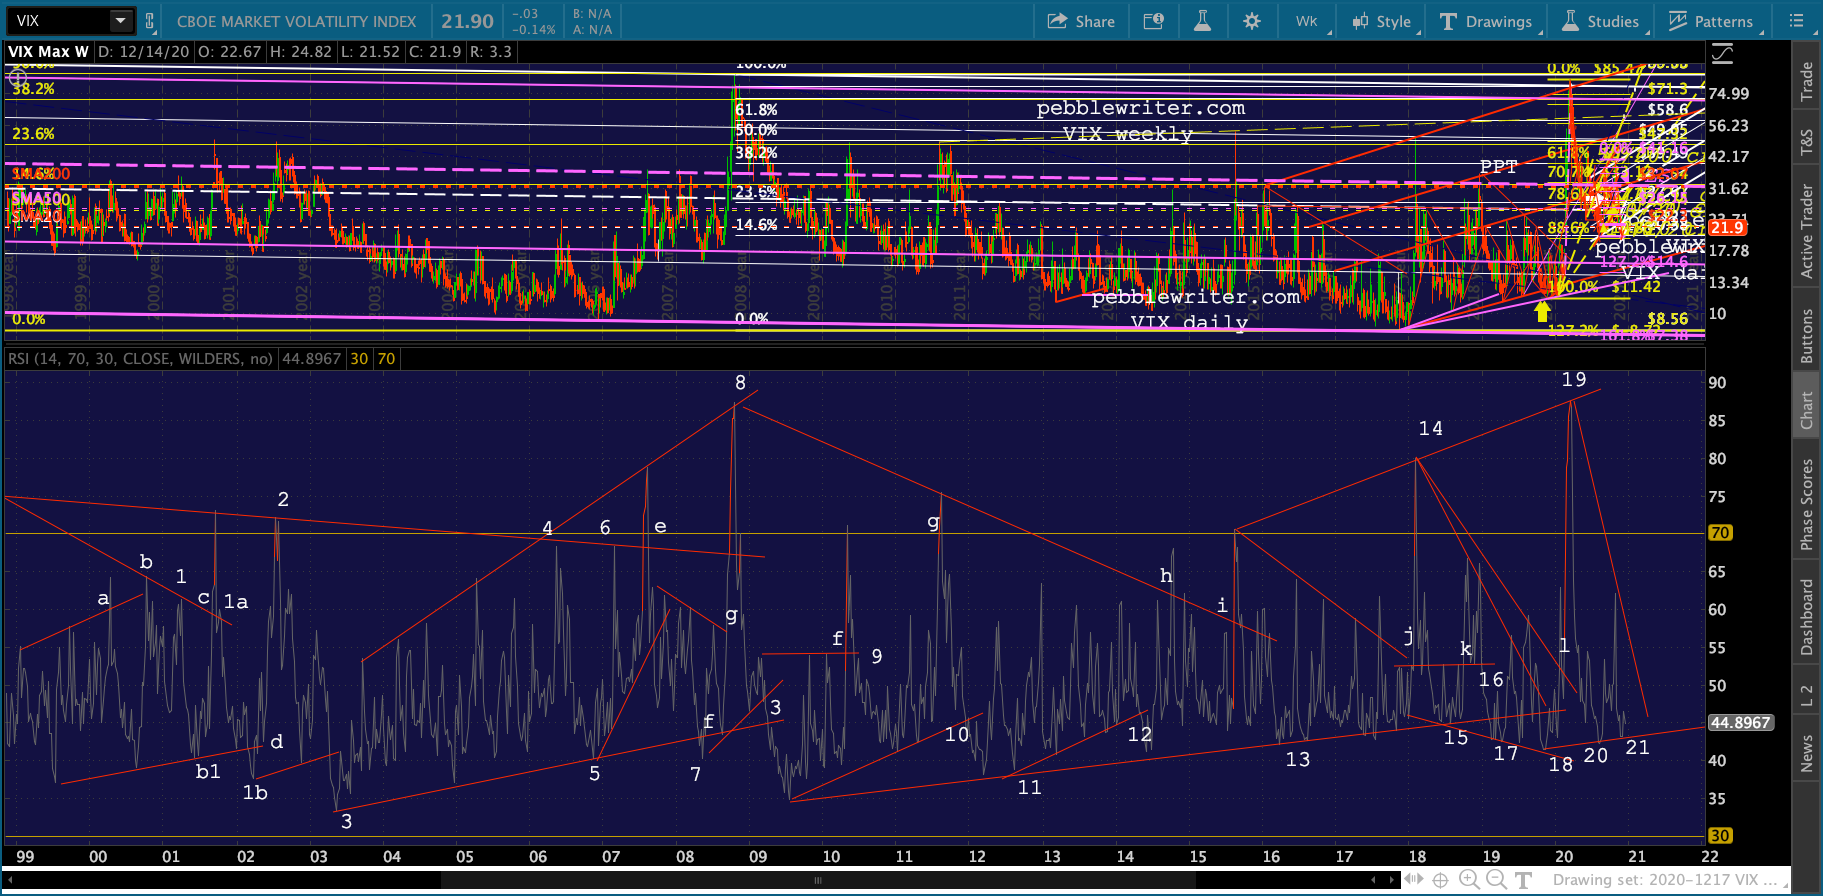
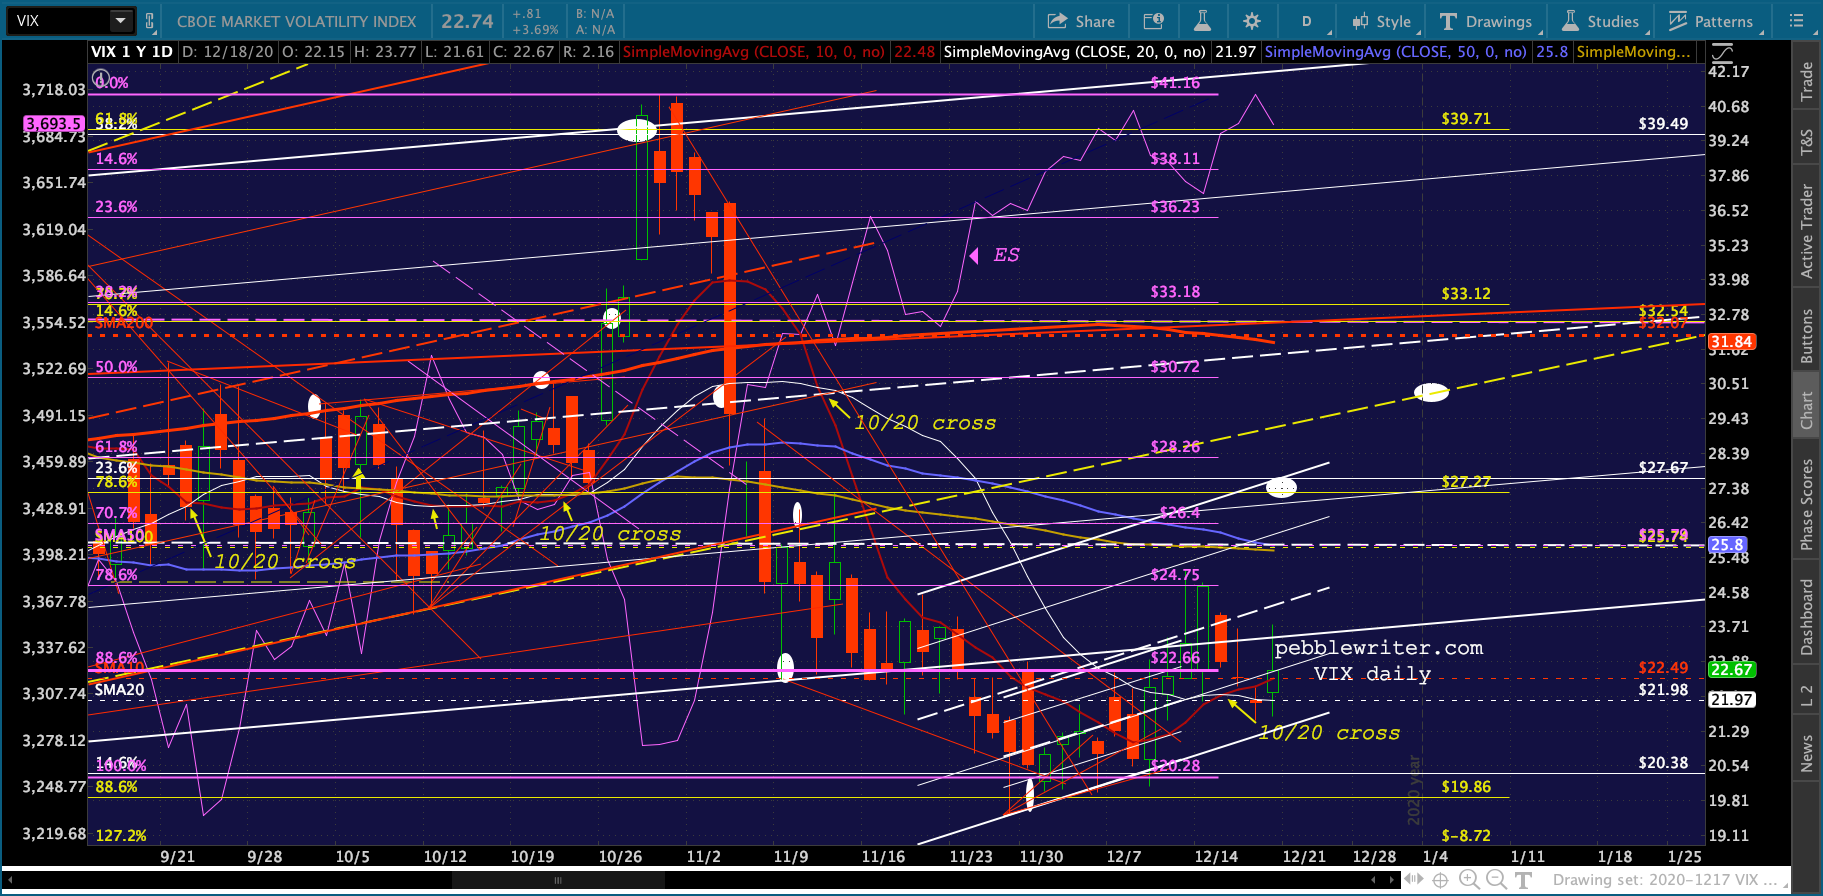
 VIX’s 10/20 cross is widening.
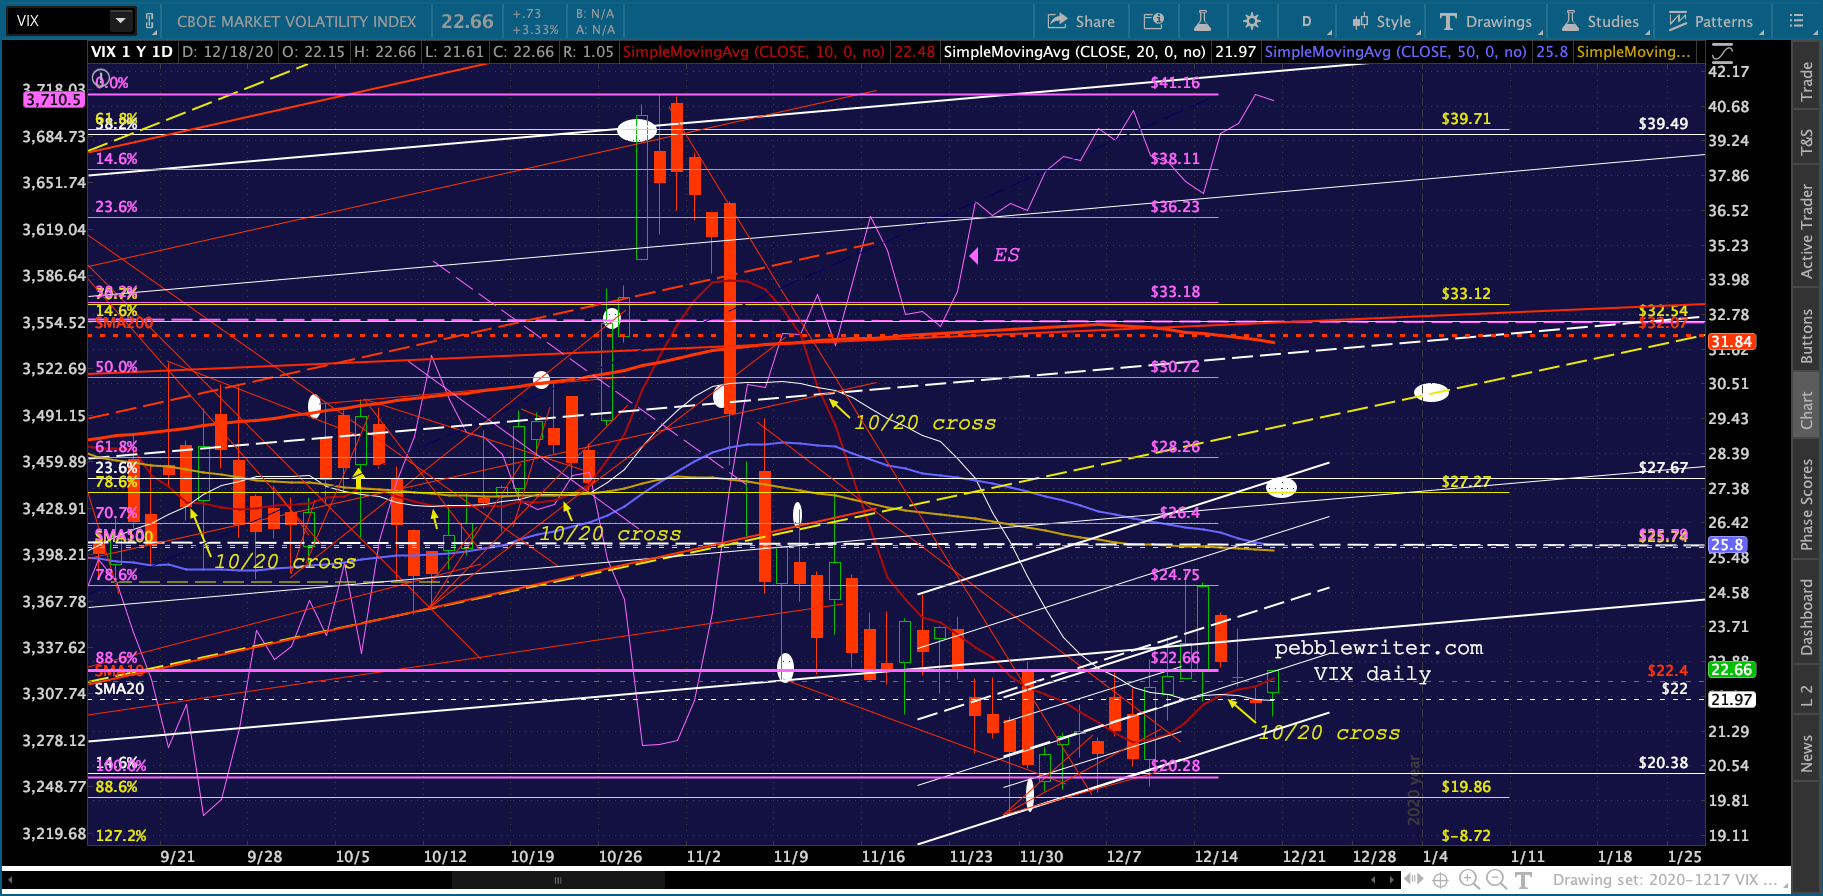 And, an RSI model I frequently consult indicates more upside for VIX/downside for stocks.
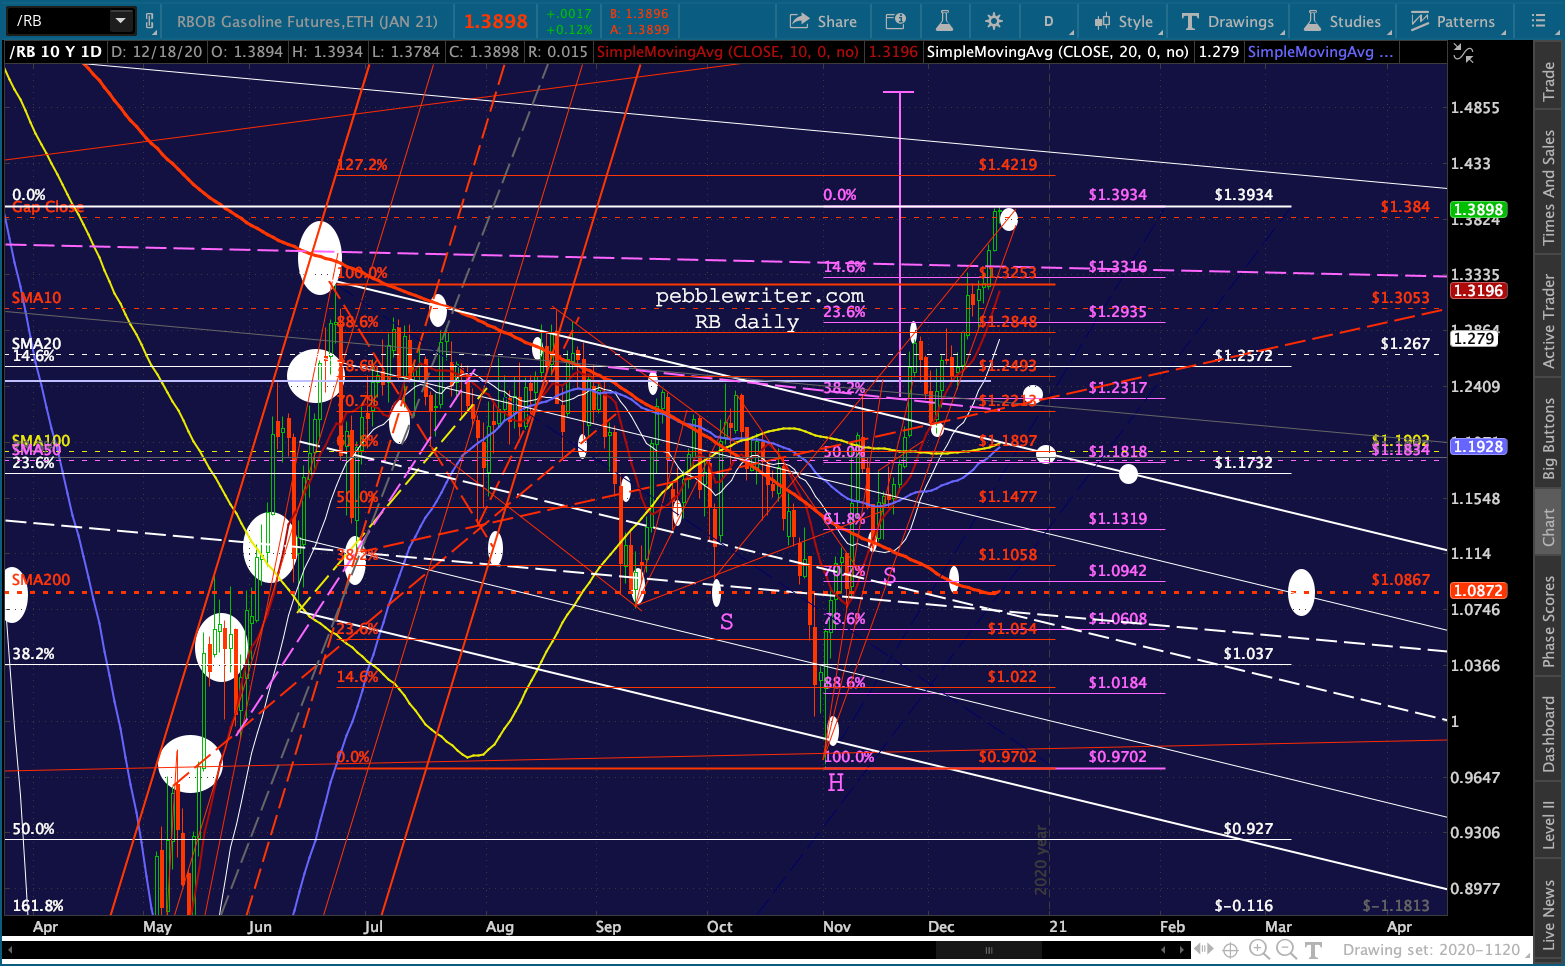
 RB has closed its gap and will likely reverse here at 1.3934.
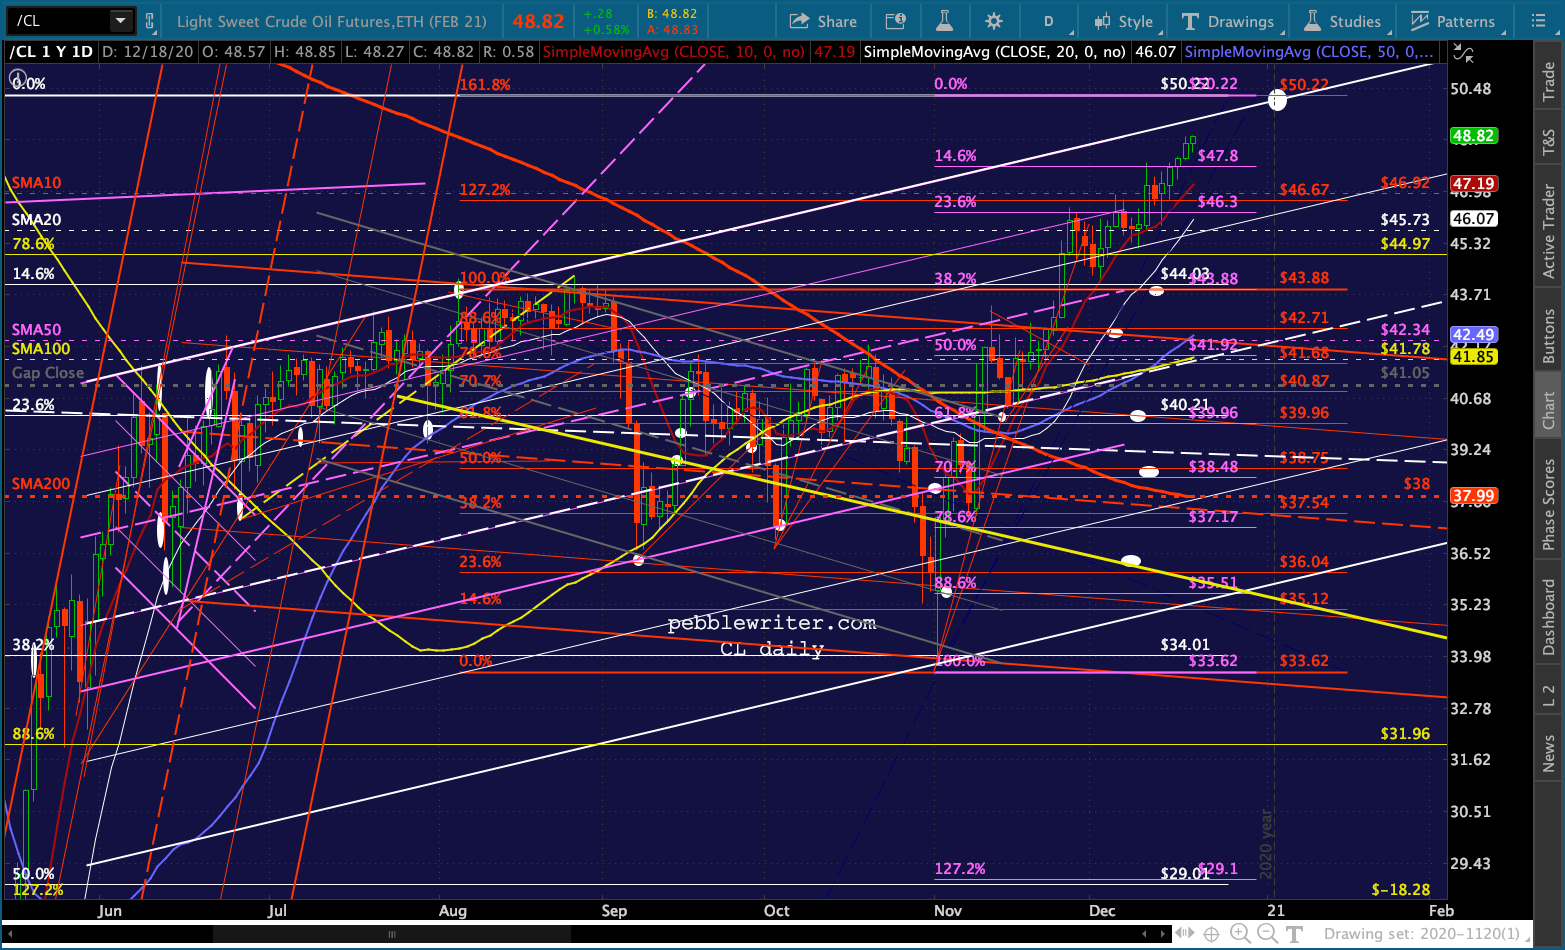
 CL is also ripe for a reversal here at 48.82 – 49.50 – though it could eke a little higher first – potentially as high as 50-50.22.
 The big story, though, remains in the currency pairs. DXY will likely bounce here, with EURUSD’s reversal probably coming ahead of USDJPY’s next drop.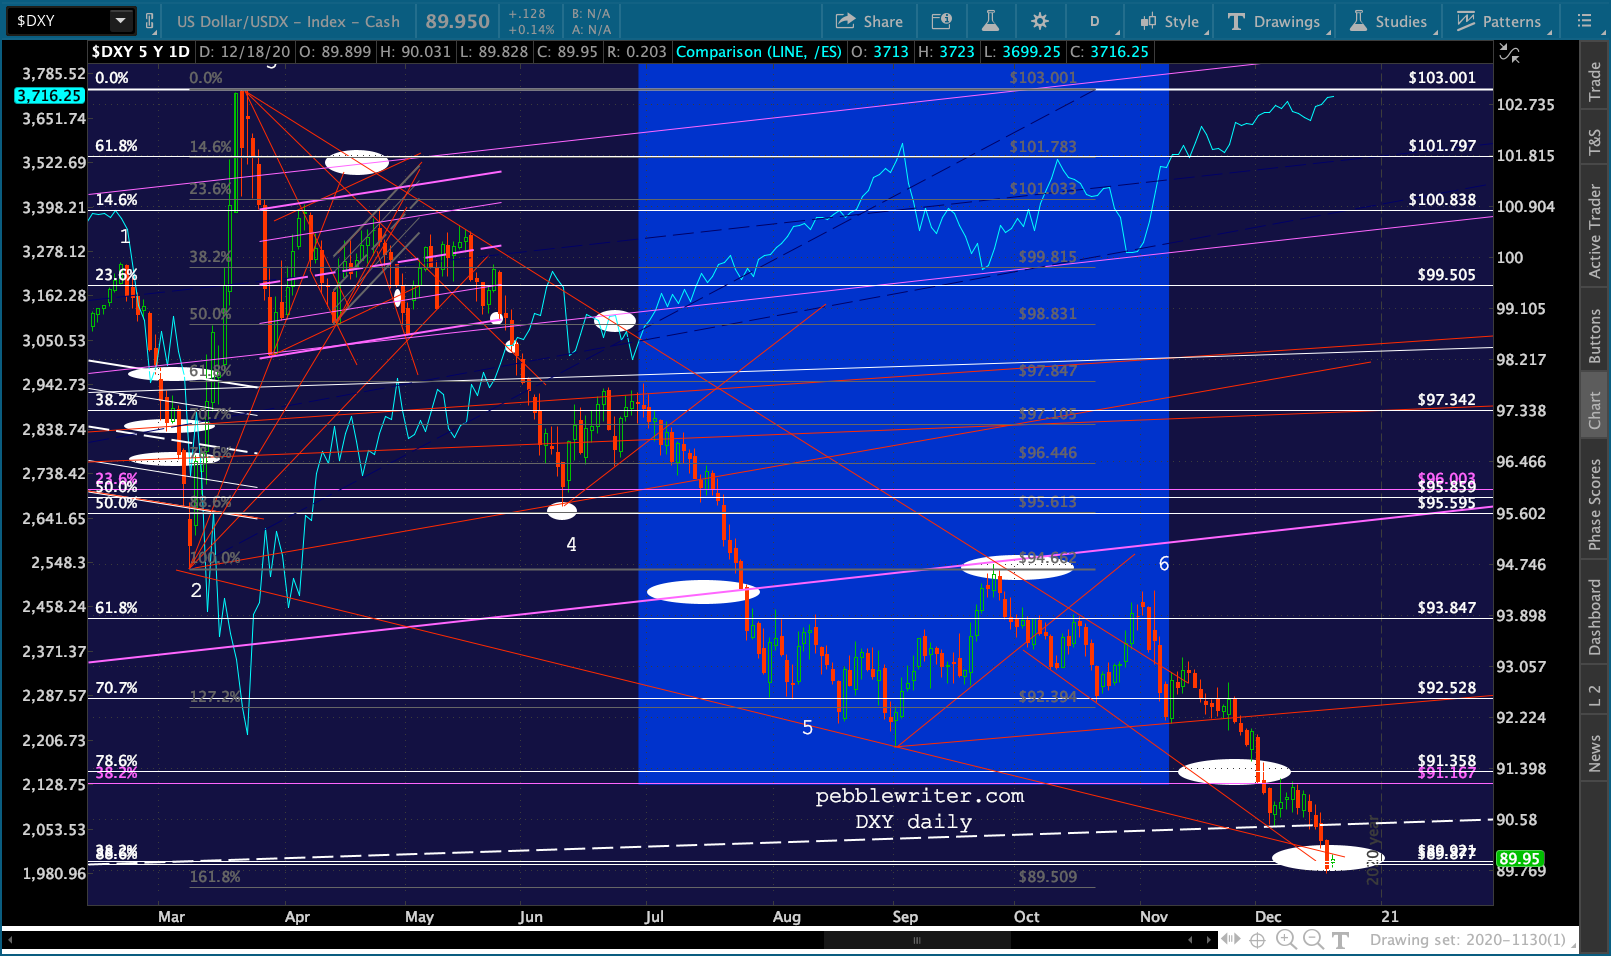
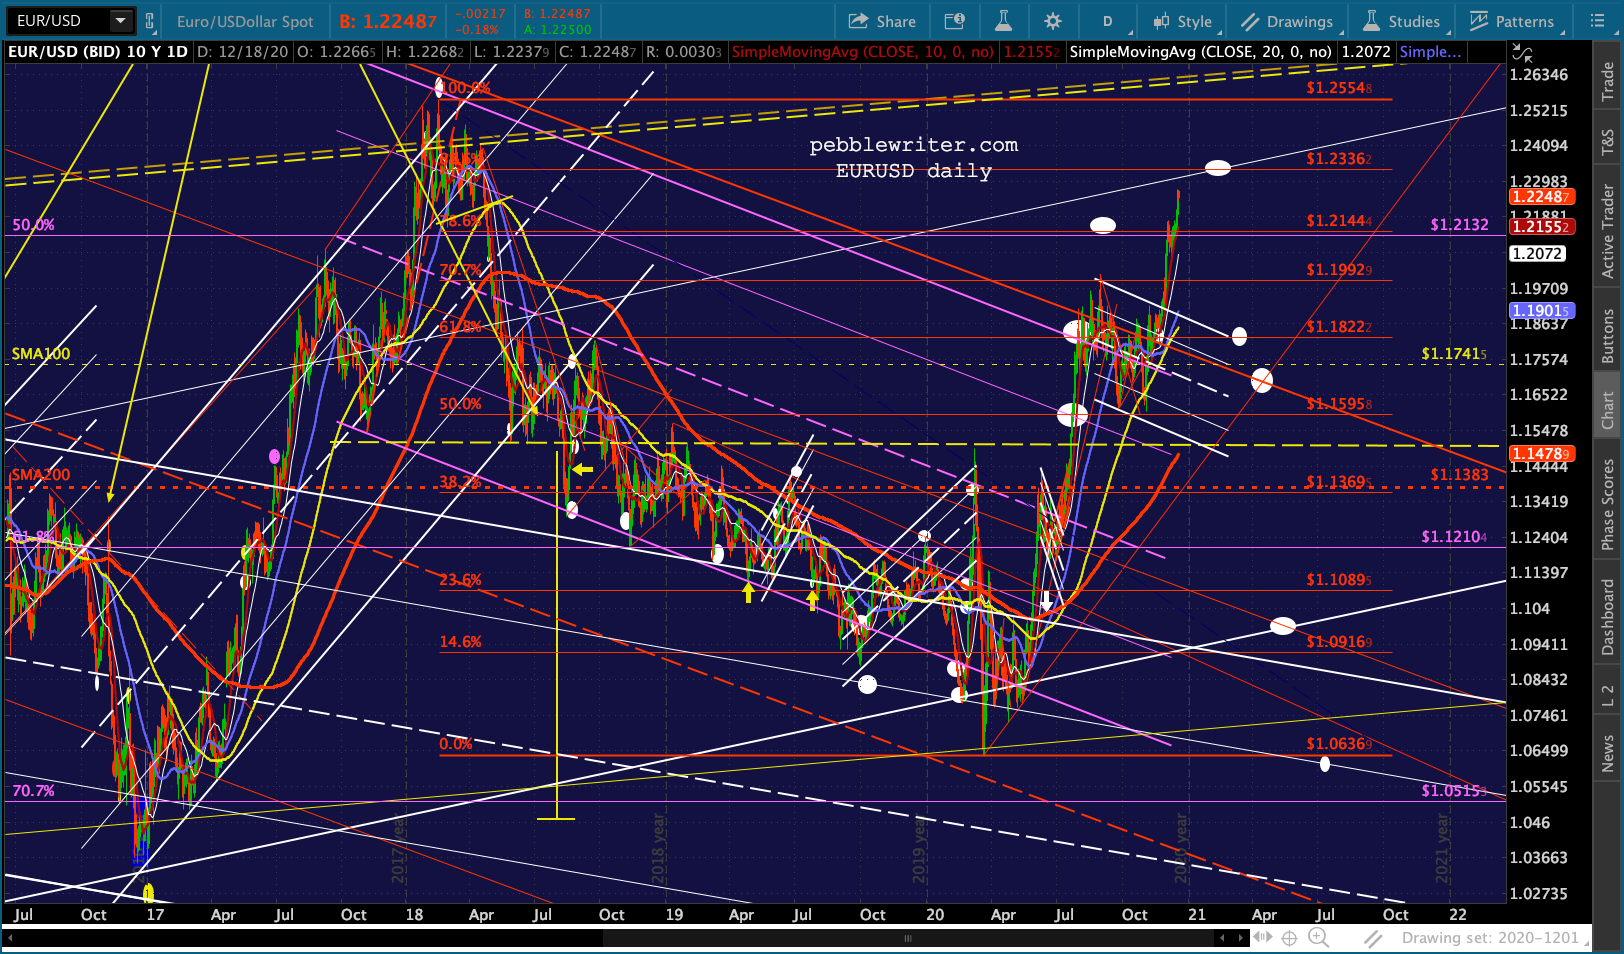
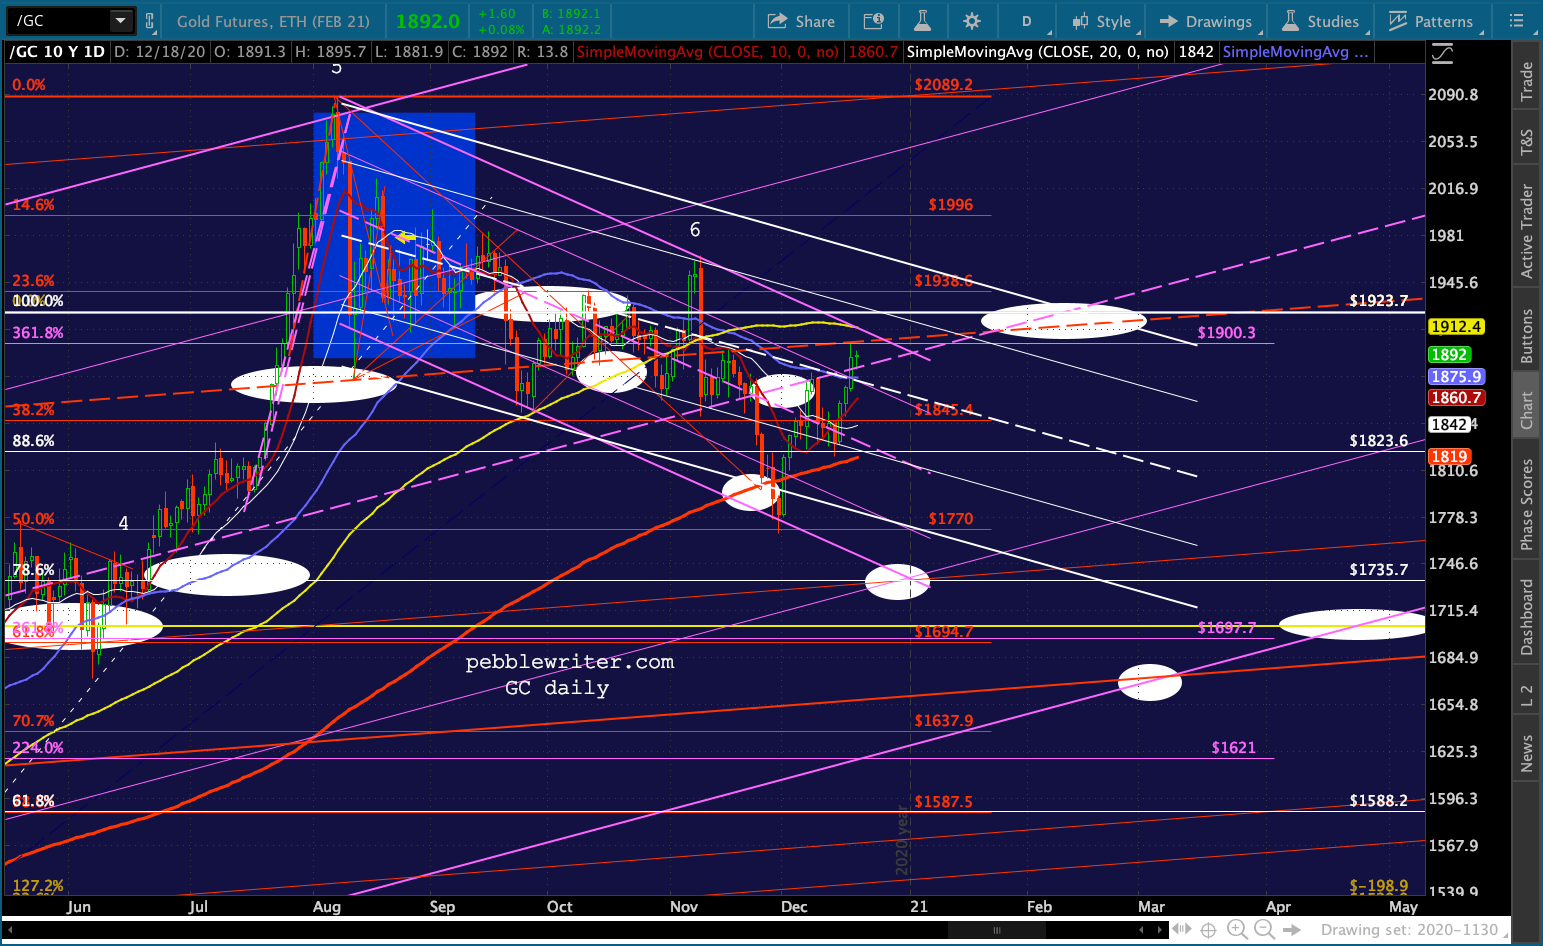
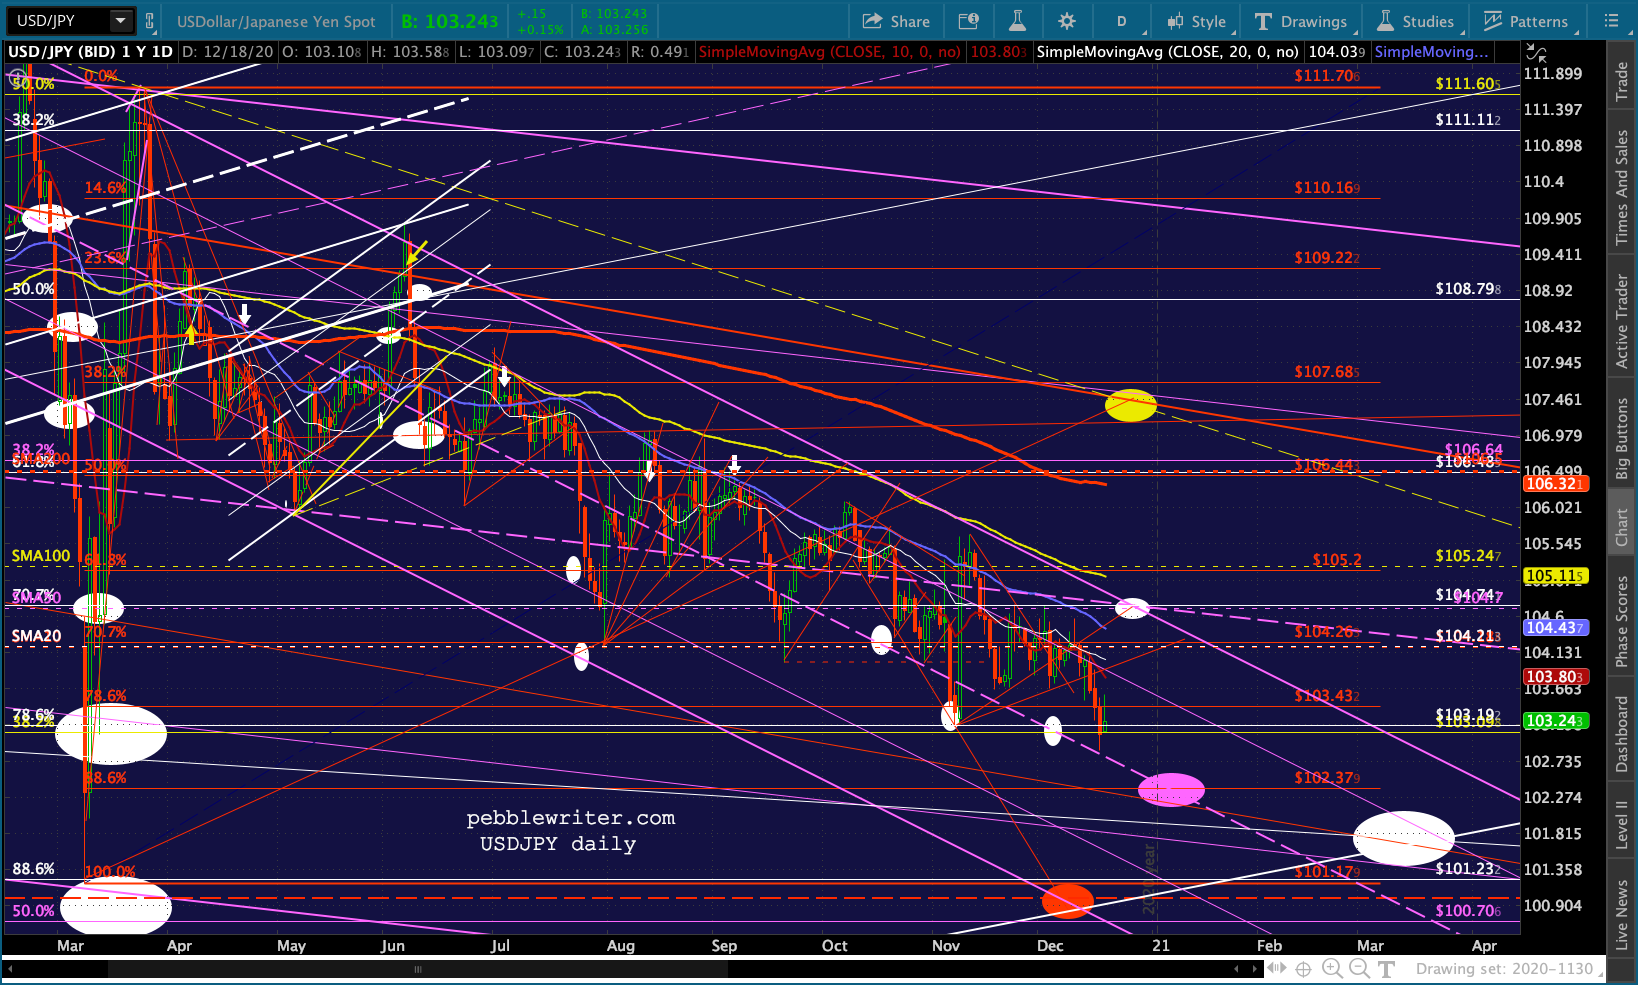 GC’s stall at a backtest of the purple and red channel midlines suggests more DXY strength.
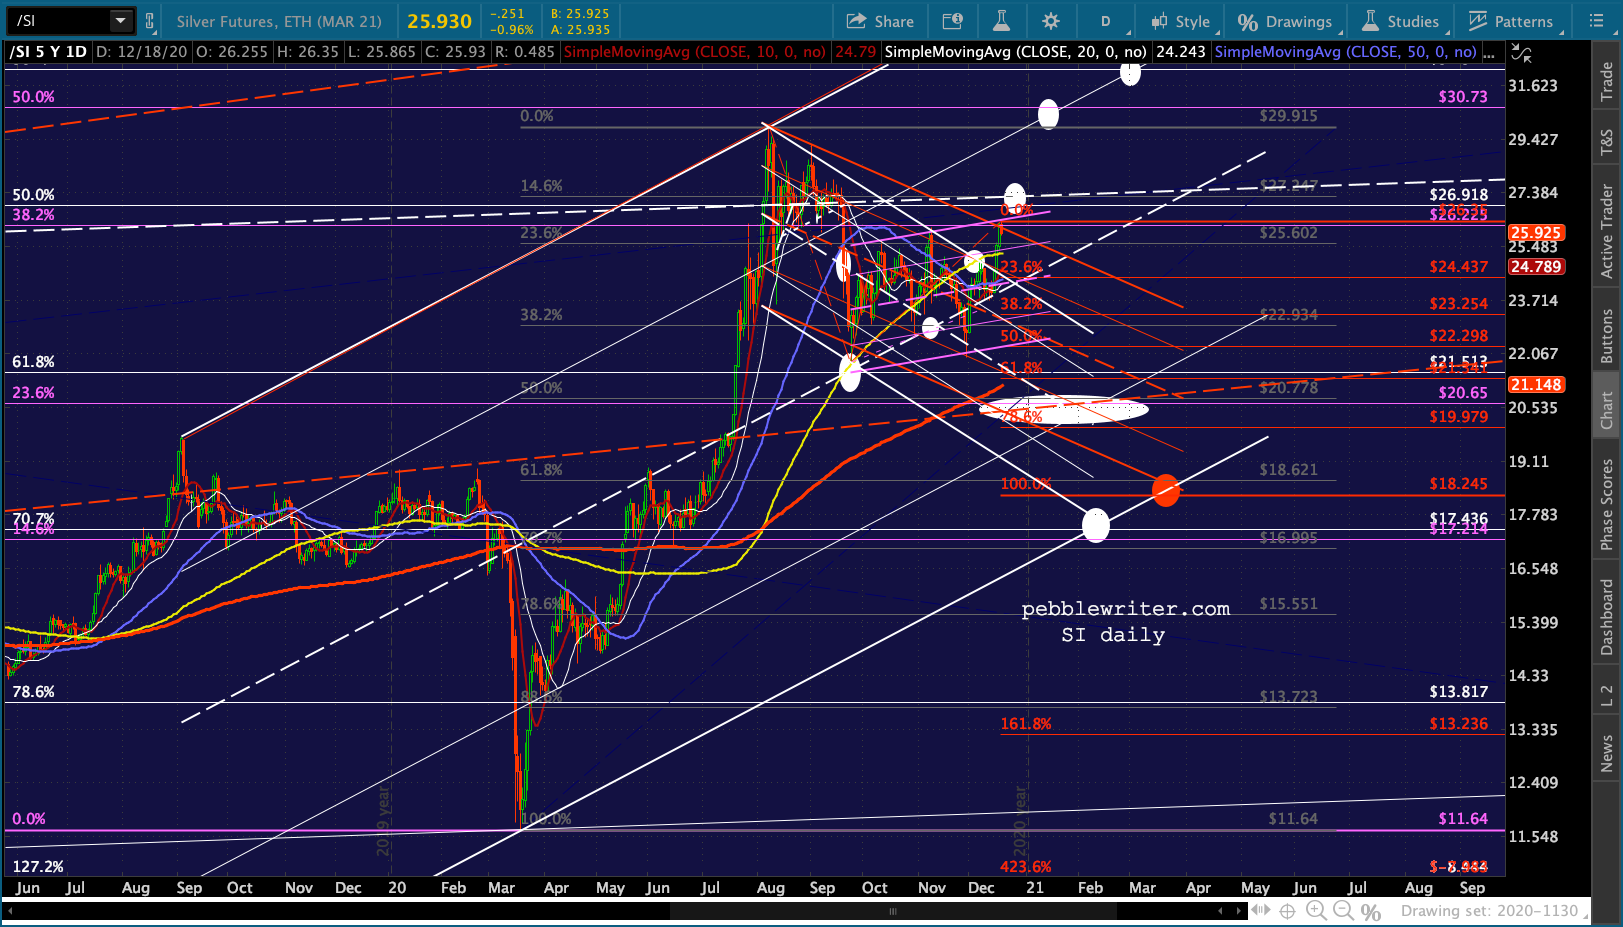
  Though SI is in no-man’s land from a Fib standpoint, it has completed a little flag pattern that points to 18.24 – quite close to the .618 retracement at 18.621. Here’s the chart showing the recent breakout of the falling white channel.
 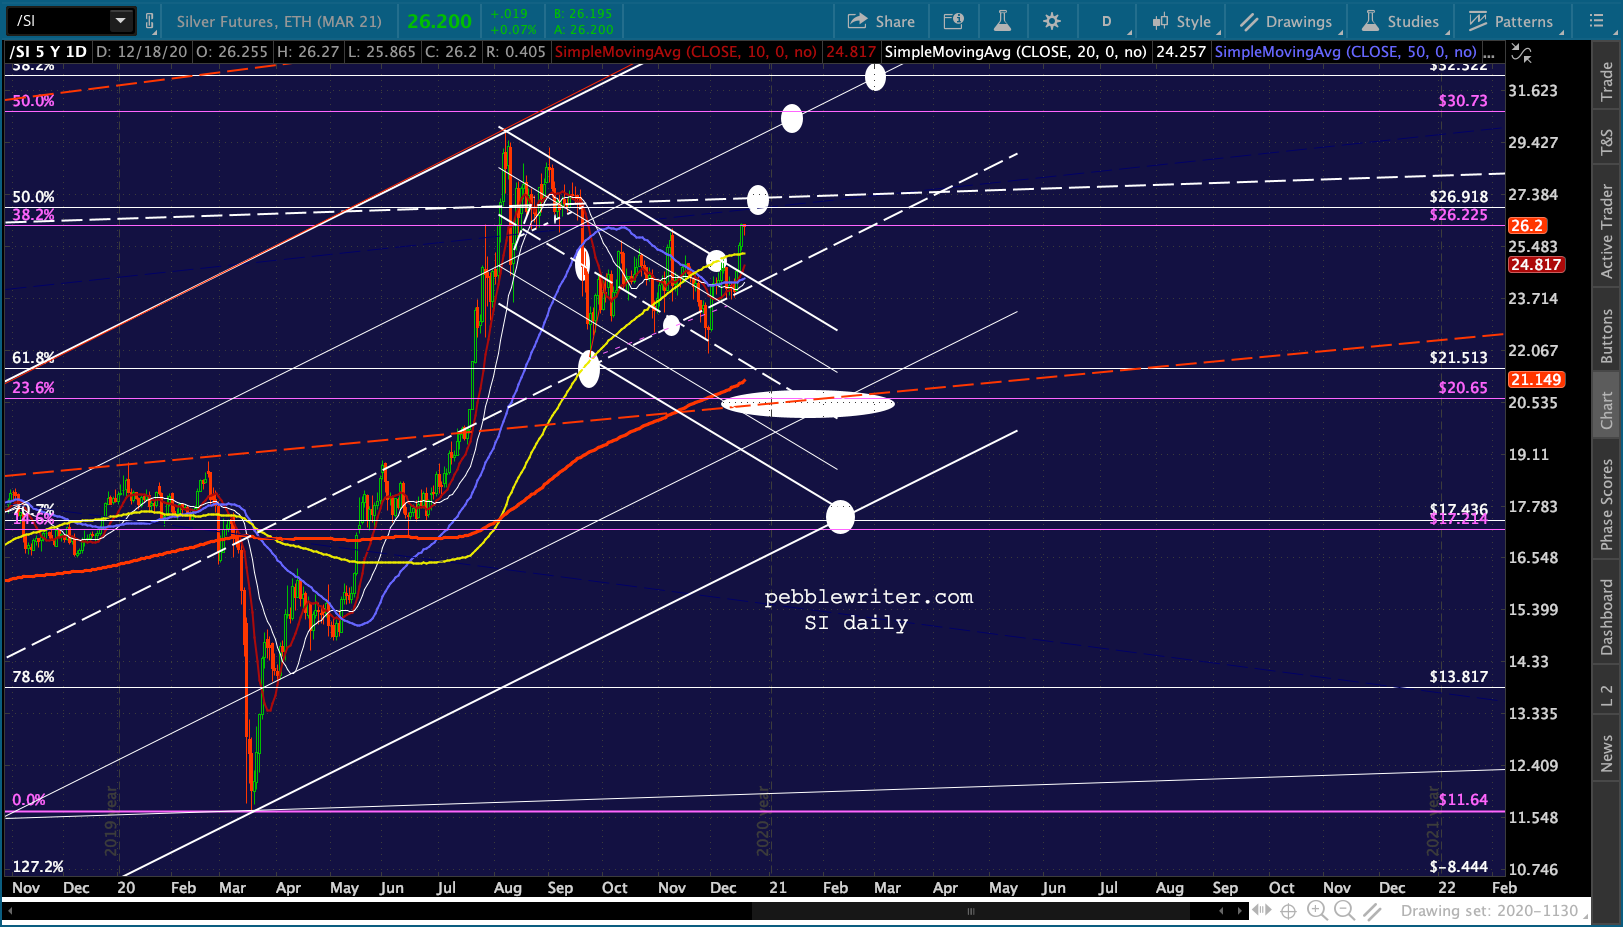 And, here’s an alternative view. It’s not terribly different from the previous white downside target. I still feel like the red TL – currently at 20.56, just below the SMA200 at 21.15 – would be important support.
 Last, our yield curve model still points to at least a pullback. Remember, both a breakout and a reversal are bearish for stocks. At this point, 2s10s remains on the brink of a breakout.
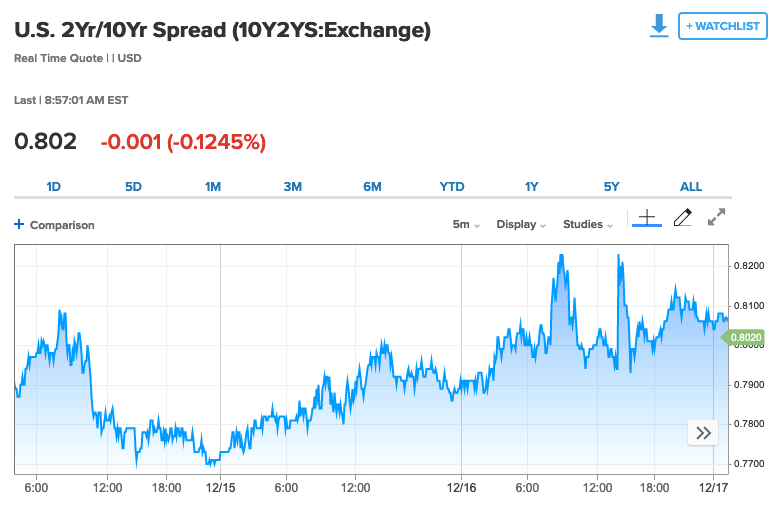
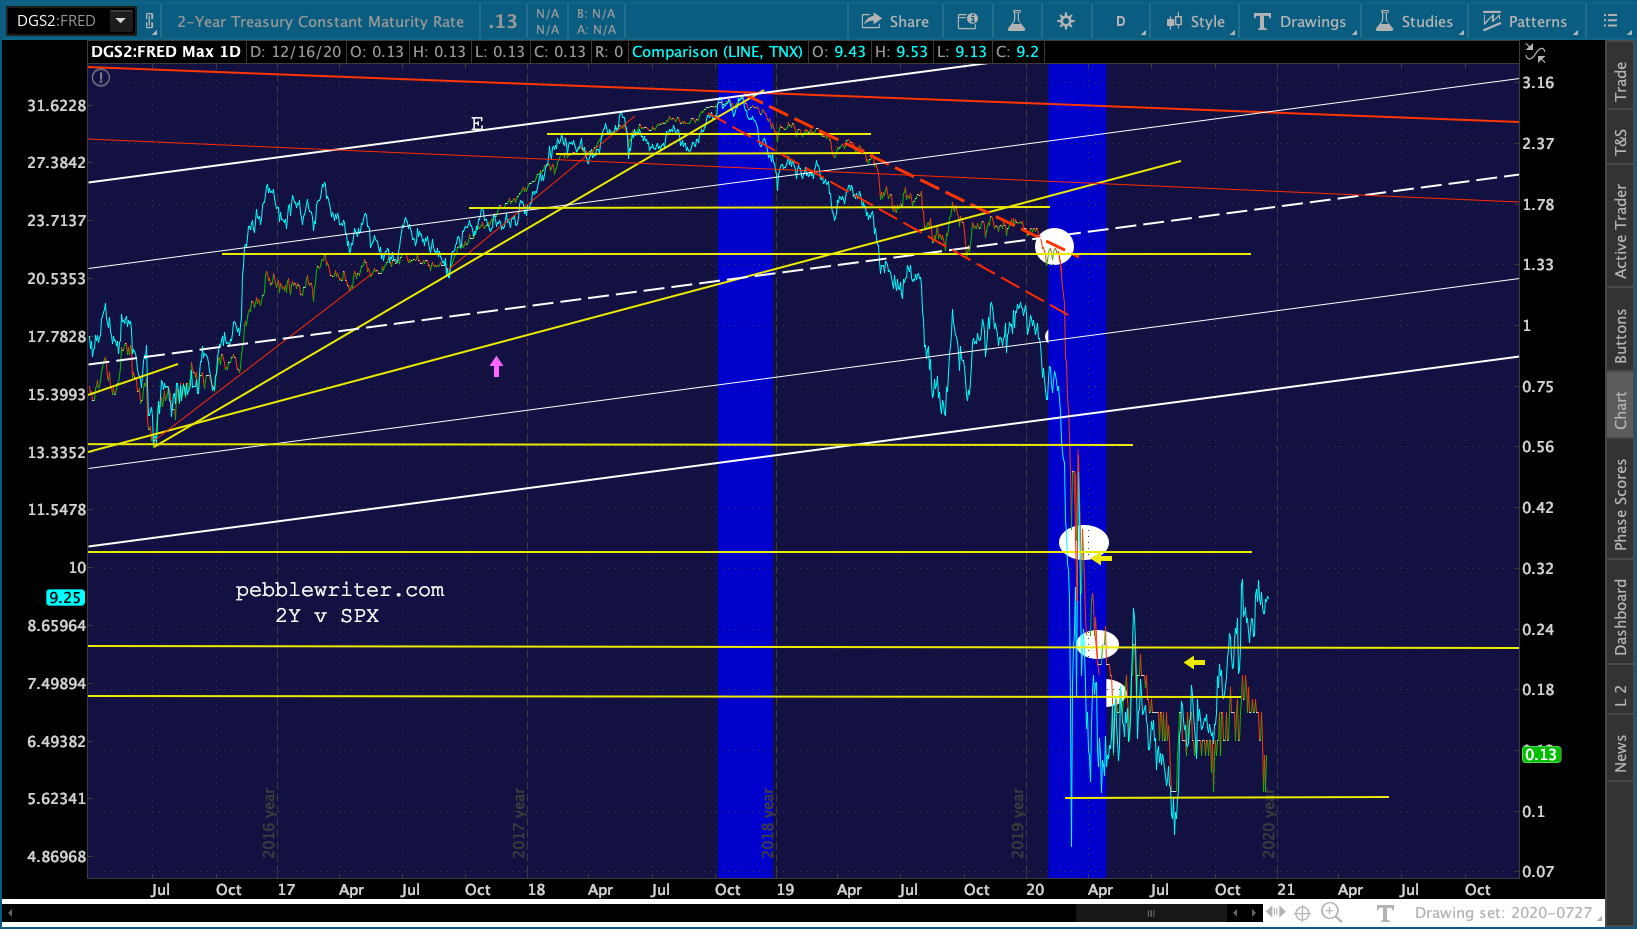
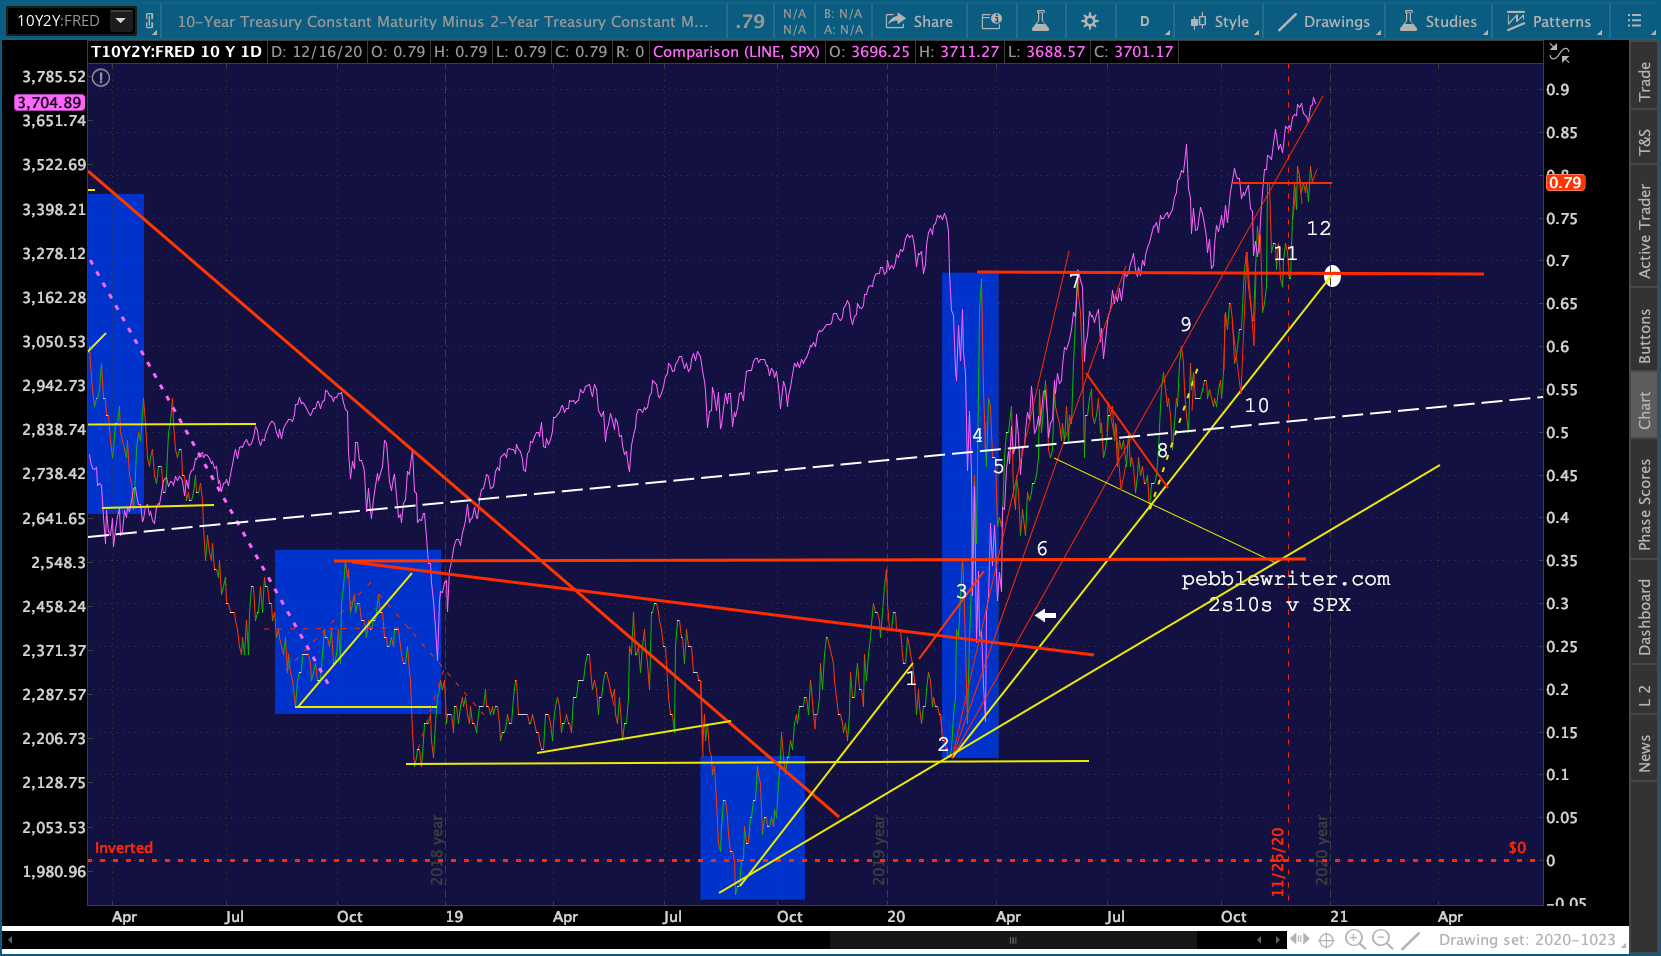 This is the result of a rise in the 10Y along with a drop in the 2Y. If, as the TNX chart indicates, the 10Y is about to break down, then we’ll see the 2s10s break down – unless the 2Y breaks below its former 11 bps lows, which would also be bearish for stocks.
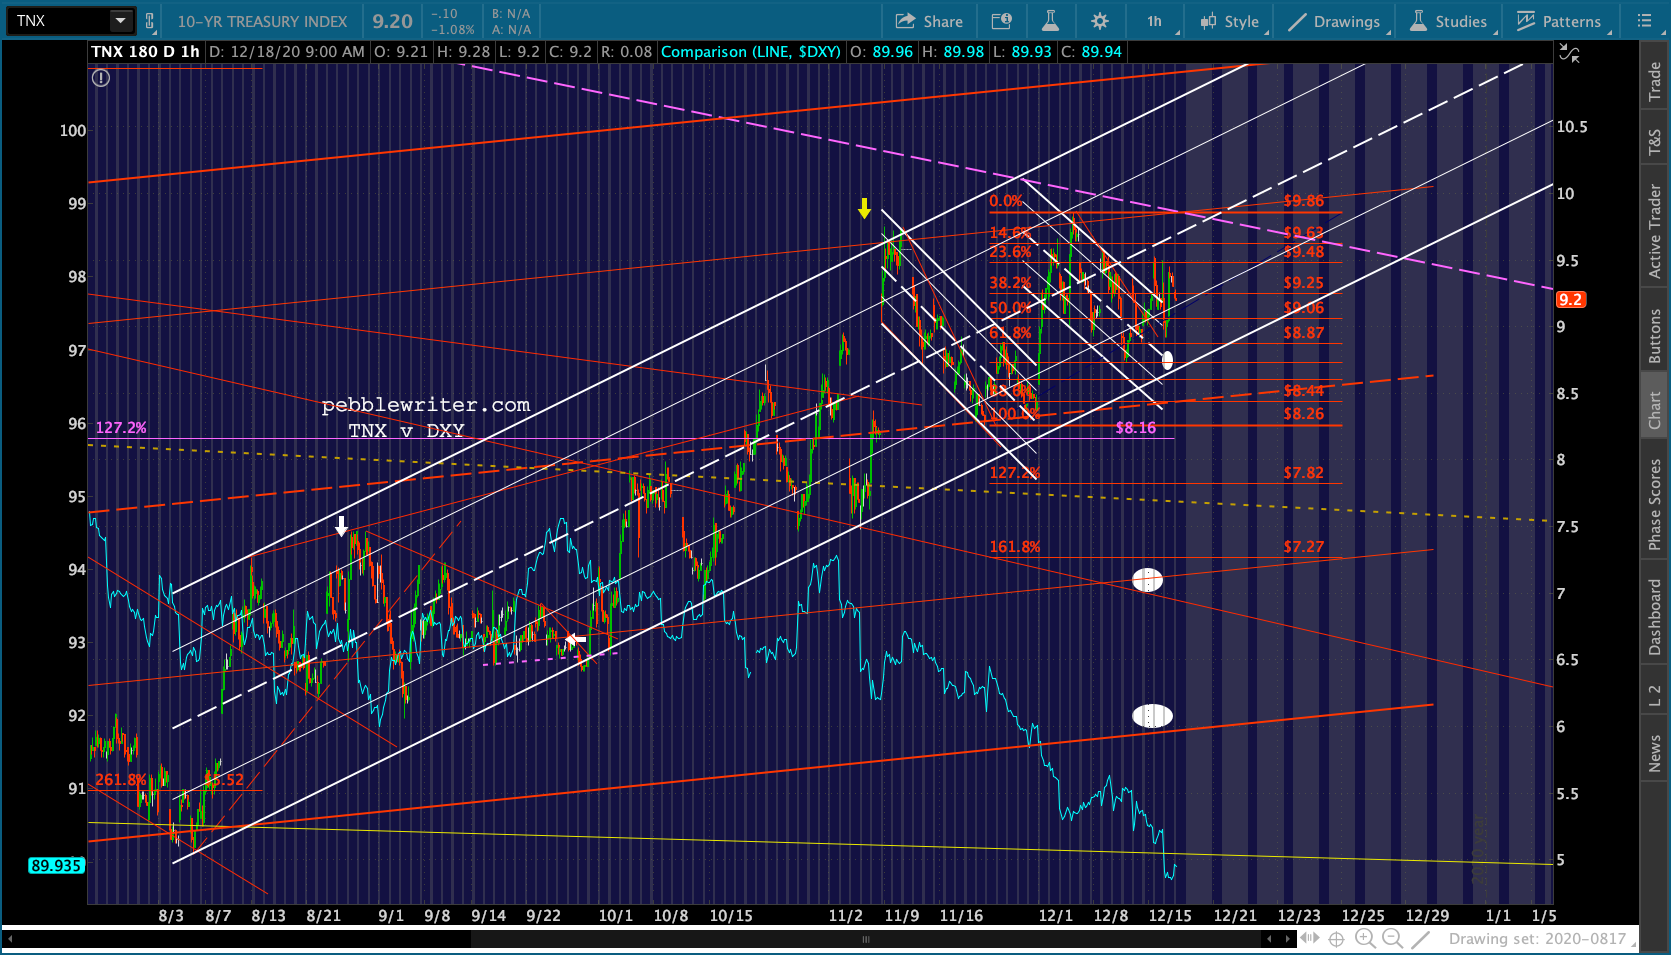
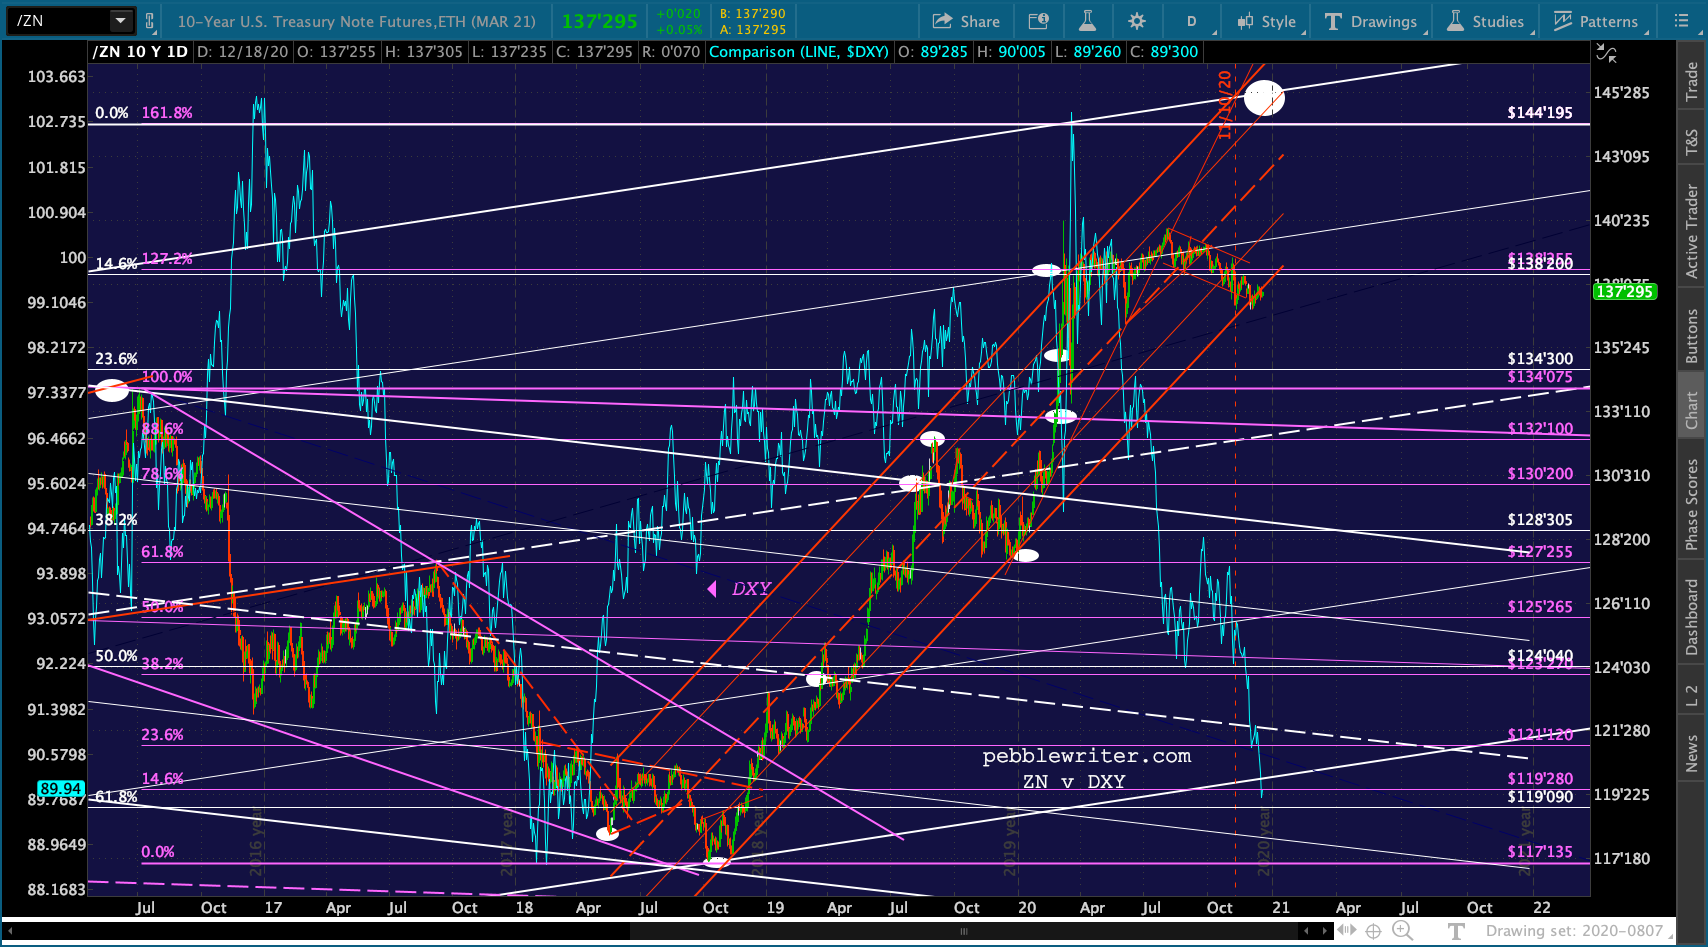
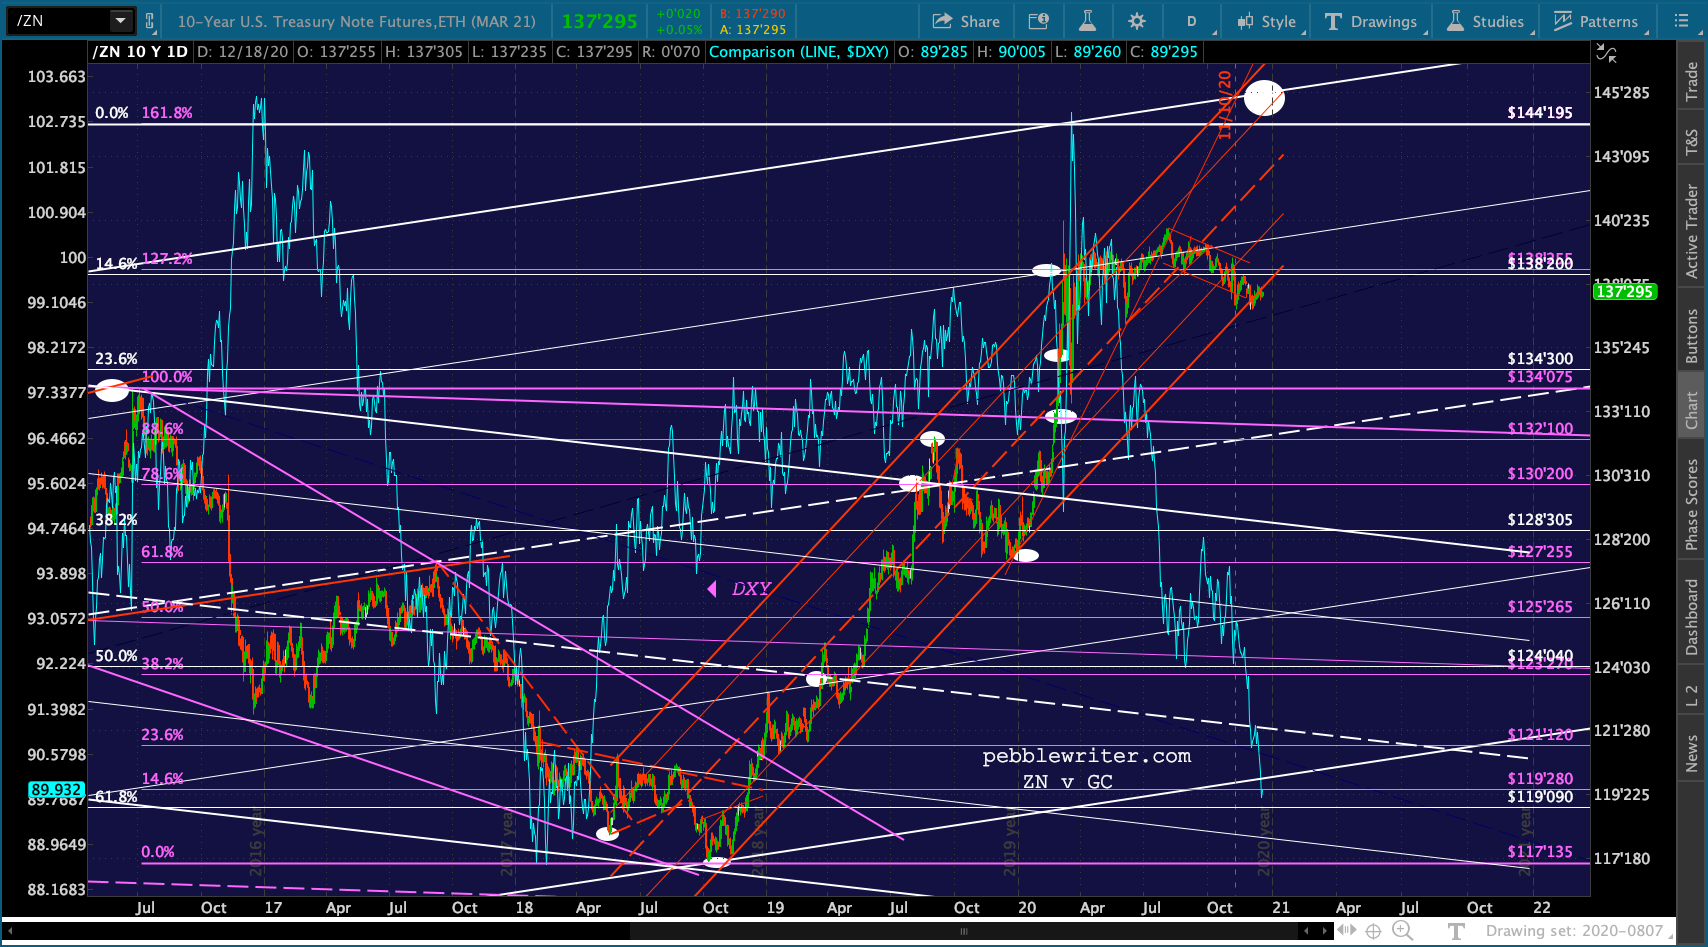 Throw in tax selling and a disappointing level of stimulus, and the deck is stacked against equities.
More later.
UPDATE: 3:50 PM
It’s a good start, but SPX’s inability to push beneath its SMA10 leaves a little to be desired for bears. Of course, not too surprising given the OPEX/Quad-Witching.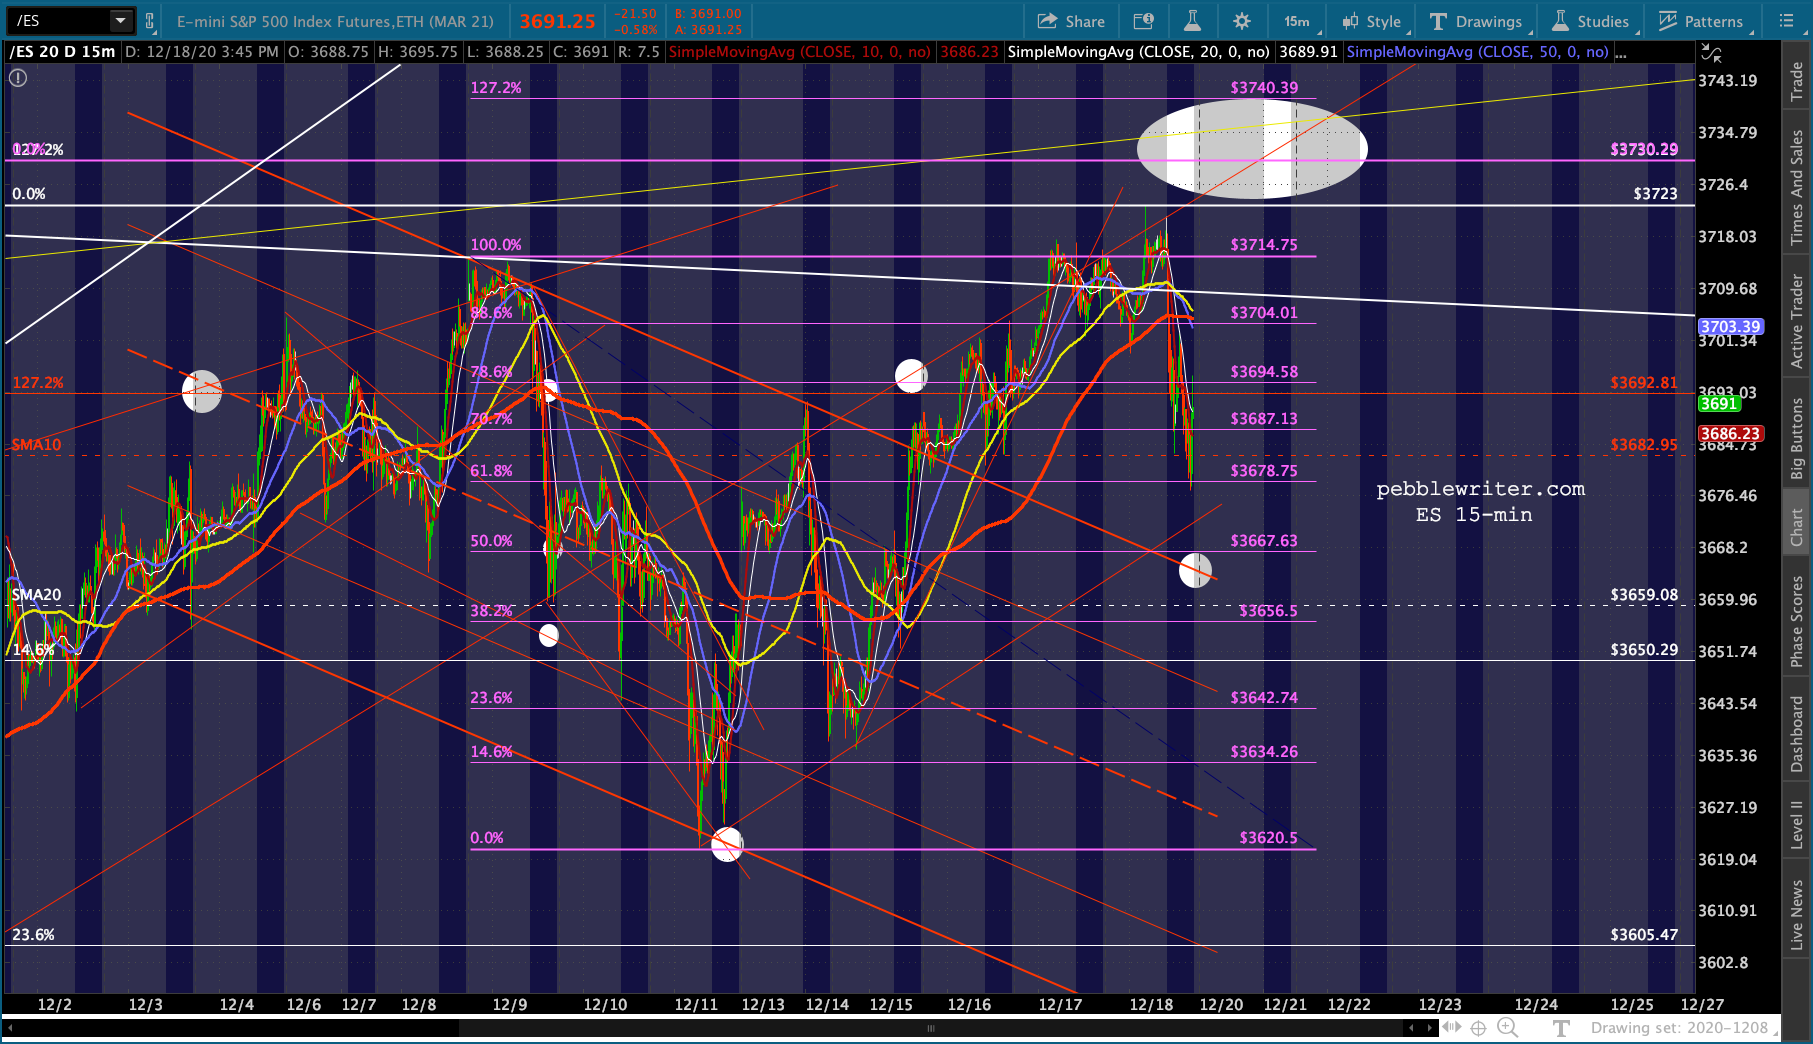
 DXY remains the critical ingredient.
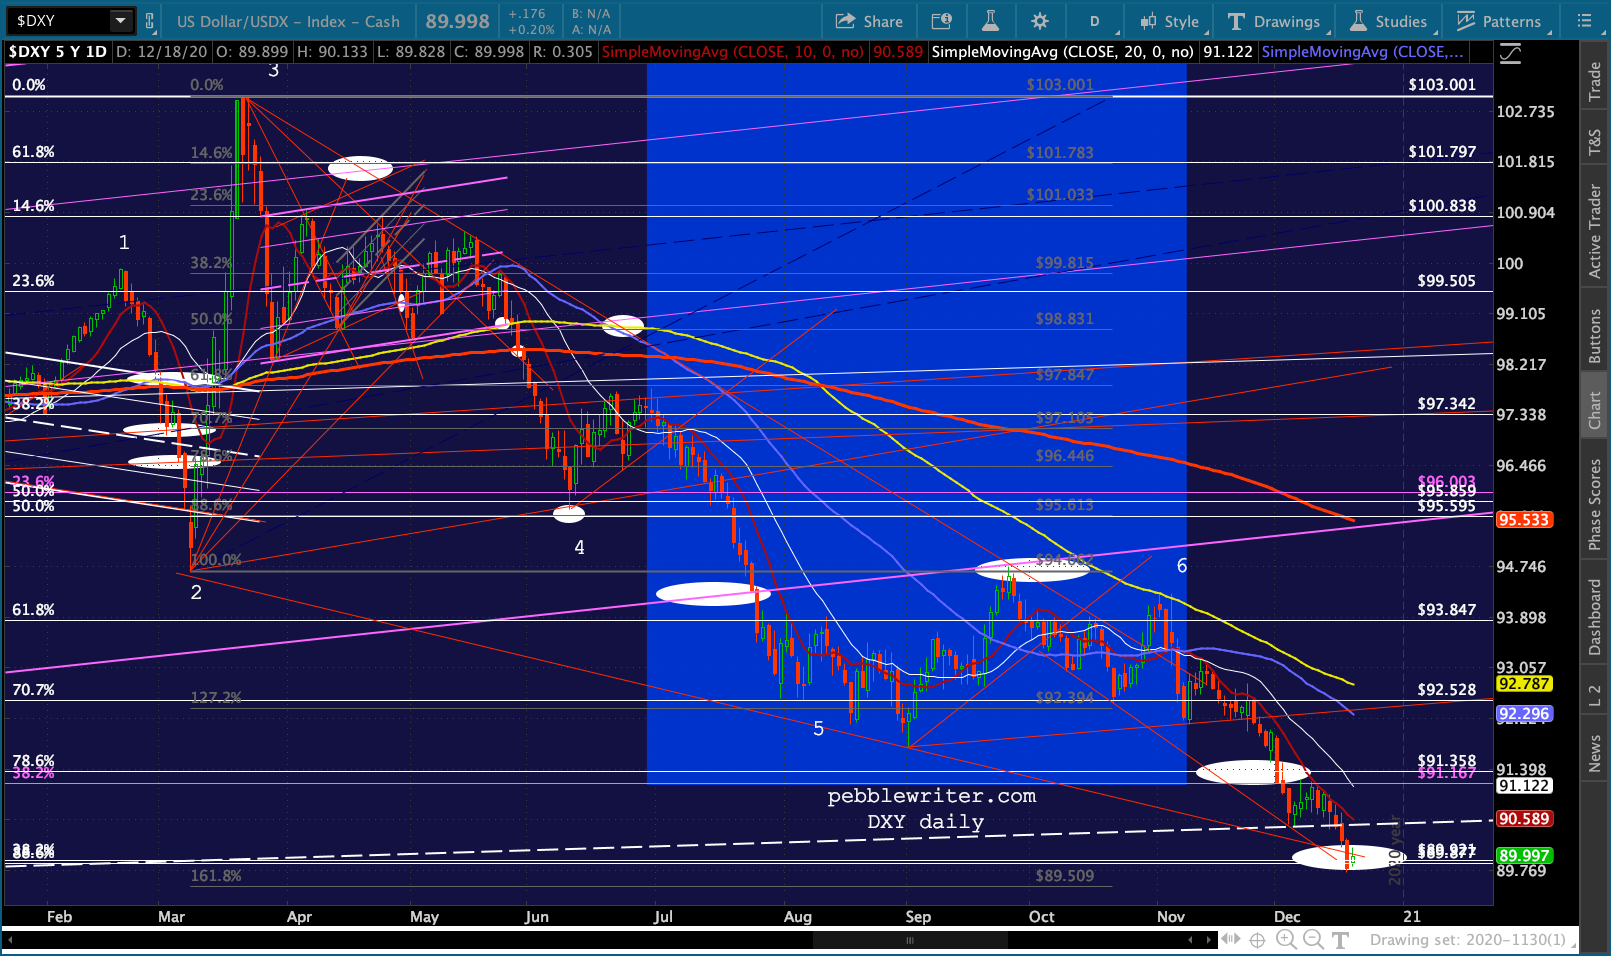 If it doesn’t hold 89.88, it’s a very long way down.