One of my favorite big-picture indicators is the spread between 10-year and 2-year yields. Members have seen this chart many times. It shows that previous sharp expansions of the spread — not the state of being inverted — signaled the coming equity crashes. Looking at the components separately, we can see exactly what happens when the spread widens. In the 2000-2003 and 2007-2009 crashes, the 2-YR drops sharply and the 10-YR follows. In the 2011 and 2015-2016 corrections, the 10-YR saw most of the action — primarily because the 2-YR didn’t have much room to fall.
 Both have now broken above long term trend lines — the implication being that yields have broken out and have much further to go. I believe this is an erroneous conclusion.
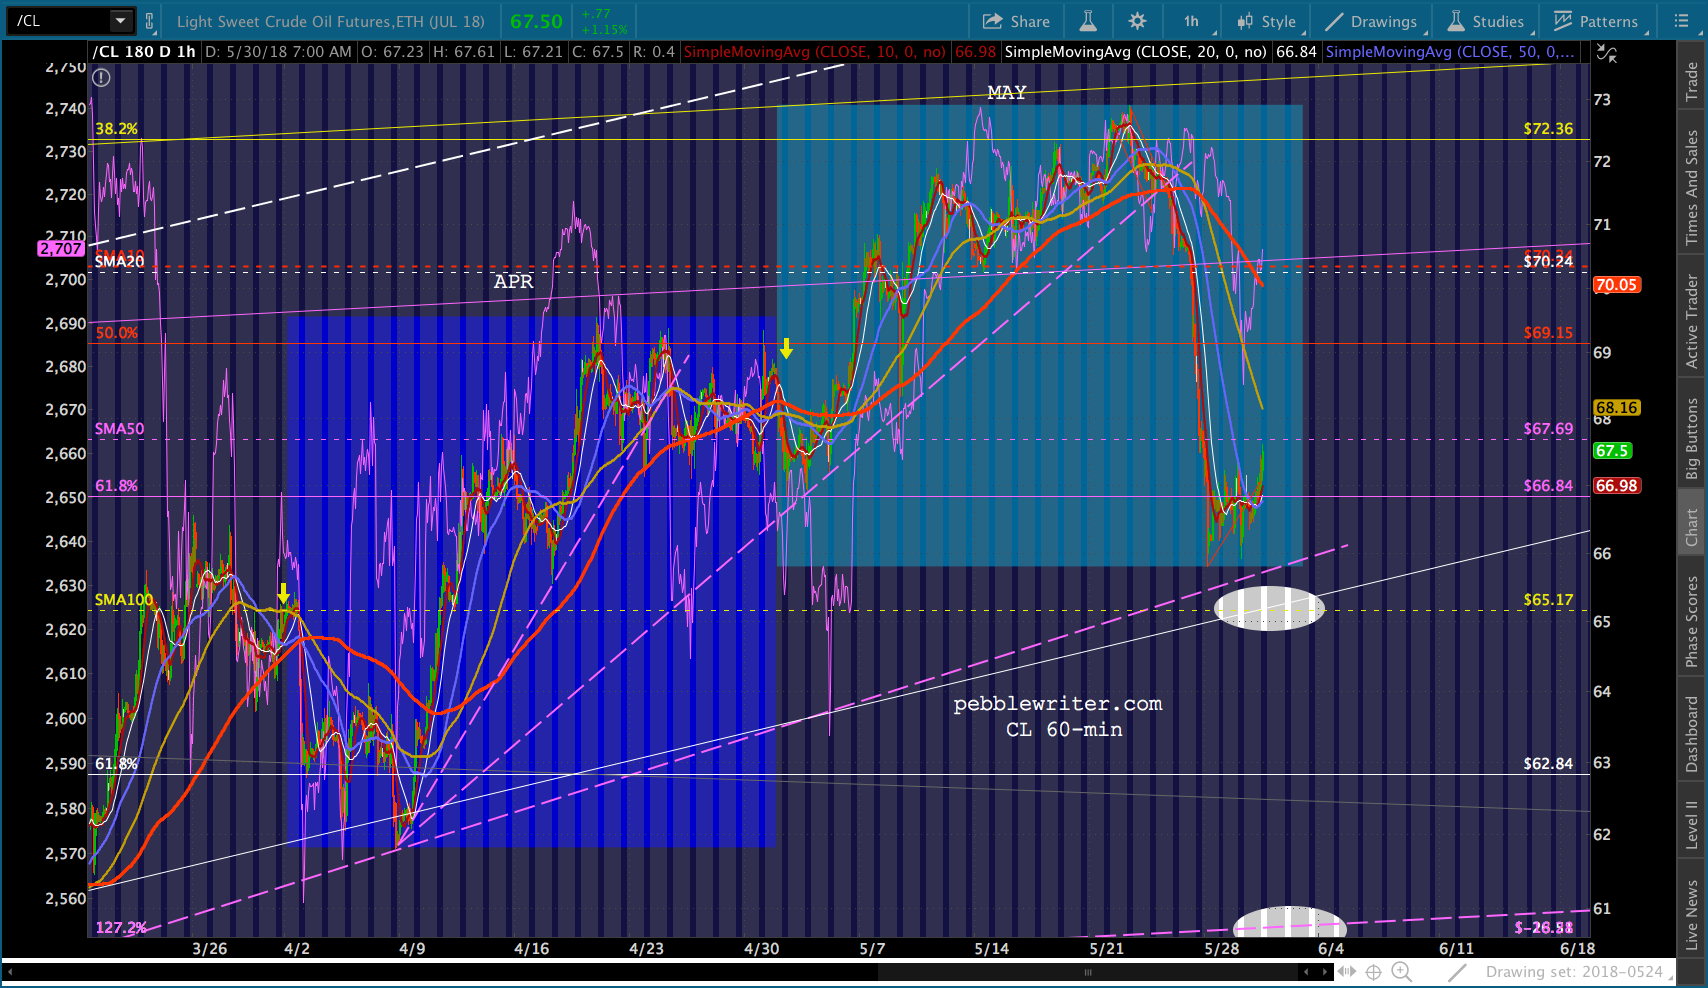
First, note prices (ZN) have had a nice bounce off a long-term channel bottom. We wrote about this in April [Bonds: A Buying Opportunity] and have since seen ZN pop back above both medium-term (purple) and longer-term (red) trend lines. Yesterday, it tagged our second upside target. The subsequent reversal has been impressive. And, to be sure, oil and gas have reversed nicely off recent highs — mitigating some of the inflation pressure that sent rates soaring.
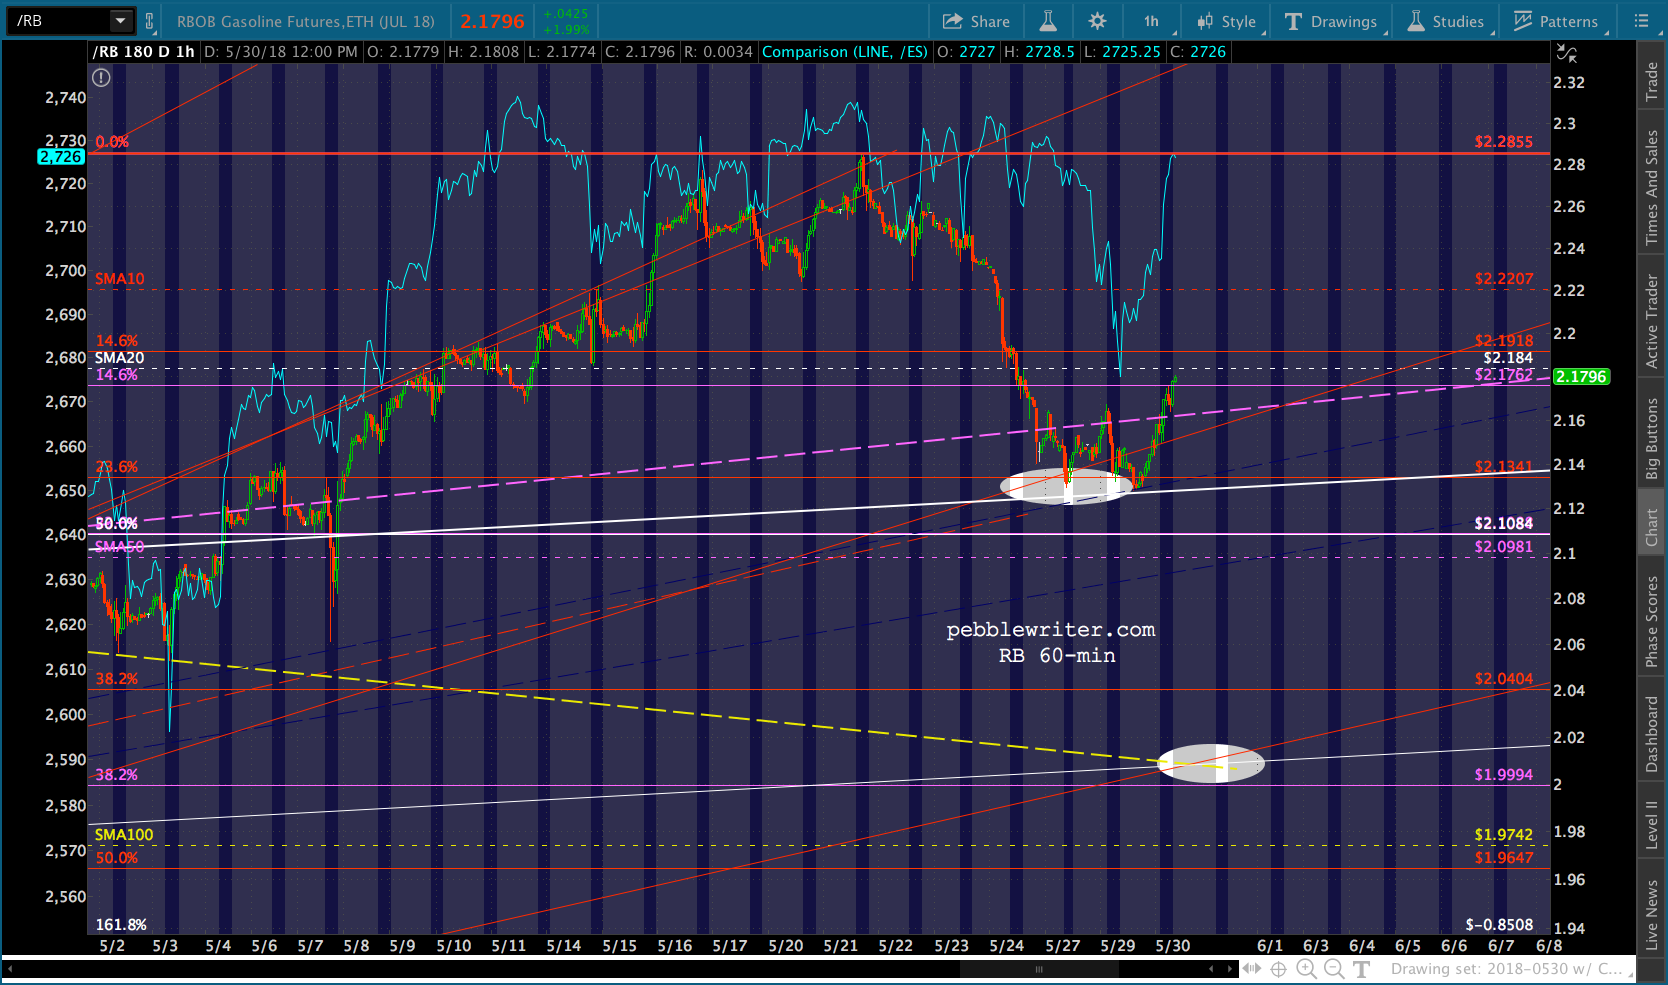
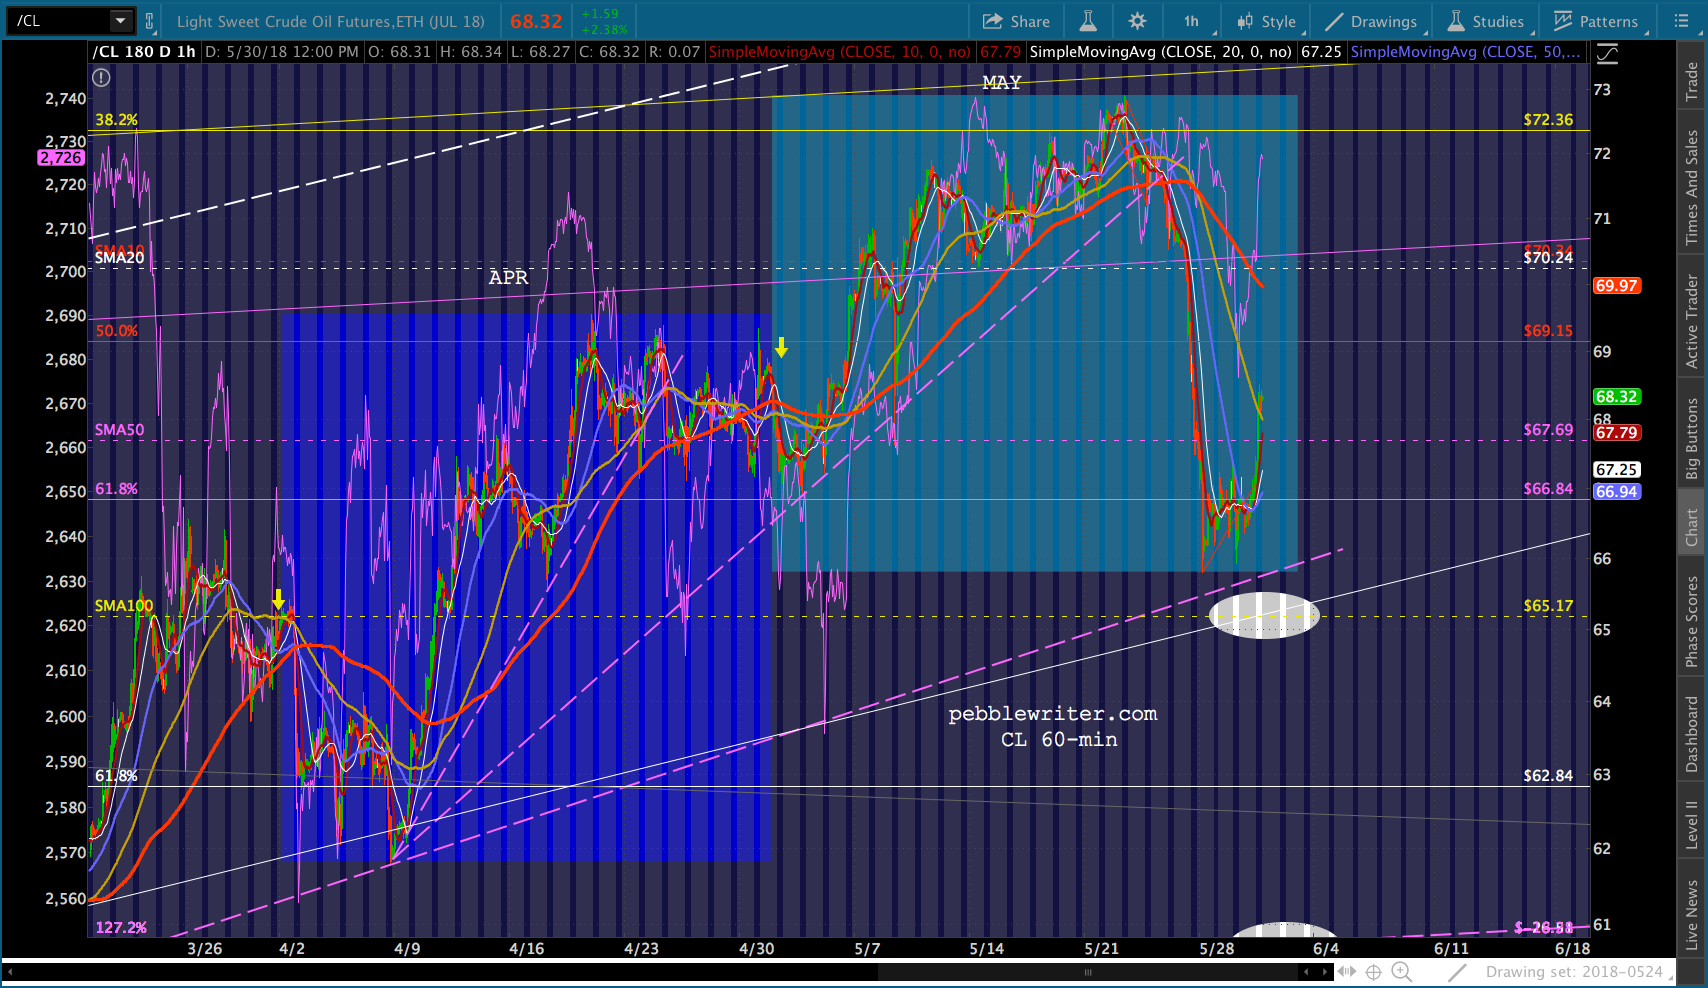
RB reached our initial downside target from May 21 [see: Once More With Feeling] yesterday, but both it and CL have a little further to go.
 Unless the BLS butchers the energy component of May’s CPI, we’re certainly not out of the inflation woods just yet.
Bears would do well to keep an eye on USDJPY, which tagged our 1108.23 target yesterday. The BoJ-IMES conference is underway. USDJPY breakouts, together with VIX smackdowns, have ruined many a correction.
continued for members…
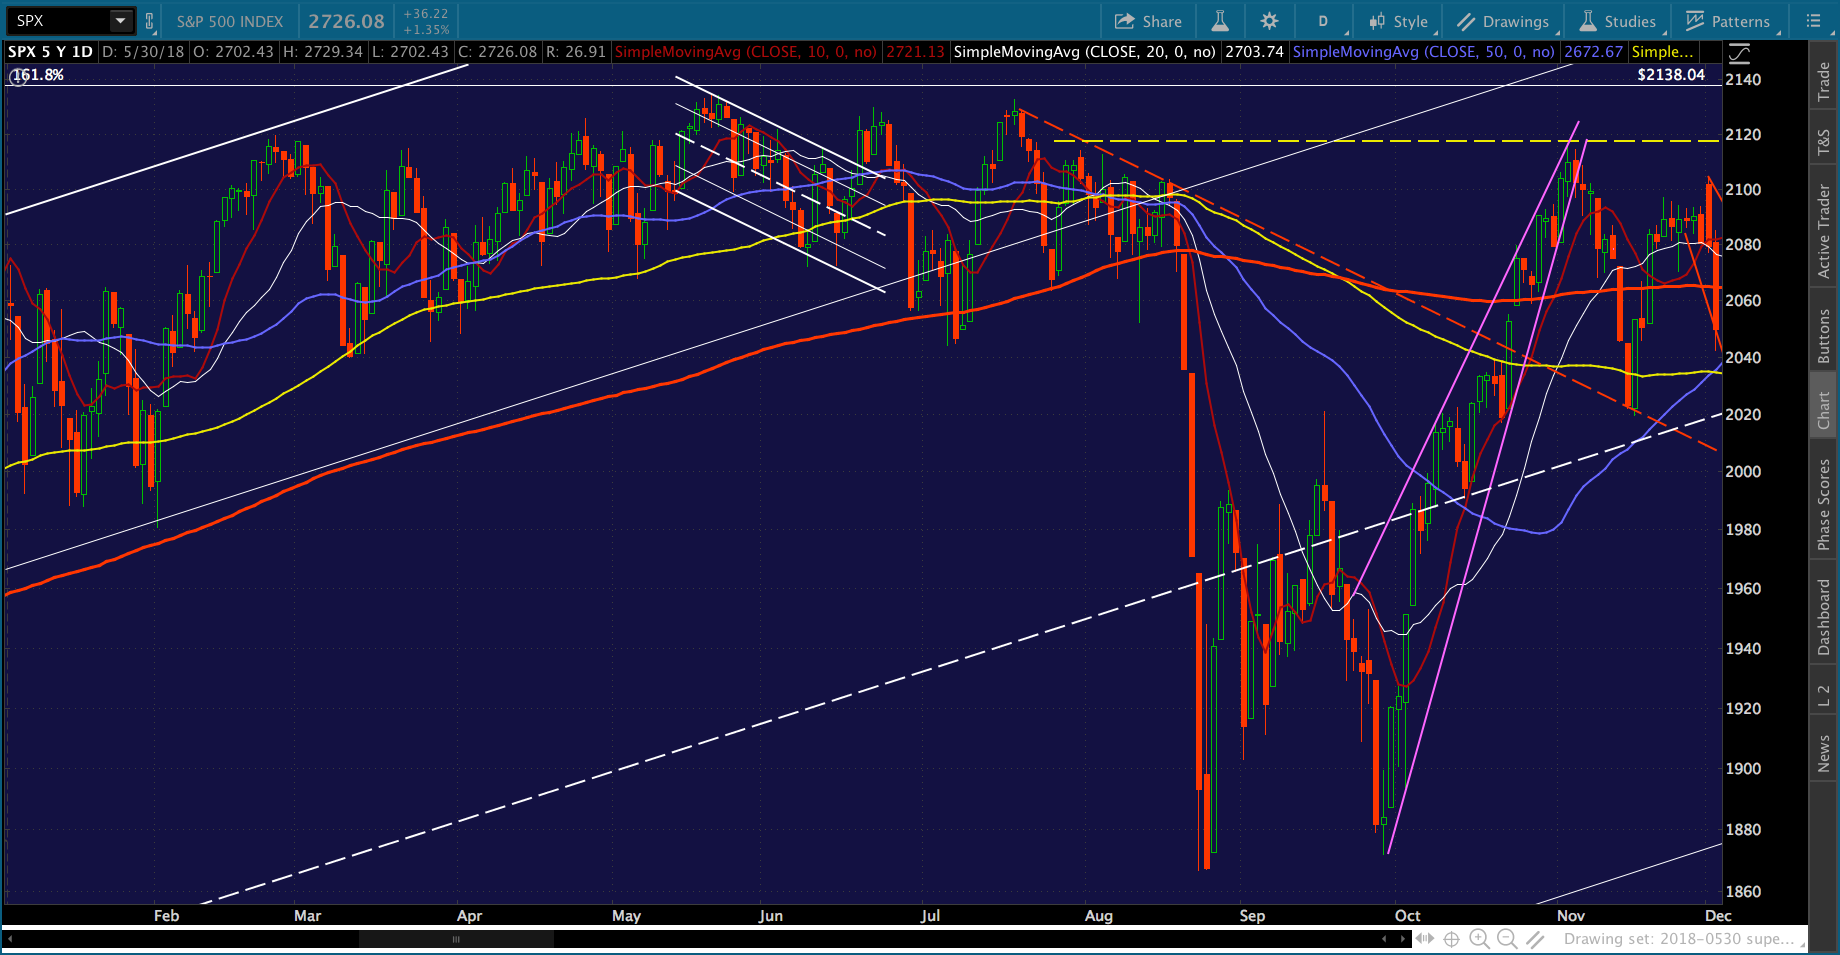
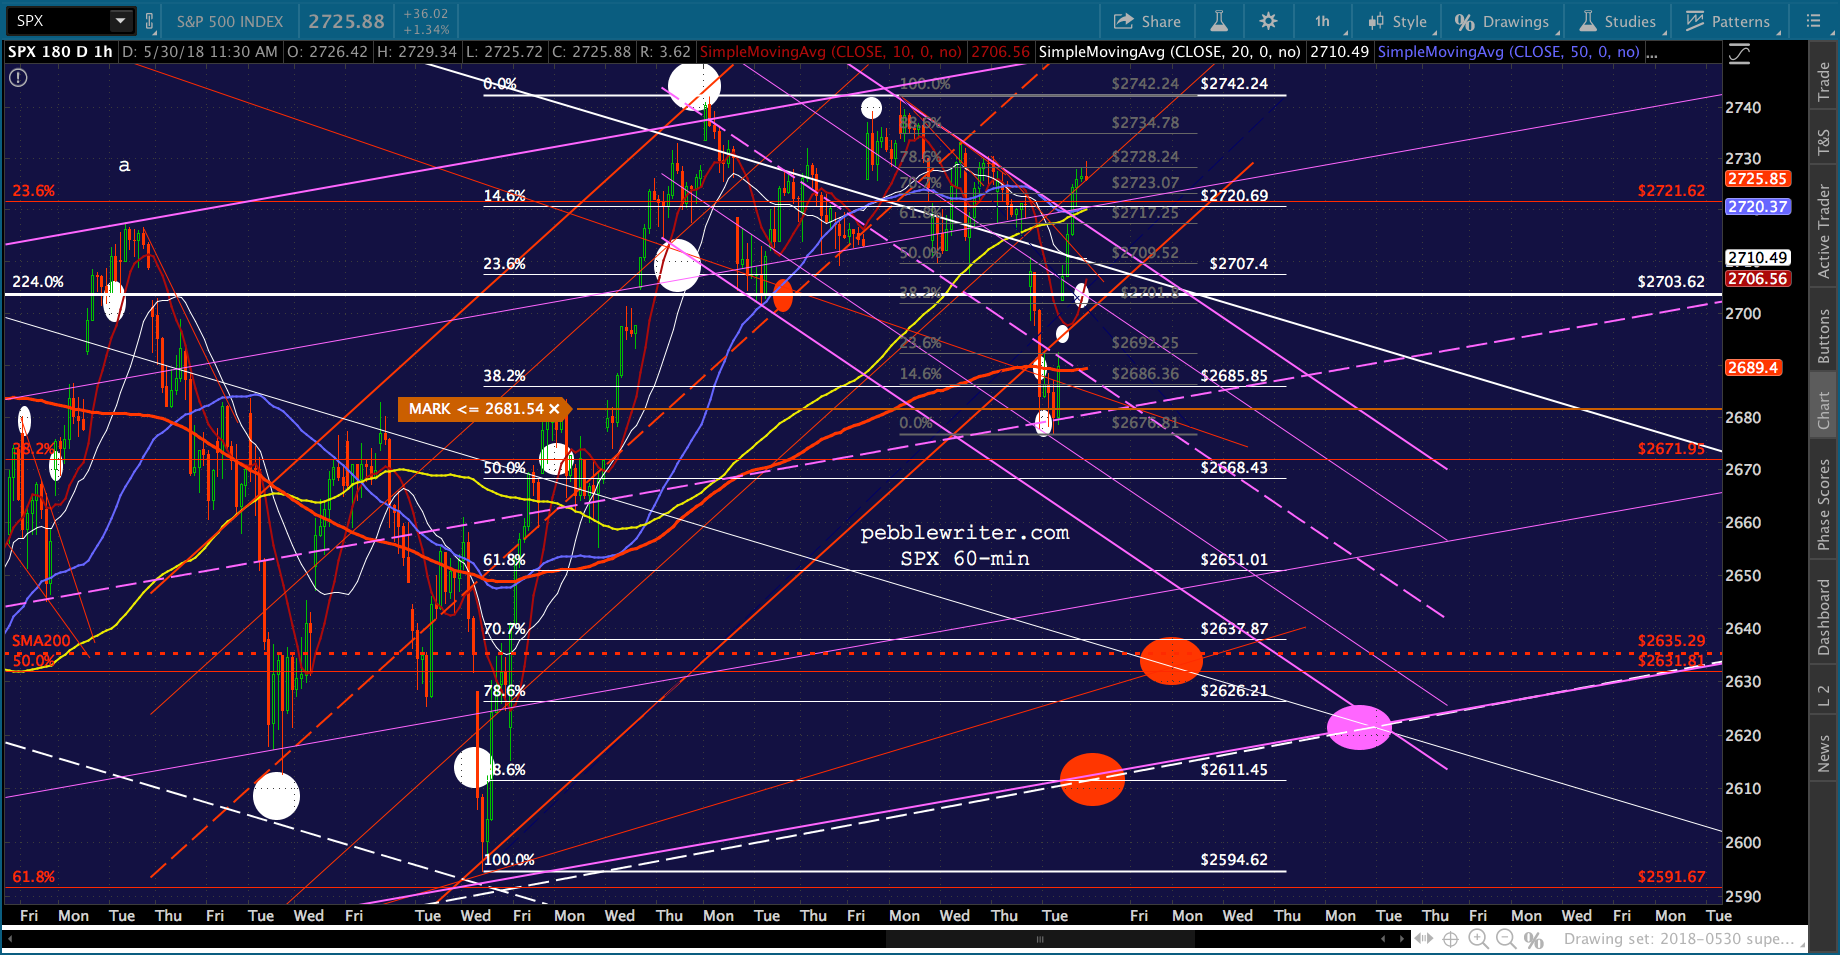
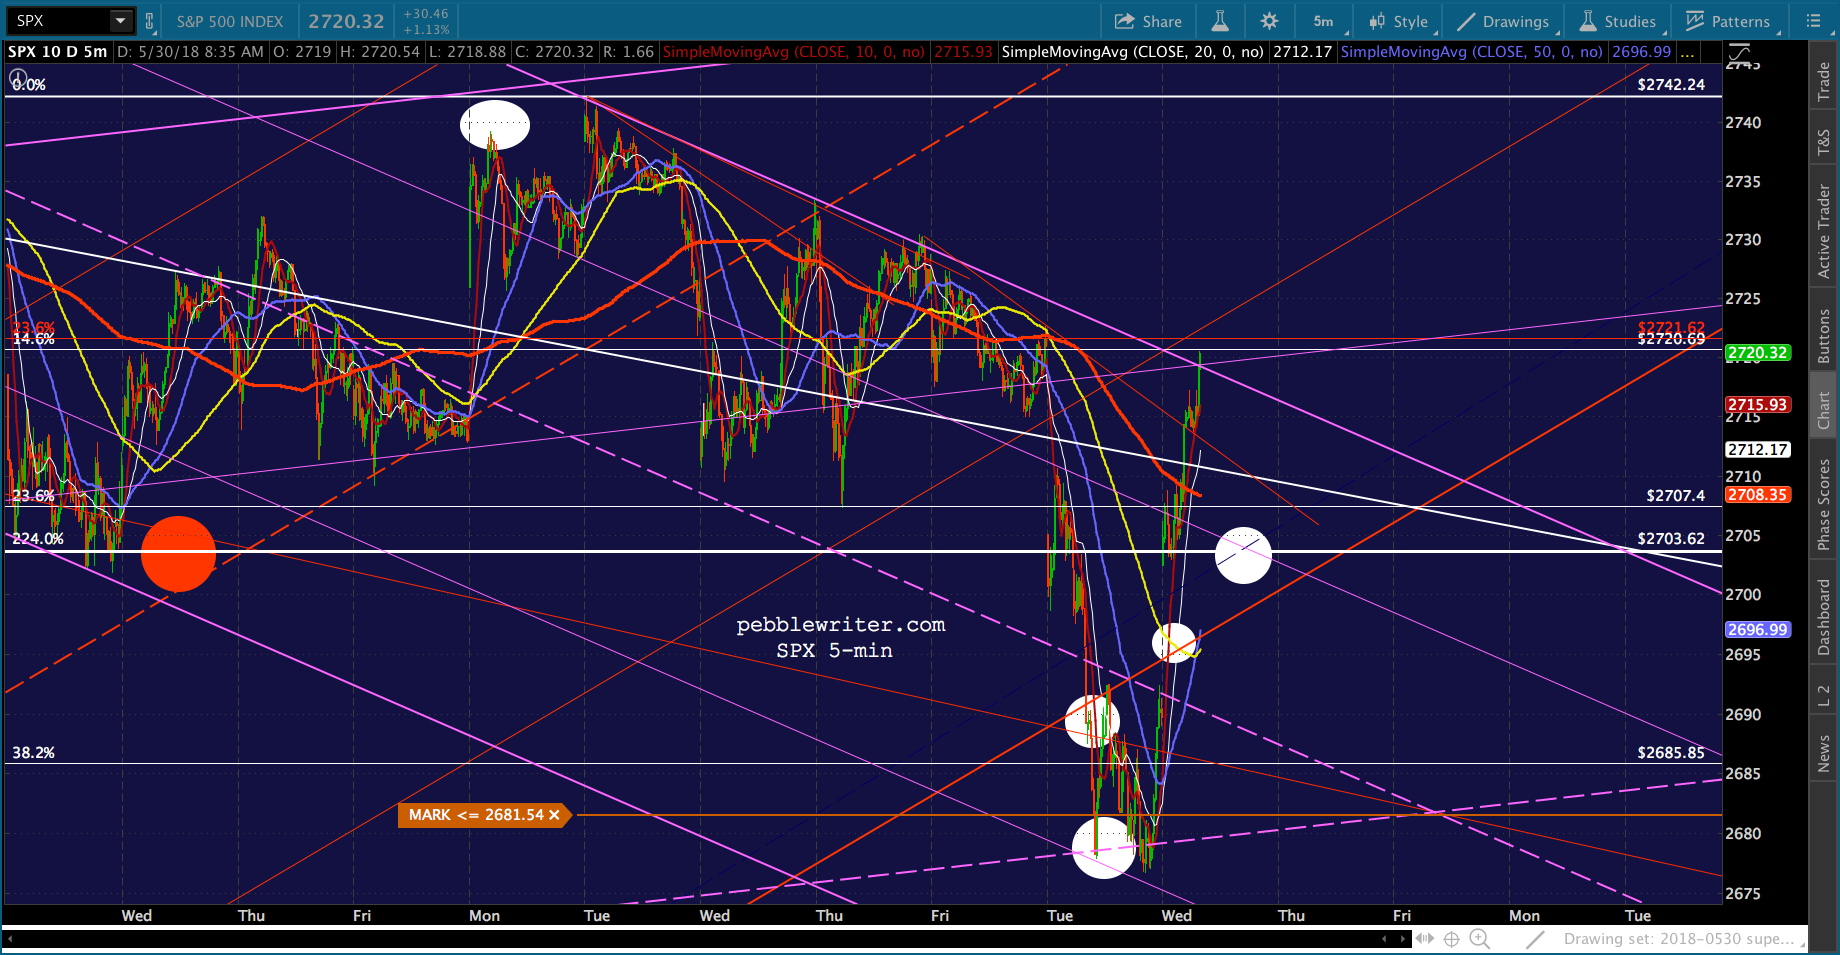
The key for bears today will be staying below 2703.62 — a bit of a broken record, I know.
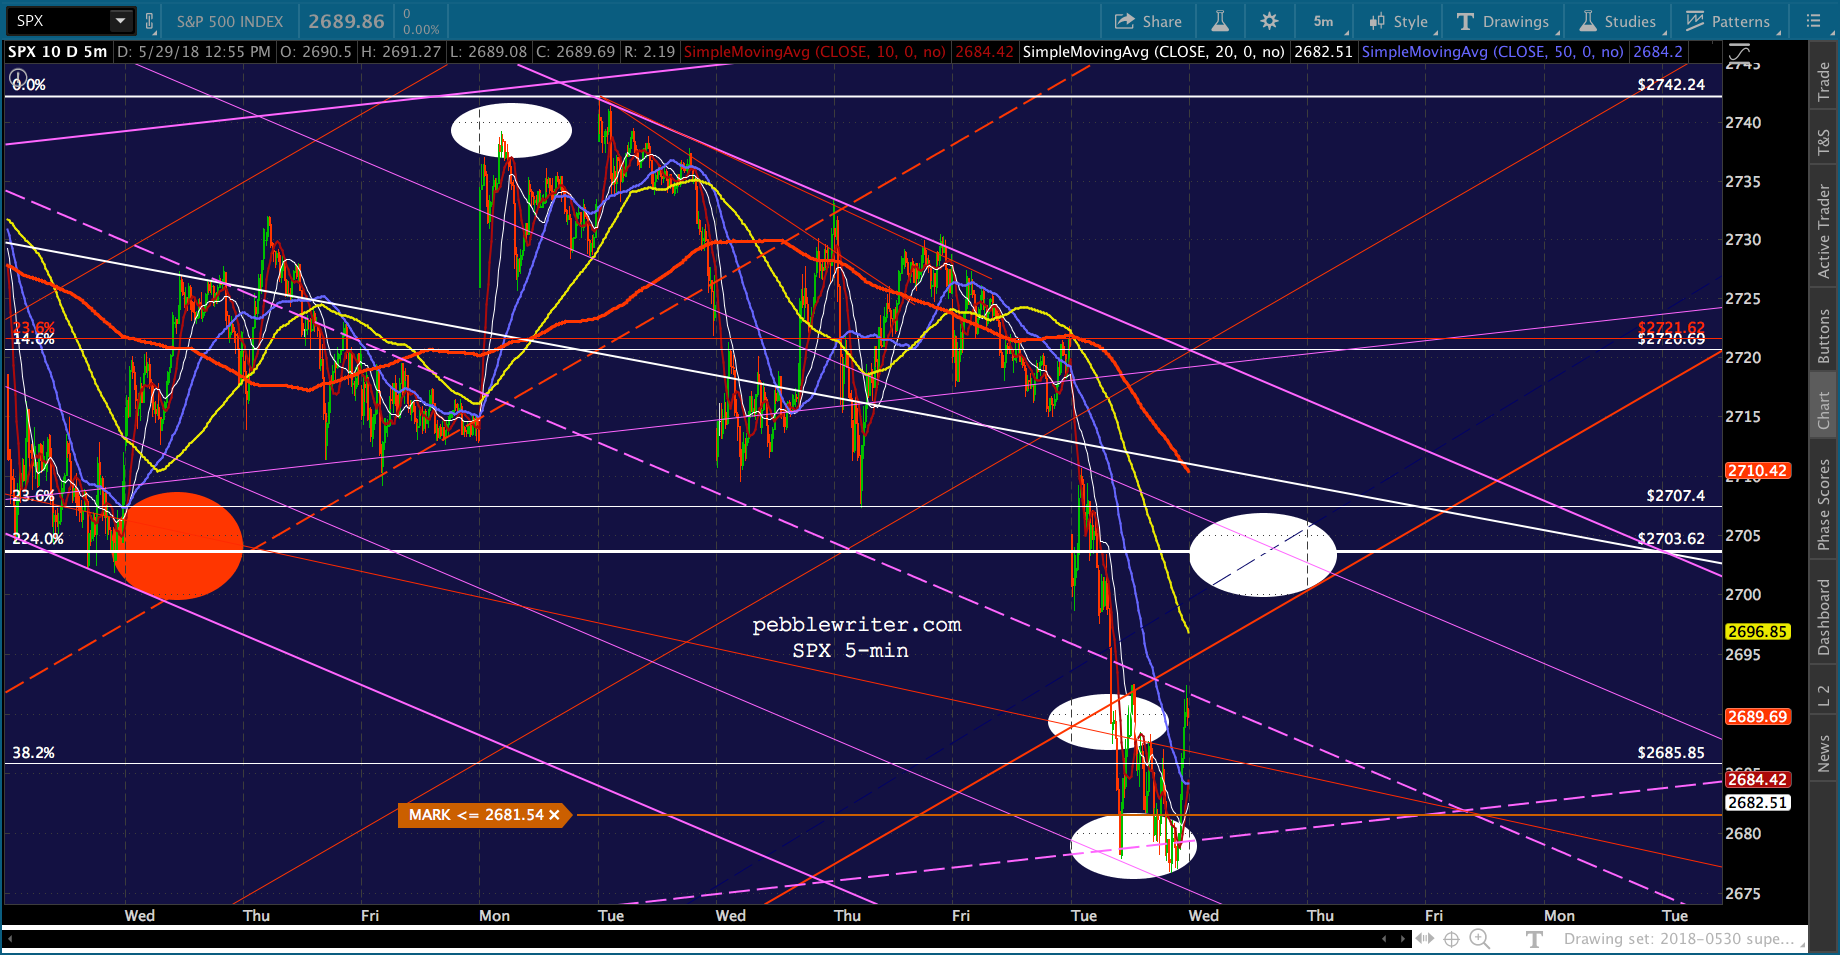

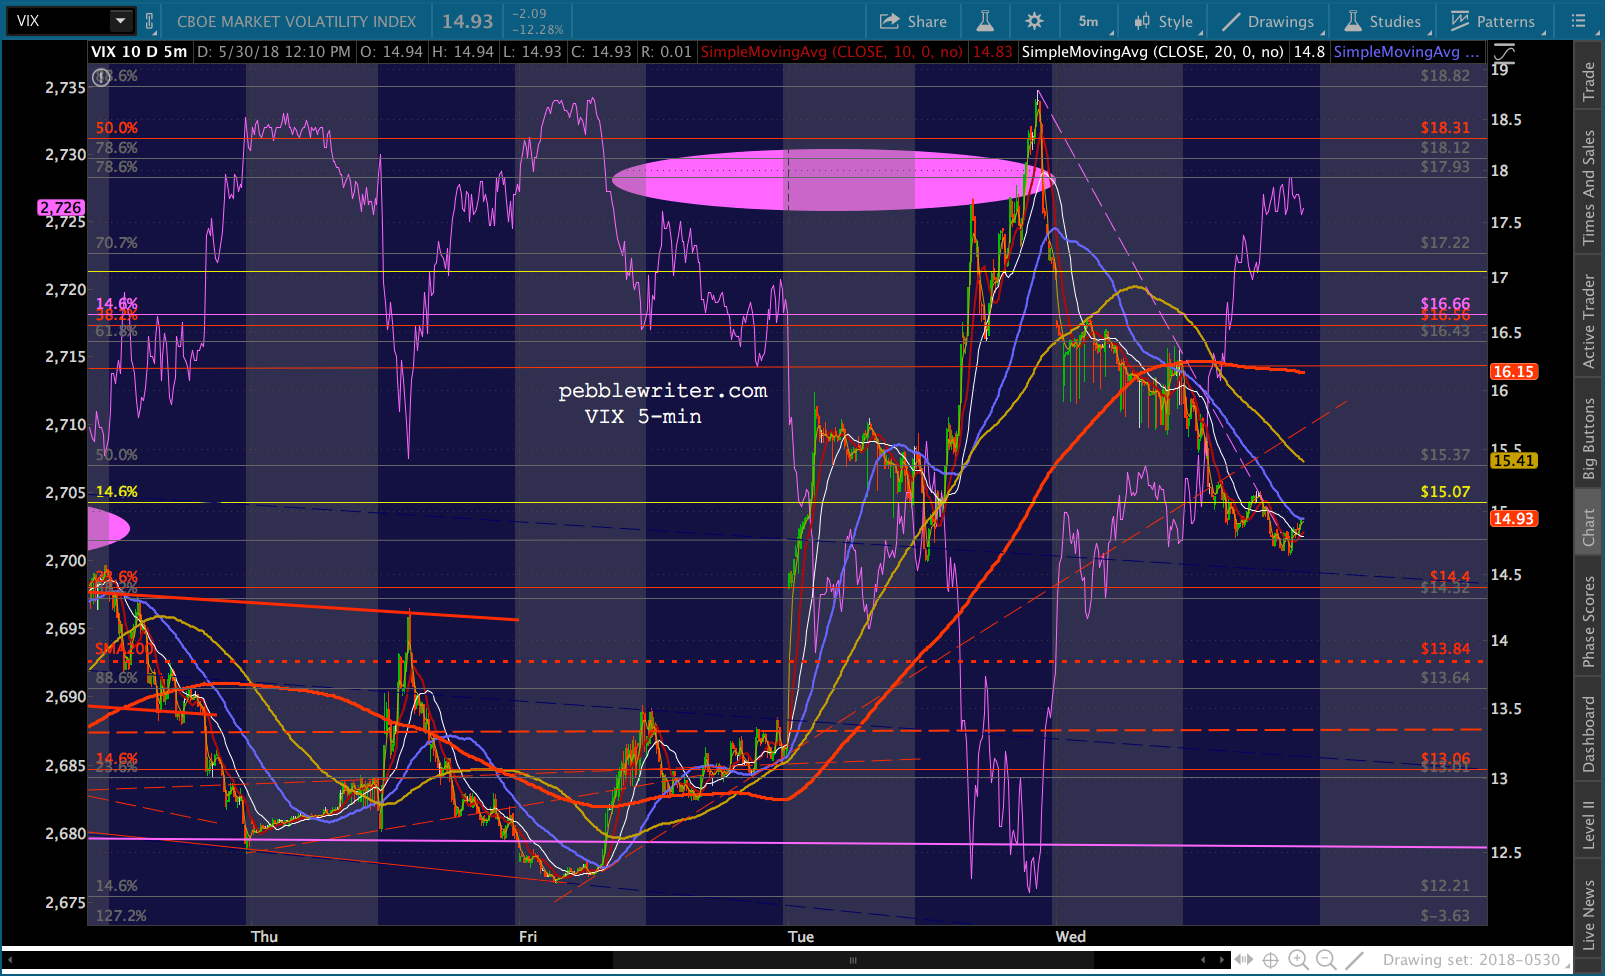
 VIX has dipped a little, but not enough that the bears should be concerned — just yet.
 DJI still looks destined to tag its SMA200, currently at 24005.
 Ditto for ES.
  UPDATE: 10:37 AM
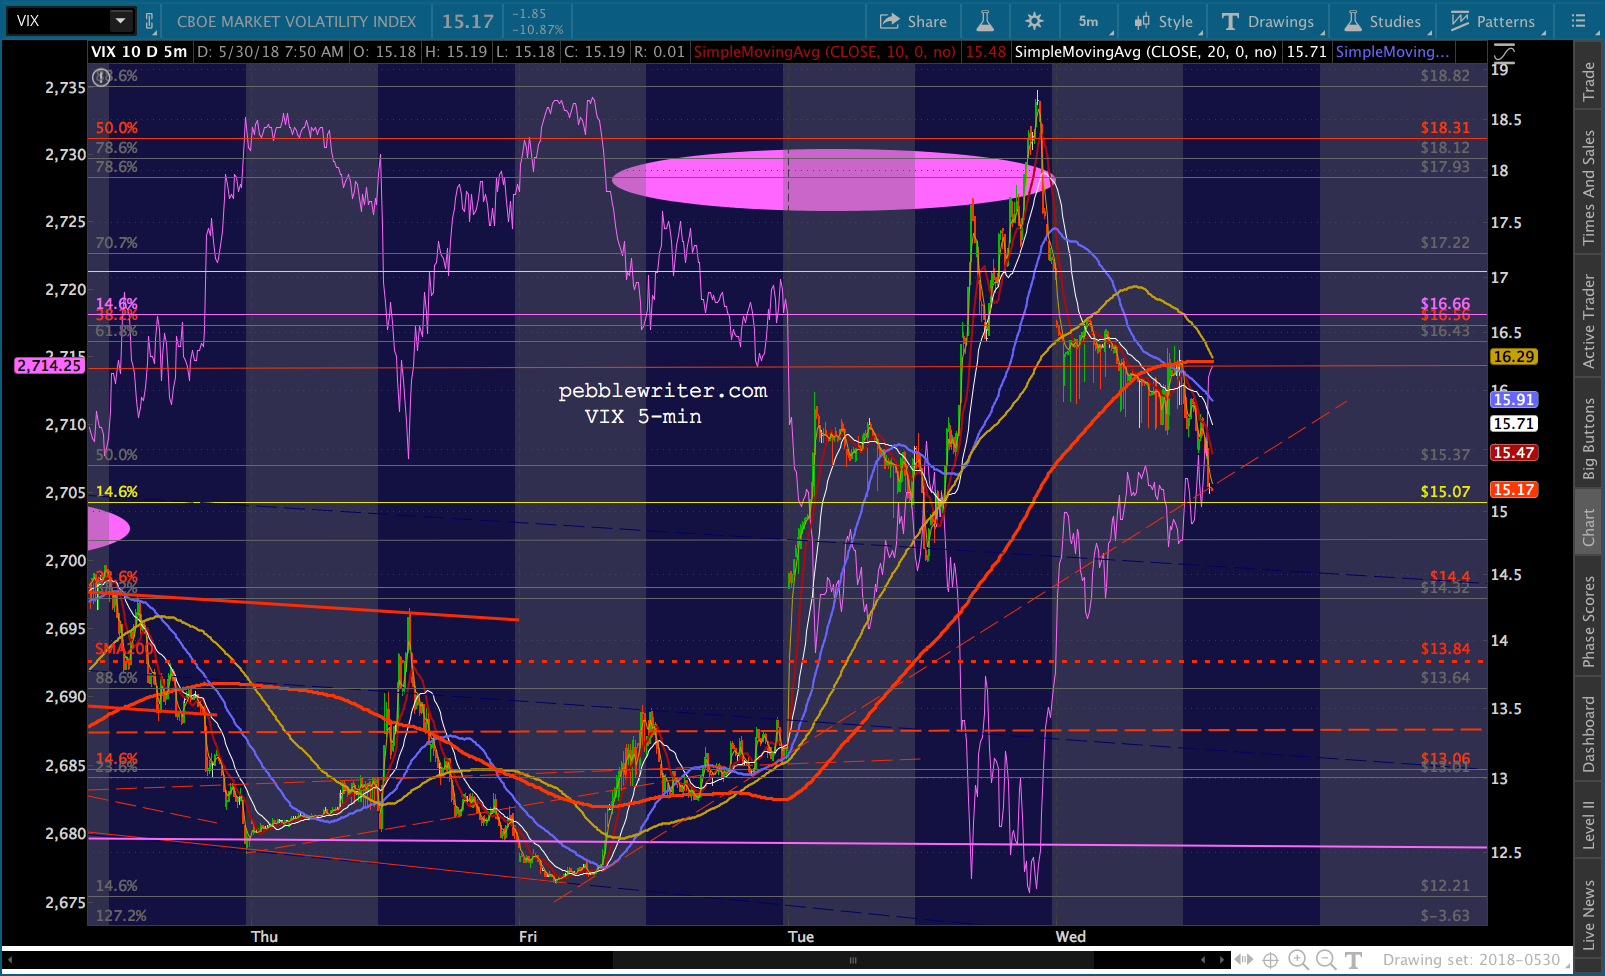
VIX has reached TL support as SPX has pushed past its SMA5 200 and tested TL resistance. This would be the ideal place for a reversal if it’s going lower. If VIX drops through the TL (15.12ish) then we have to be open to the possibility of SPX breaking out of the falling purple channel (2720ish.) Note that DJI is testing its SMA20 and is coming up on its own SMA5 200 and red TL.
The question is “intent.” If TPTB intend to backtest the SMA200 or lower, then they should hold the line on VIX. If this is just another V-shaped recovery, then there’s no reason VIX can’t keep heading lower.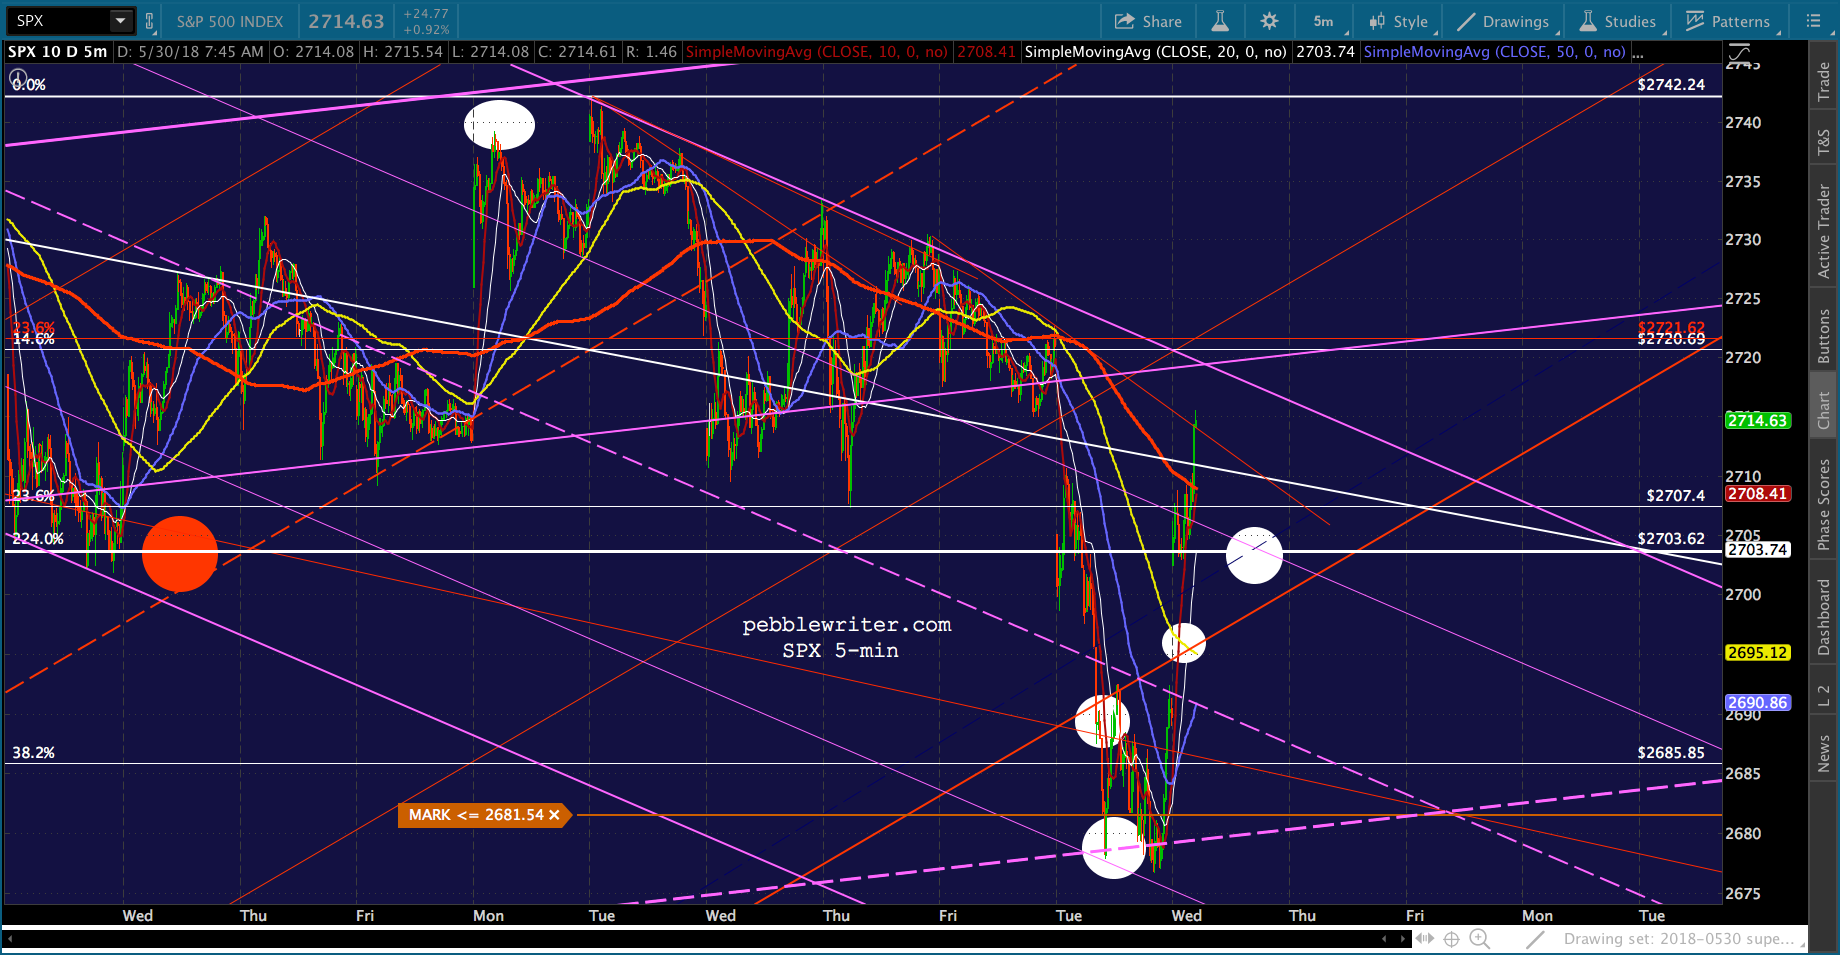


 UPDATE: 11:40 AM
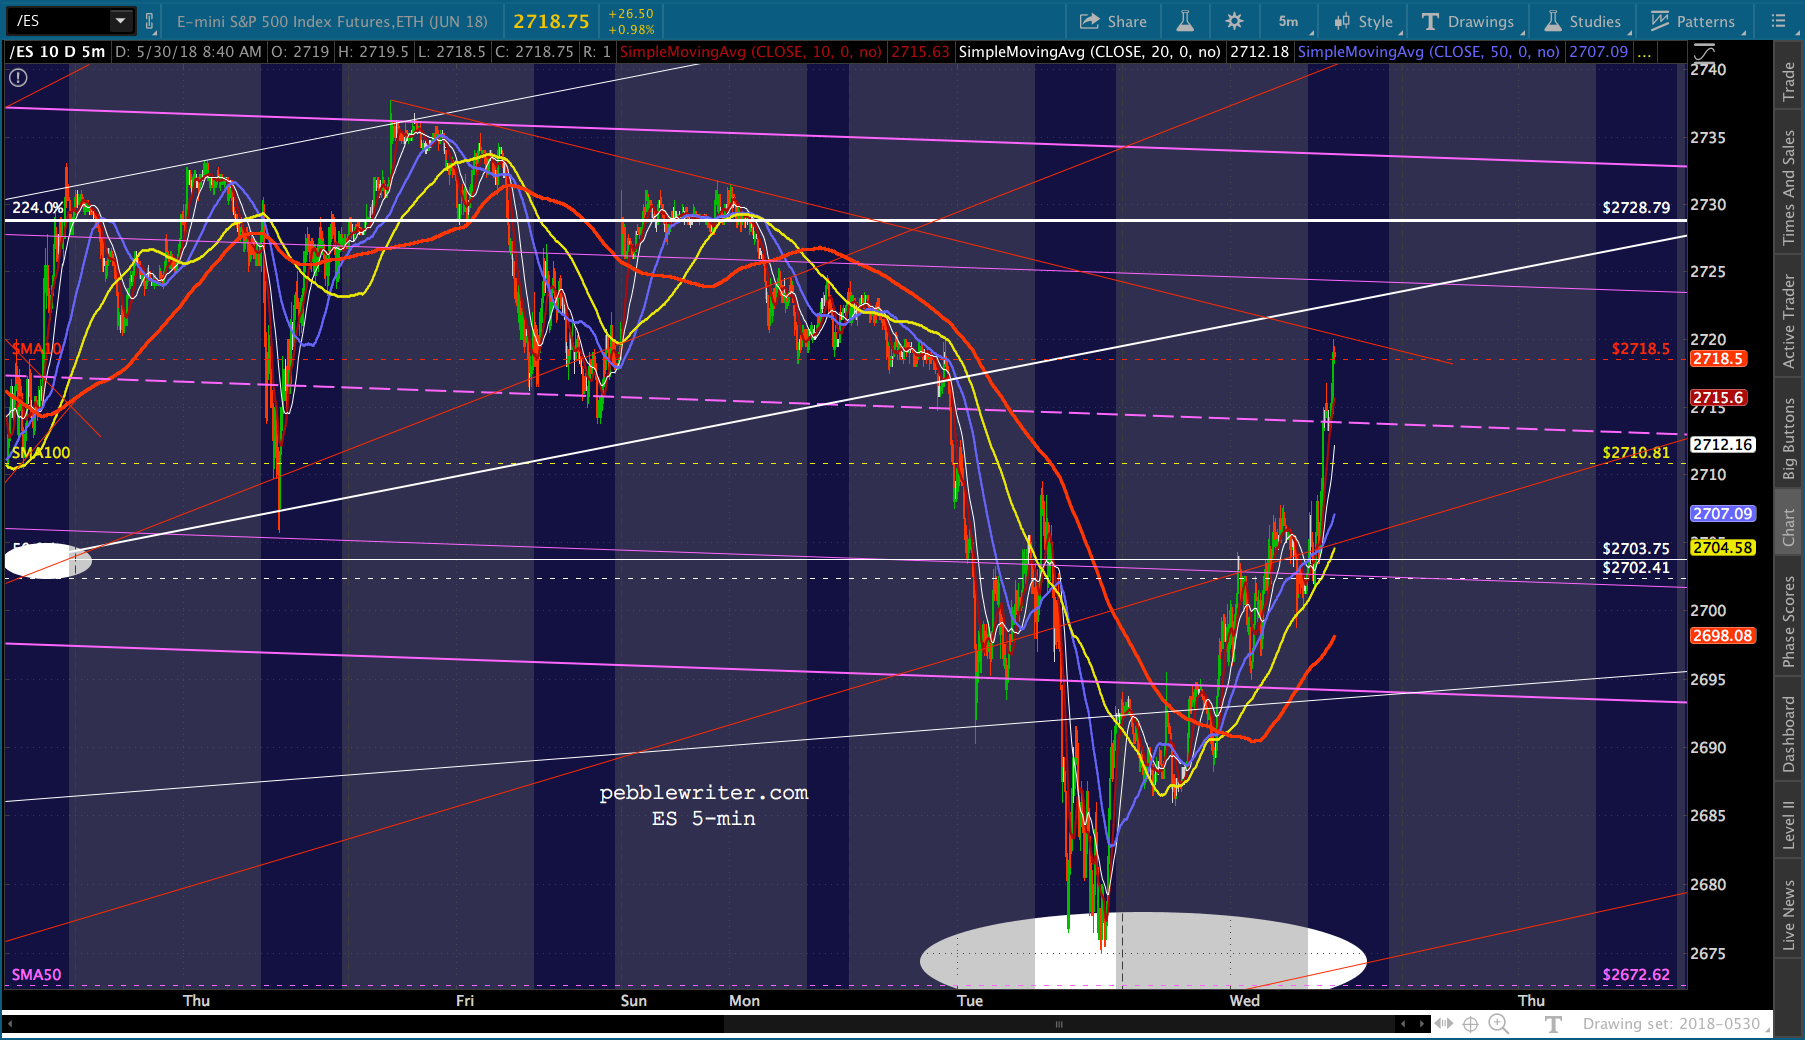
Here’s today’s line in the sand. SPX, ES and DJIA all at resistance — and, all thanks to VIX and USDJPY.


 UPDATE: 3:10 PM
Volume has dropped to a trickle, as the breakout hasn’t attracted any more bulls nor convinced any more bears. For those who played along past the logical turning point or the line in the sand, we’re coming up on overnight hold decision time.
The current gaggle of charts looks bullish enough. But, I don’t trust this breakout. I’d reshort at these levels. For one thing, it very much reminds me of May 2015, when a breakout in USDJPY and breakdown in CL left stocks looking like they’d broken out. As we found out shortly thereafter, there was considerable downside ahead.
From the May 28, 2015 post: SPX had retraced about 78% of the previous day’s losses… …with USDJPY’s breakout leading the way.
 CL had fallen 7.4% from its recent highs.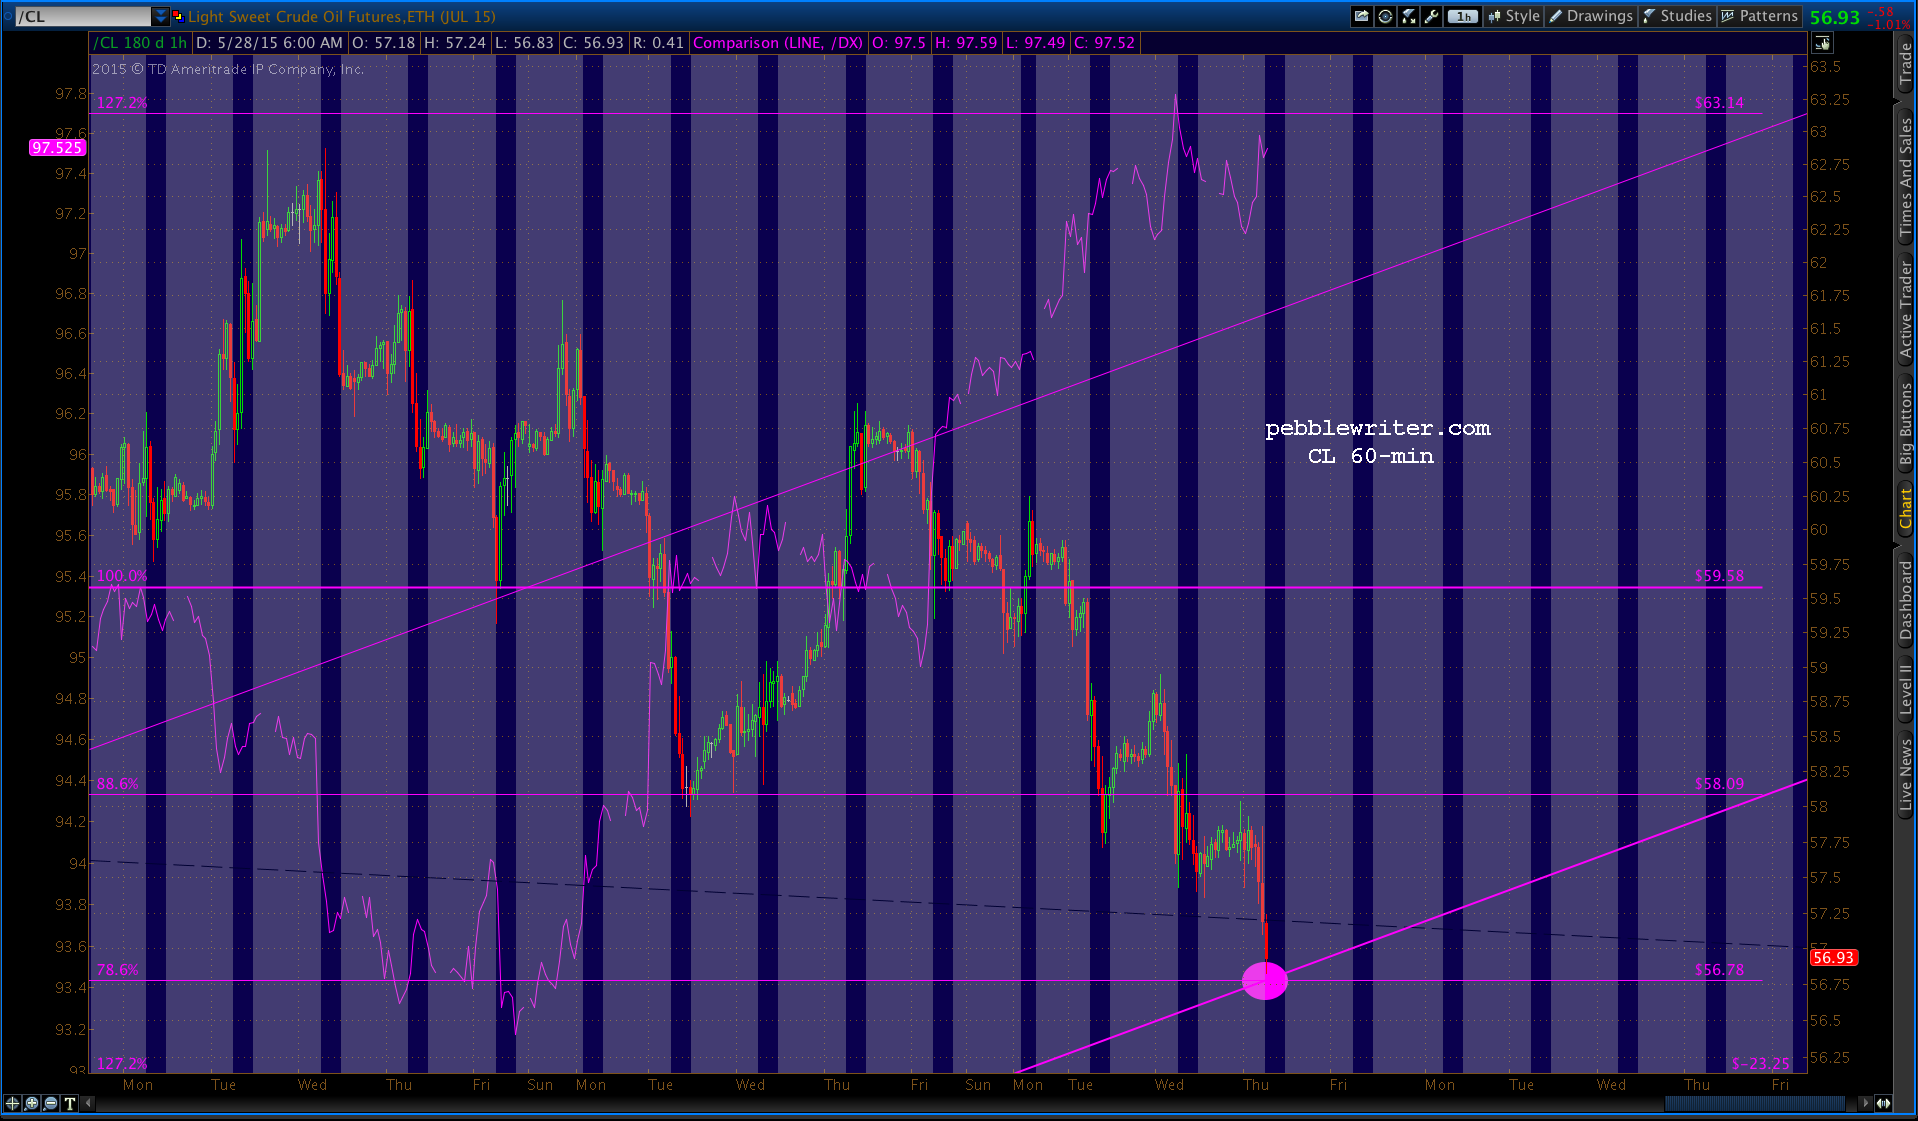
 Unfortunately for bulls, USDJPY and CL weren’t able to continue propping up SPX. CL and USDJPY (which had pushed above the .618 to new highs) both failed.
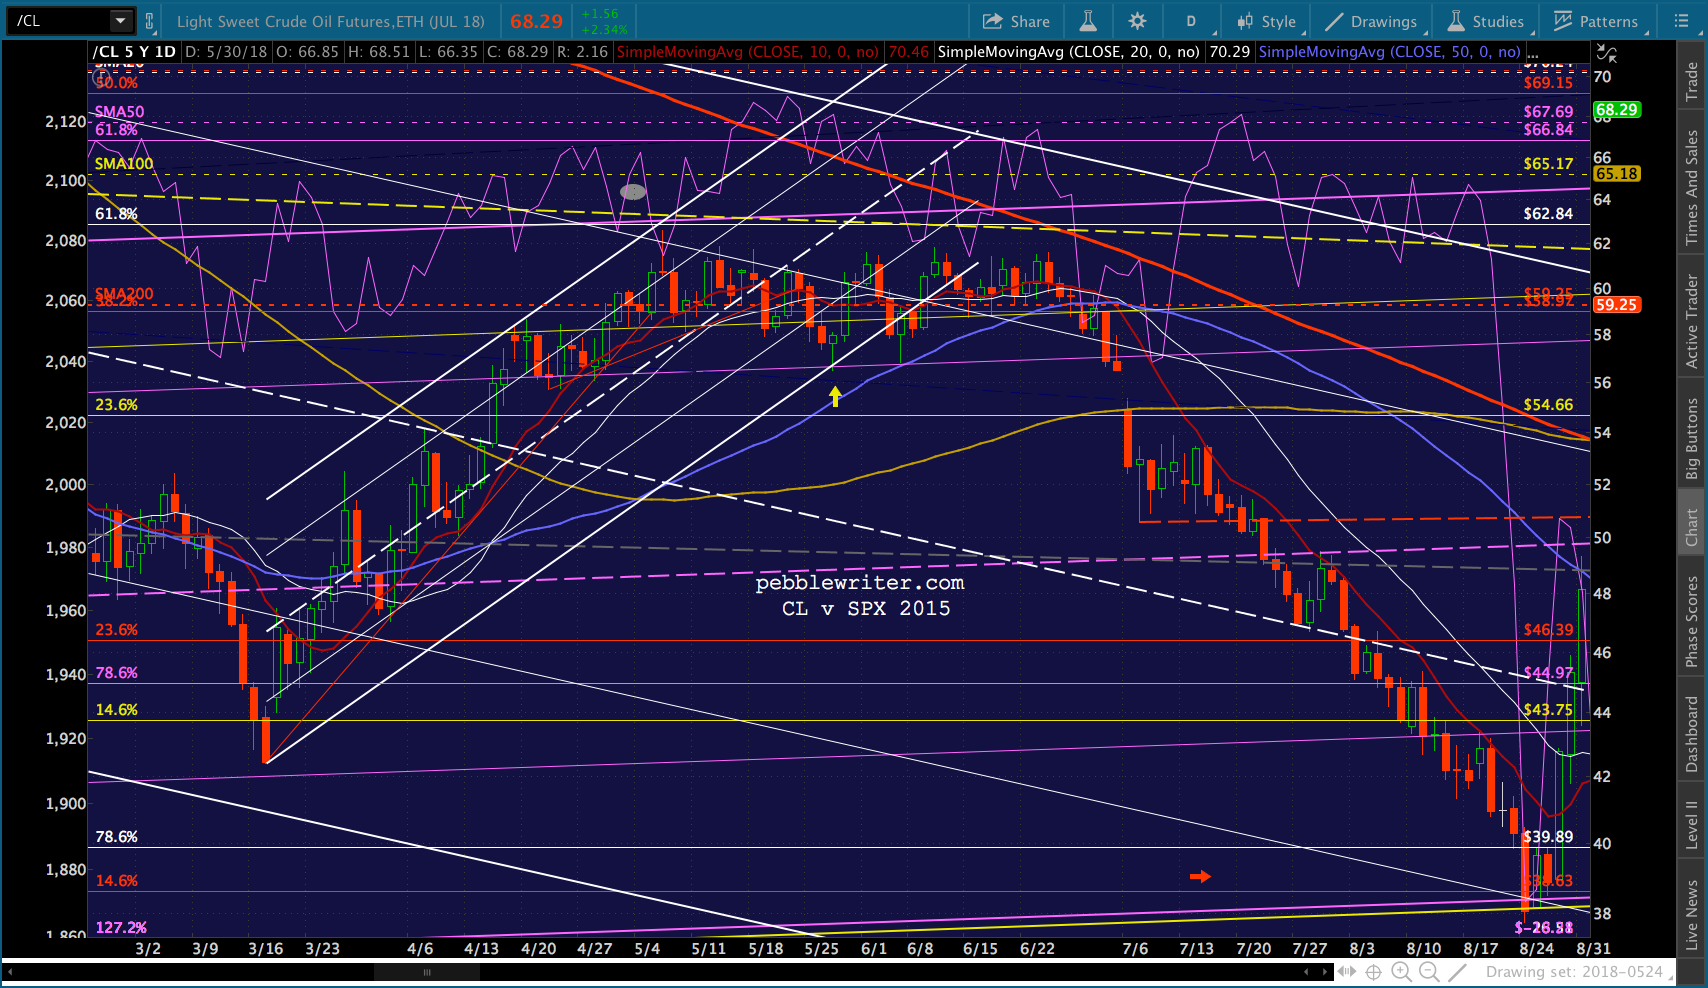
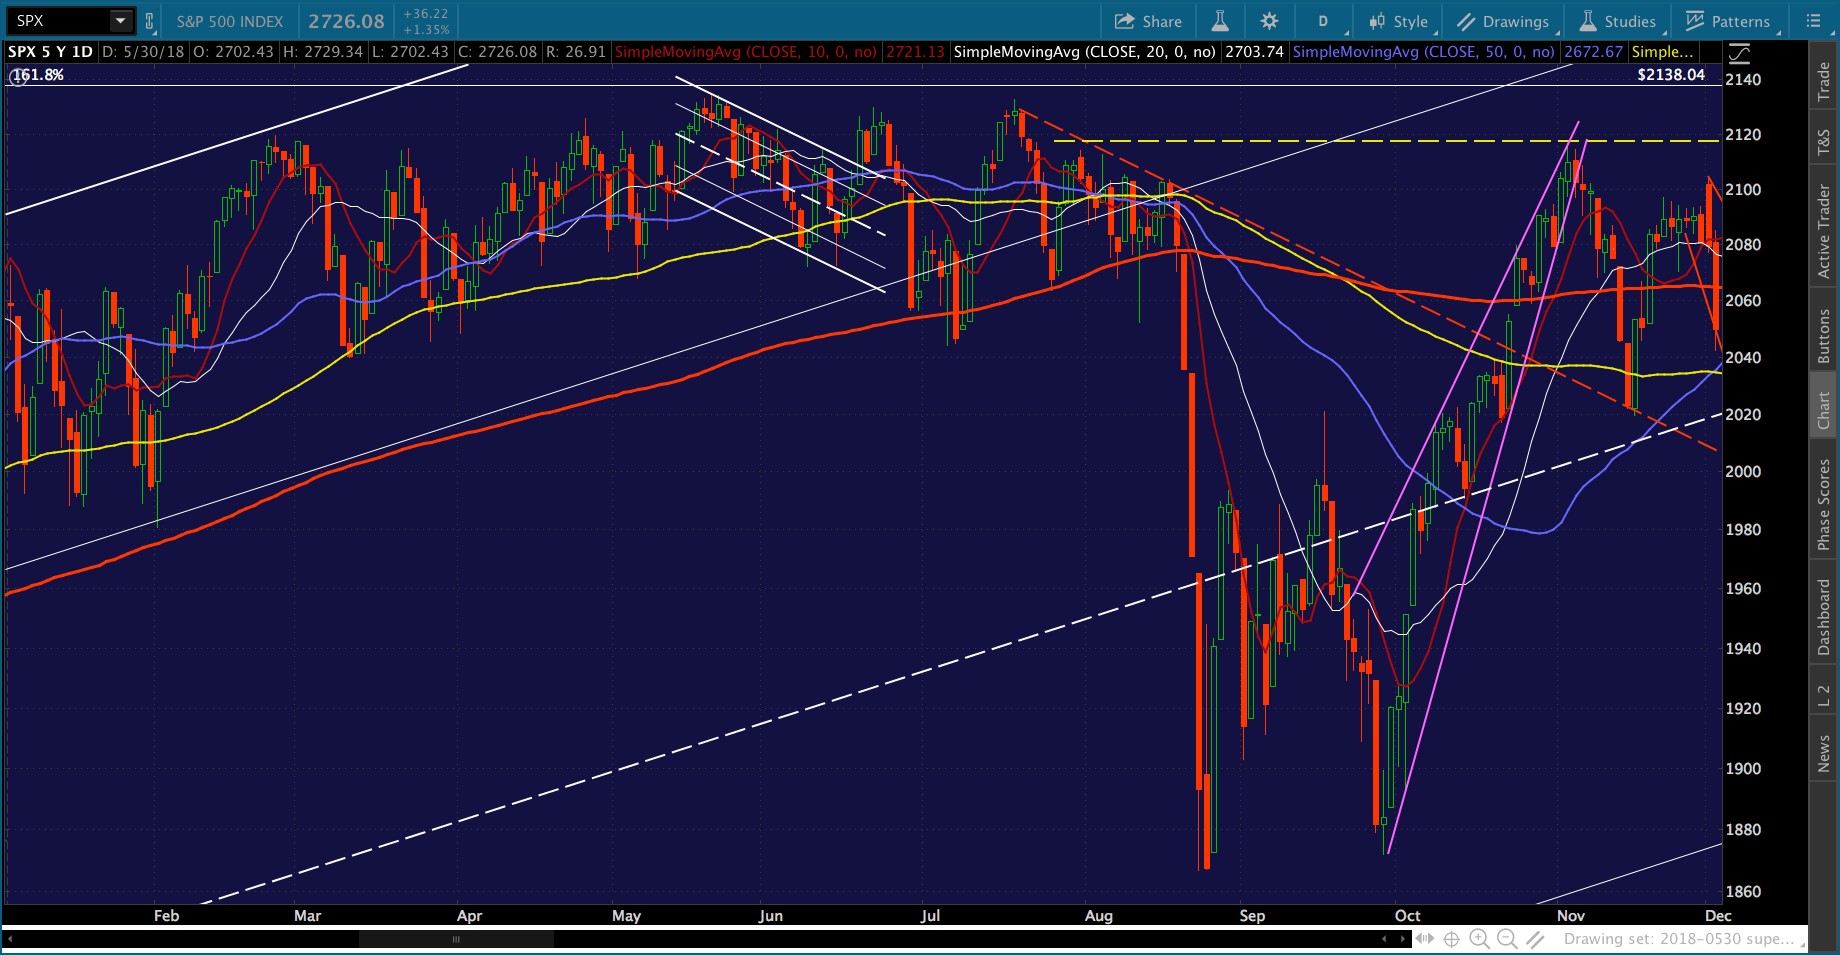 I don’t know for a fact that we’re seeing a replay. But, my gut tells me we’re headed down the same path. Here’s where things stand right now.