

Six weeks ago [see: Gold’s Inflation Warning] we noted that GC was approaching the 3012.80 target we set in April 2024. Its ascent was an indication not only that inflation prints were likely to be worse than expected, but that the equity market faced rough times ahead.
SPX’s very obvious negative divergence strongly suggests that the index had no business making its recent new highs.
As it happened, SPX proceeded to tumble over 10% from those highs. It’s troubling, then, that GC soared right through its 3012.80 target and is approaching our next upside target.
 It’s even more troubling that this is happening at a time when many equity investors have taken Powell’s soothing tone as a signal to jump back on the permabull bandwagon – despite the downright scary charts we’re seeing in equities.
 Dovish Chicago Fed president Austen Goolsbee said the quiet part out loud this morning on CNBC. Stagflation is a very real concern, and one that the FOMC has little chance of mitigating.
continued for members…
We’ll take a quick look at the overall chart picture, then focus on gold and silver. ES’ flag pattern is likely to test its lows, currently around 5620.

 Until SPX’s RSI pops back above the overhead resistance, the risks are quite high for lower equity prices. Our charts suggest late April for the end of the next leg down..


 OK, on to GC and SI. If it holds 3000, GC’s next upside target is the white 2.618 extension at 3344.80.
 Note that this is a very important target as it’s also the top of the rising purple and rising white channels. If it breaks above 3344, then the double breakout would signal a potentially momentous upside move.
 Recall that back in the 70’s, after a 36-year slide from 839 to 296, gold soared to 1652 even as stocks slumped (inflation adjusted.)
 Even on a nominal basis, the ascent was dramatic. But, if it doesn’t break out here, the decline could be just as dramatic as it heads back toward the channel’s lower bound.
 SI, on the other hand, is having a tough time cracking its upside target at 35.235.
 This is not only the white .618, but also the target of the large IH&S pattern completed in Mar 2024. Right now, it appears to be pulling back for the second time, with the SMA200 at 31 as a likely pullback target.
If SI manages to push past it, it has potential to 38.35-38.63. This would correspond with the red 1.618, white .707, purple .236 and red channel top.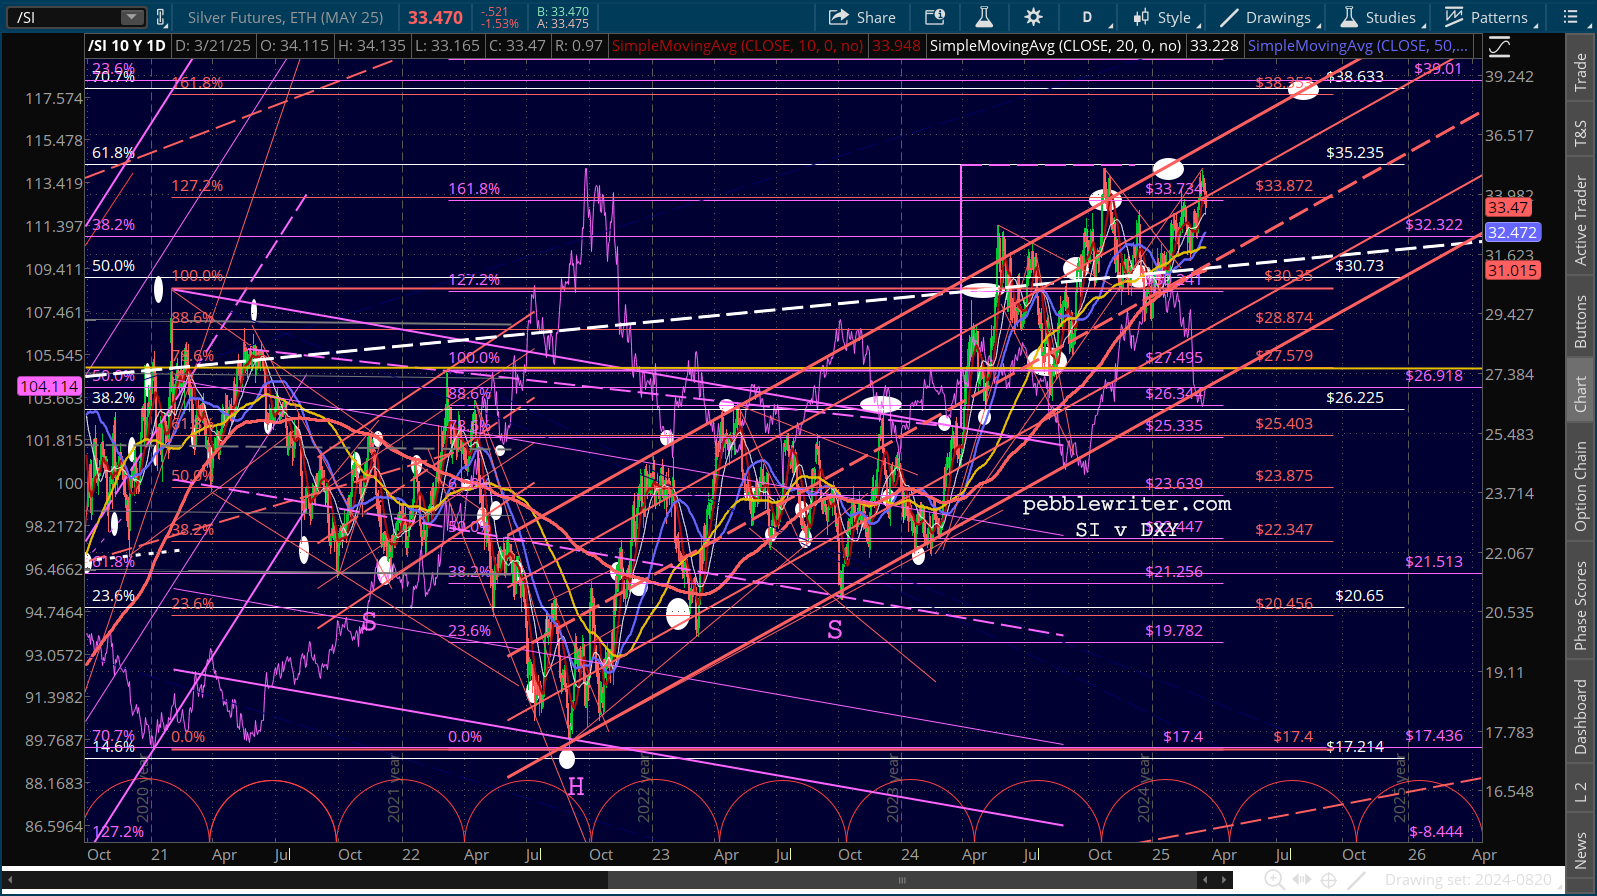 It’s interesting to me that GC is far outperforming bitcoin – meaning, I think, that it’s gaining more than just speculators and inflation hedgers.
GLTA.
continuing…