GC’s approach to our 3012.80 target from last April [see: Update on Gold and Silver, April 17 2024] reminds us that we’re not the only analysts concerned about tomorrow’s CPI print.
 As we’ve discussed for the past several months, Jan CPI should surprise to the upside. Will it be enough of a surprise to disrupt the euphoria surrounding stocks?
continued for members…
While ES and SPX have avoided any serious downside just yet…


 …SPX’s very obvious negative divergence strongly suggests that the index had no business making its recent new highs.


 For a closer look at GC and SI, let’s revisit that April 2024 post.
GC is fairly straightforward. There’s a large IH&S pattern which completed around Mar 7 targeting 2557, a short distance above the white 1.618 at 2466.50. If GC pops through this level, then the white 2.24 and 2.618 come into play.

You don’t have to be a chartist to see how strong the breakout in March was. Interestingly, it pushed GC back into the purple channel from which it broke down in Sep 22.
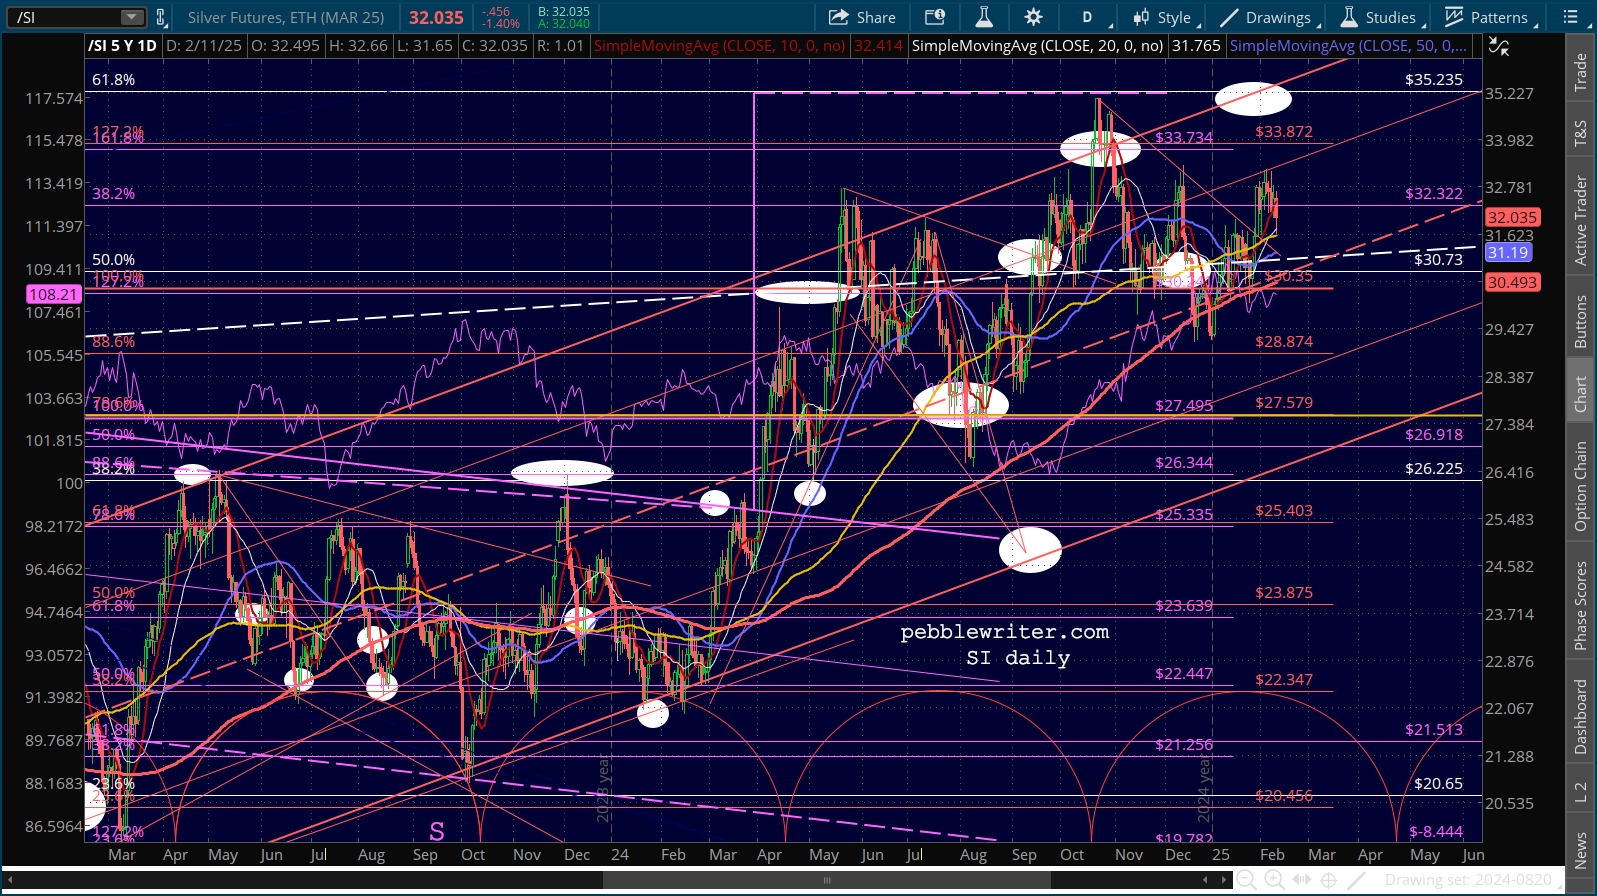
For SI, the picture is much more simple. It got to 29.90, just .34 away from our 30.24 target at the white 1.272. The latest thrust put it at the top of the well-formed red channel and the dashed, white midline of a channel that can only be seen on the monthly chart.
Unlike GC, it has not broken out to new highs. It might be worth trading if it pops above 30.35, as that would indicate potential to 33.73 or 35.235. But, I don’t believe the chart is as compelling as is GC’s.
Ten months later, we have gold rising to within 44 of 3012.80 while silver came within 0.16 of 35.23 last October. As we posted then, GC is the more compelling argument from a chart standpoint. It still has potential to 3344.80 and has made successive new highs, while SI has been making lower highs.