

Our analog remains on track, with the two session bounce currently testing the same trend line resistance that shut down the two previous bounces. The next session or two should help fine tune our timing.
continued for members…
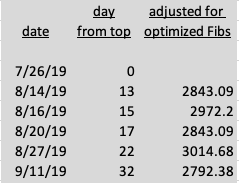
Our original analog called for 2972.20 on Friday Aug 16 — the white dot on the chart below. But, we’re clearly a day behind. Depending on how high we bounce today, we’ll find out whether the overly bearish tendency continues.
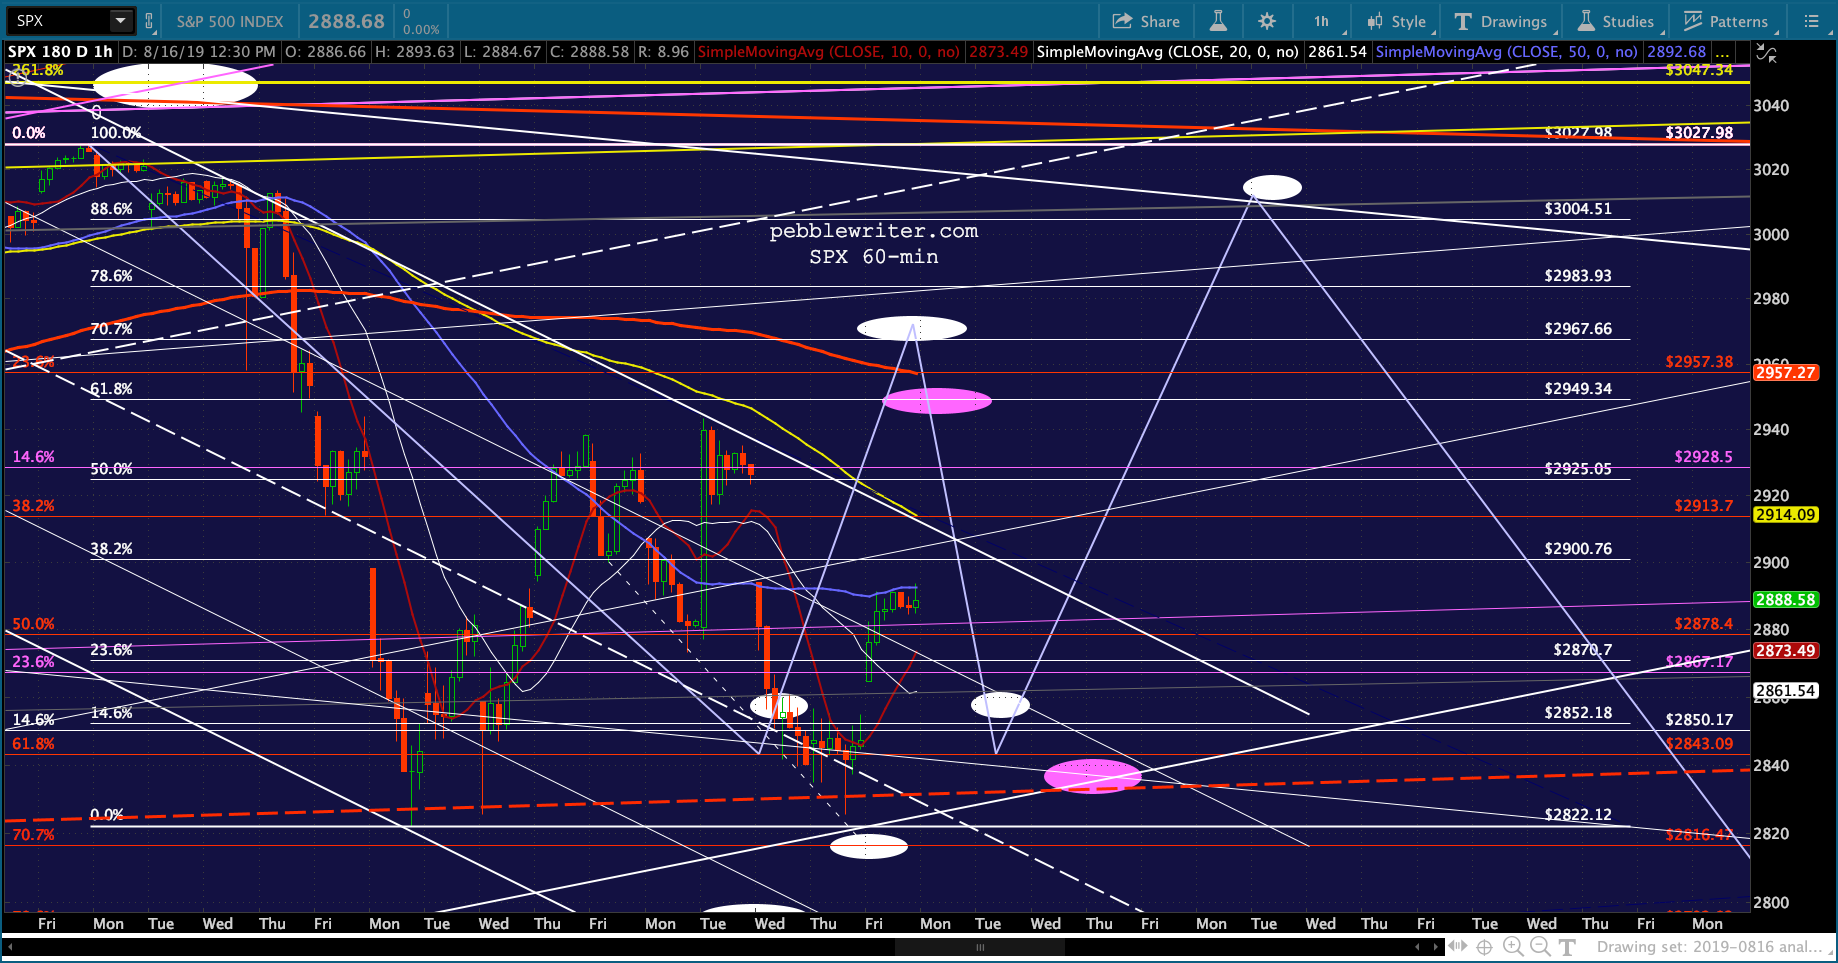 To reach 2972, ES will need to punch through that TL of resistance and test the dashed midline above — a tall order. It would also mean SPX punching through its SMA50 at 2945.77ish.
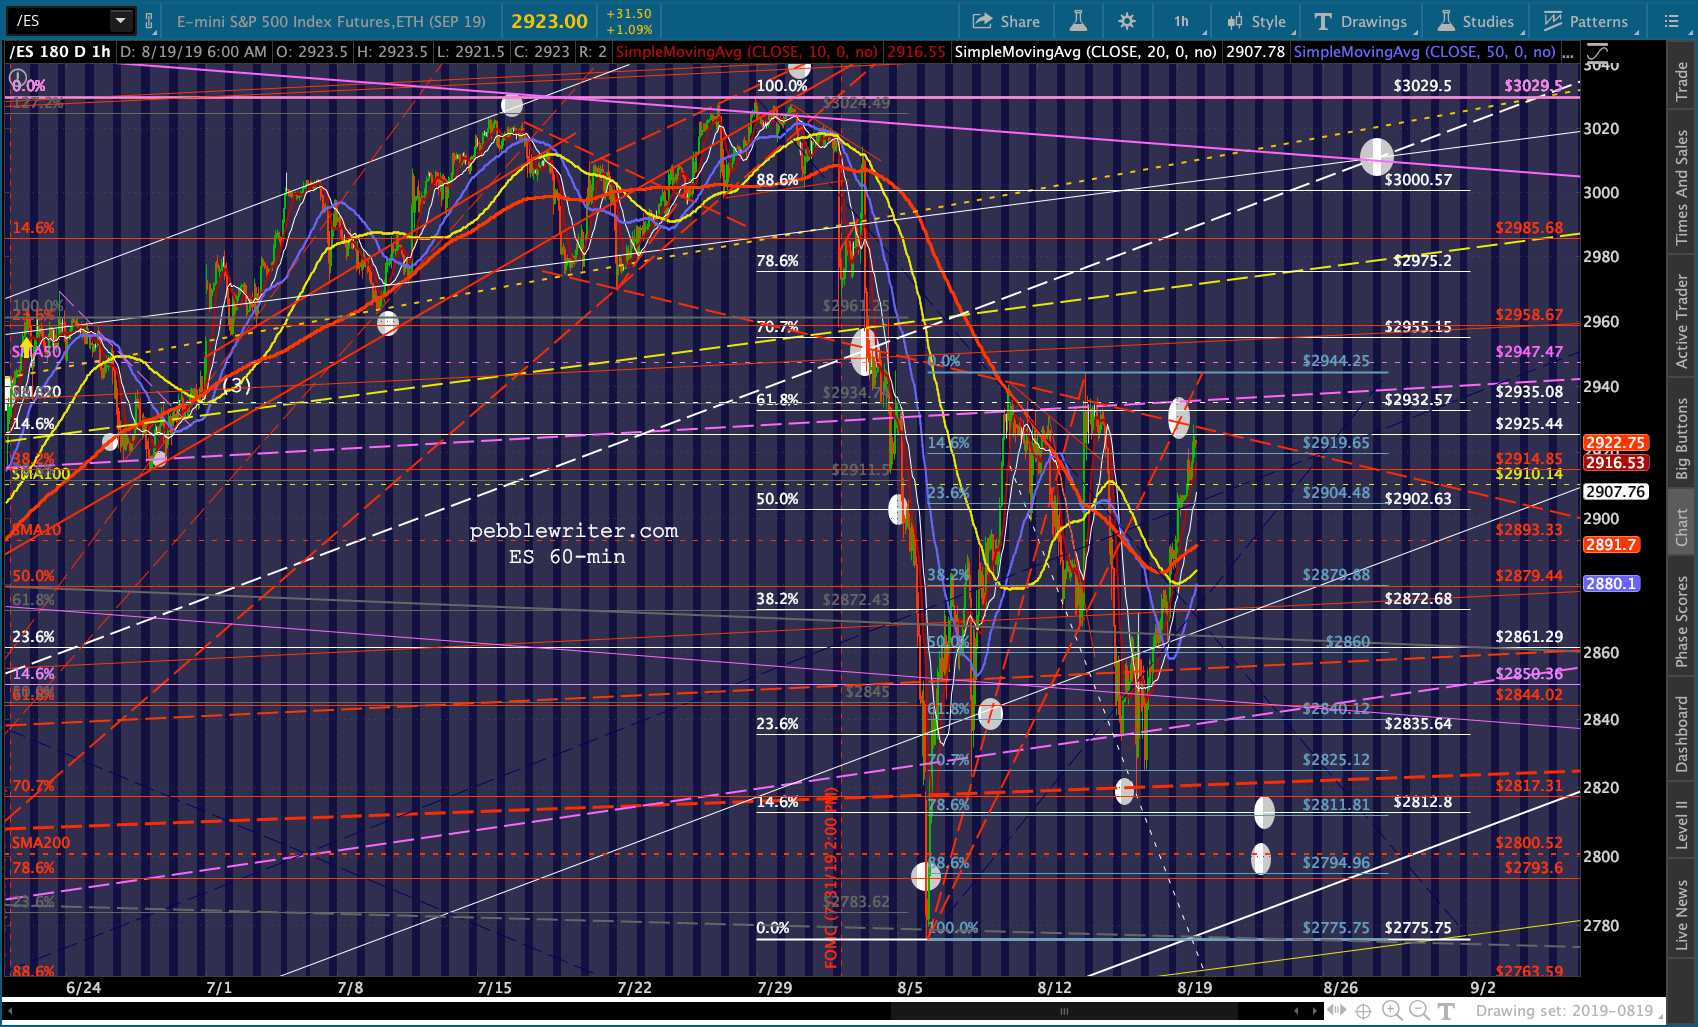 It’s helping quite a bit that 2s10s is bouncing off zero — allaying the fear that this particular signal will result in a recession.
 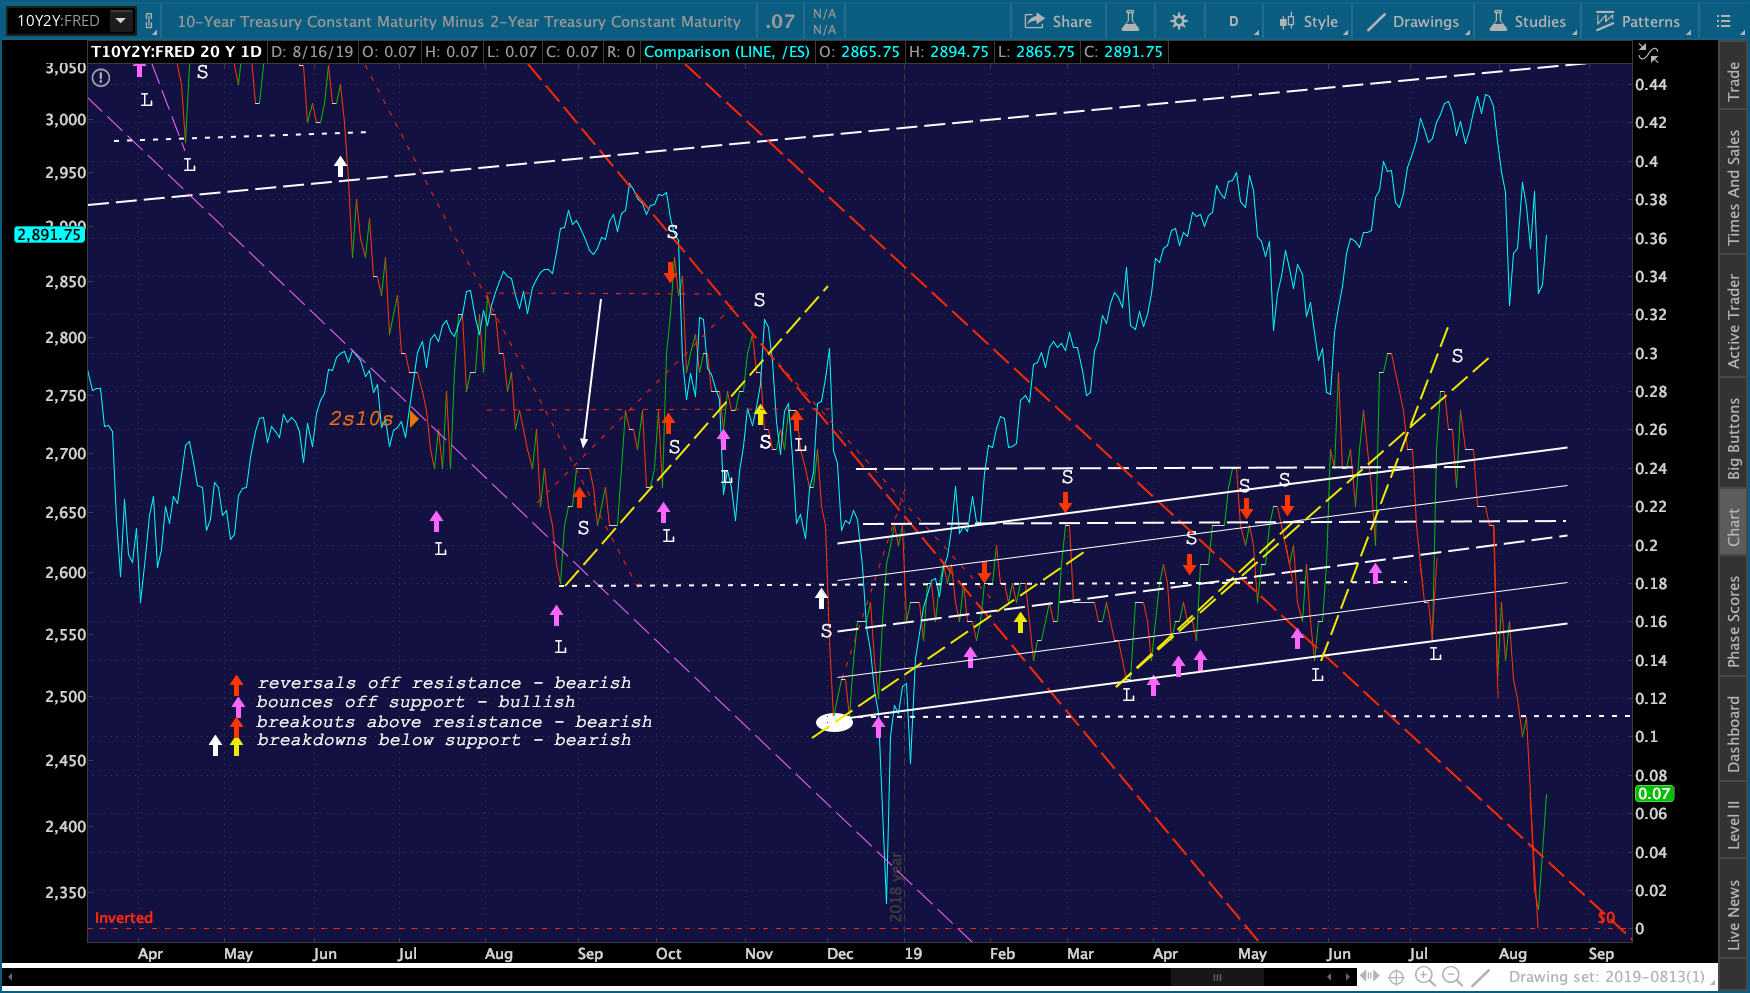 It’s also helping that VIX is dipping back into the falling red channel from which it broke out around Aug 2.
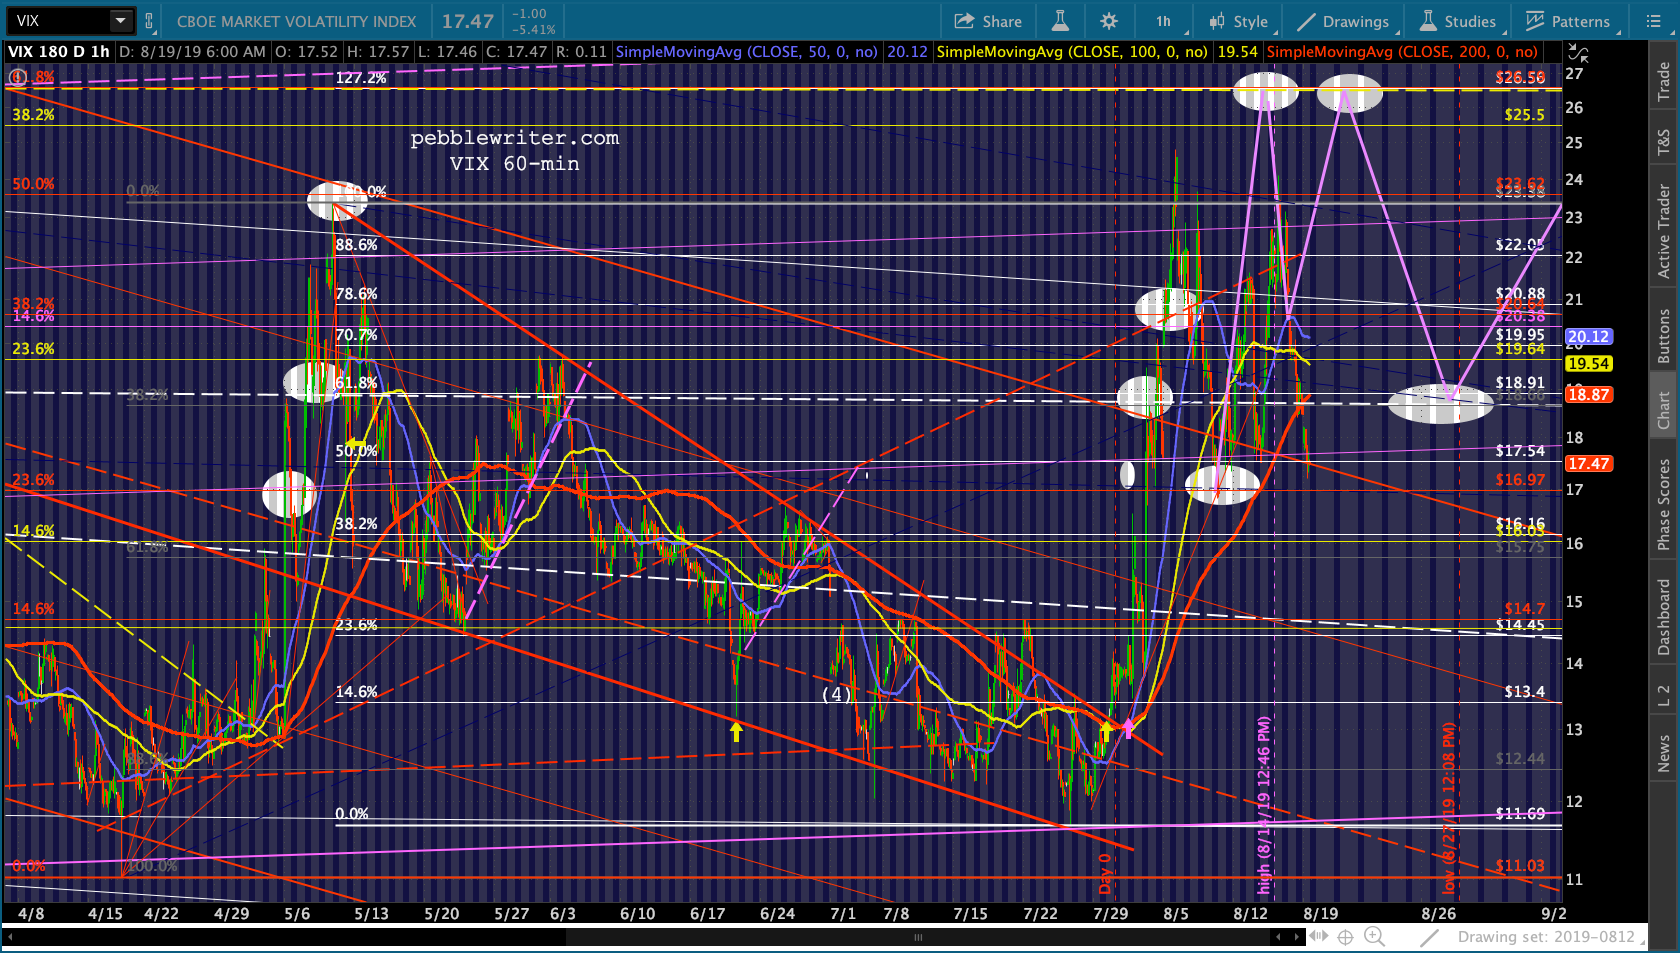 The rest of the charts, and then we’ll jump right into further analysis of the analog.
* * *
Looking at the original path mapped out by the analog, we can see it diverged twice: (1) the initial top came two days early; and, (2) the Aug 5 plunge was so severe that it took the place of the cycle low that was supposed to happen on day 13 on Aug 14.
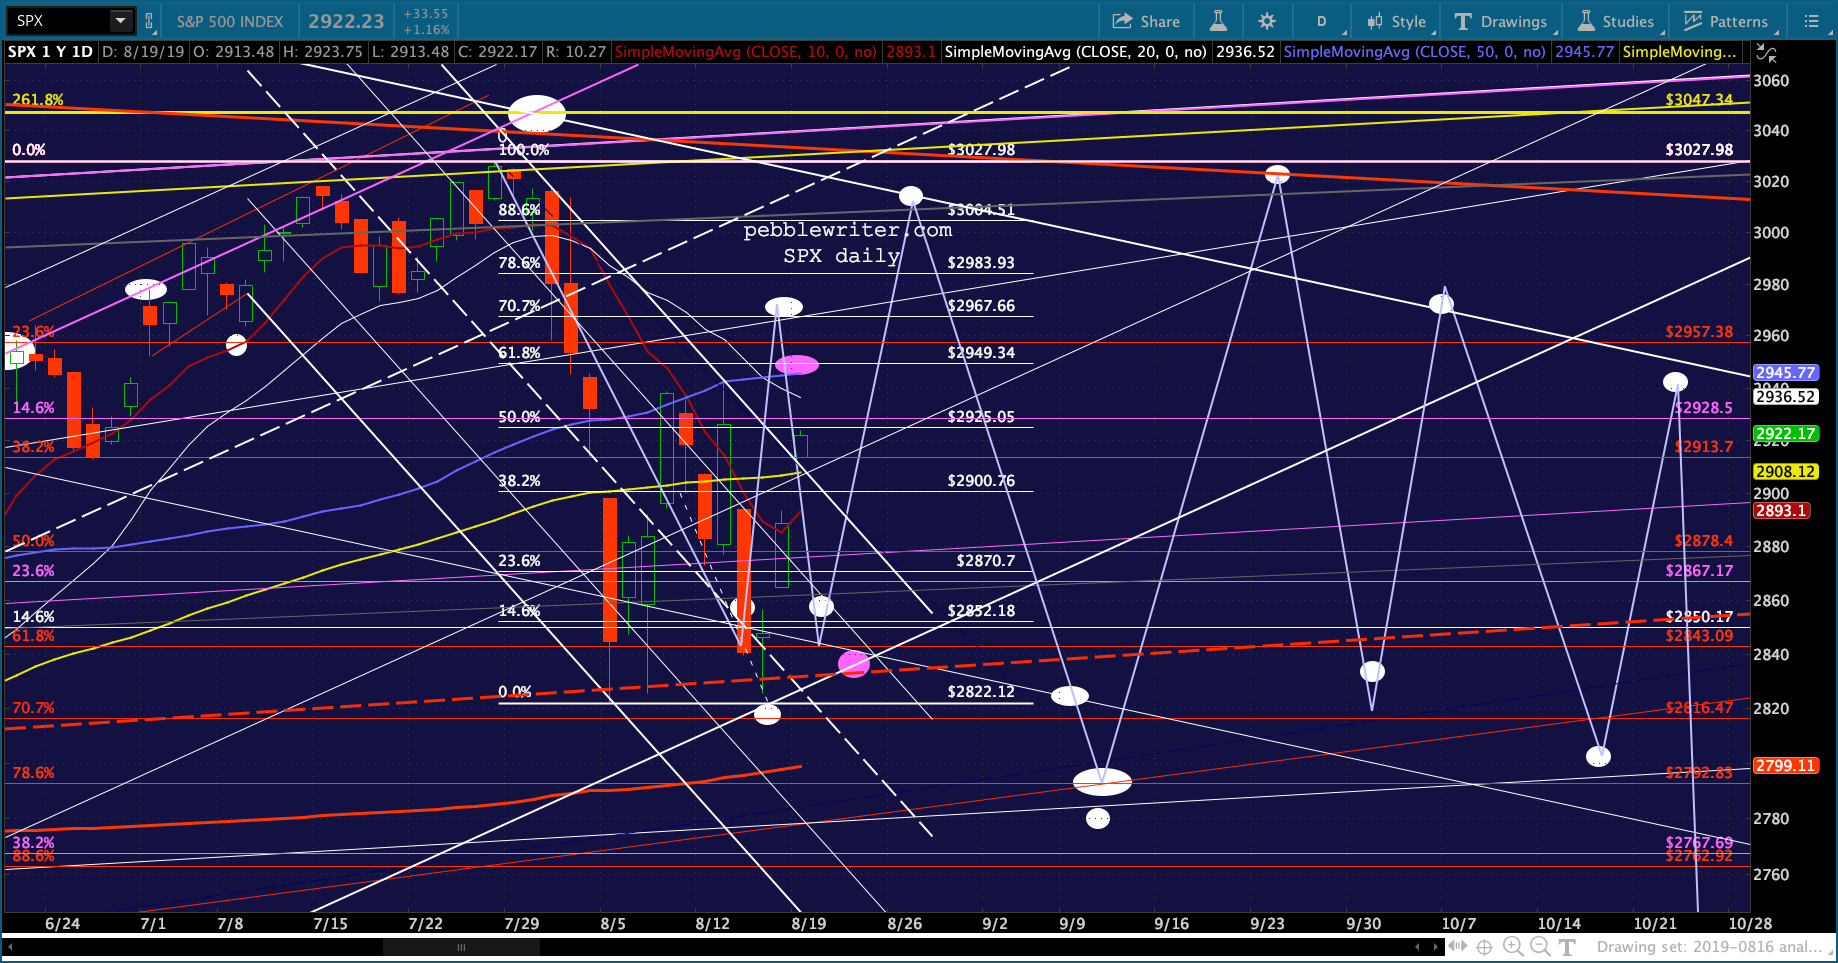
This is the original path mapped out on Aug 4 with turning points (the white dots) indicated solely by the percentage retracement between the top and ultimate bottom we anticipate occurring next May.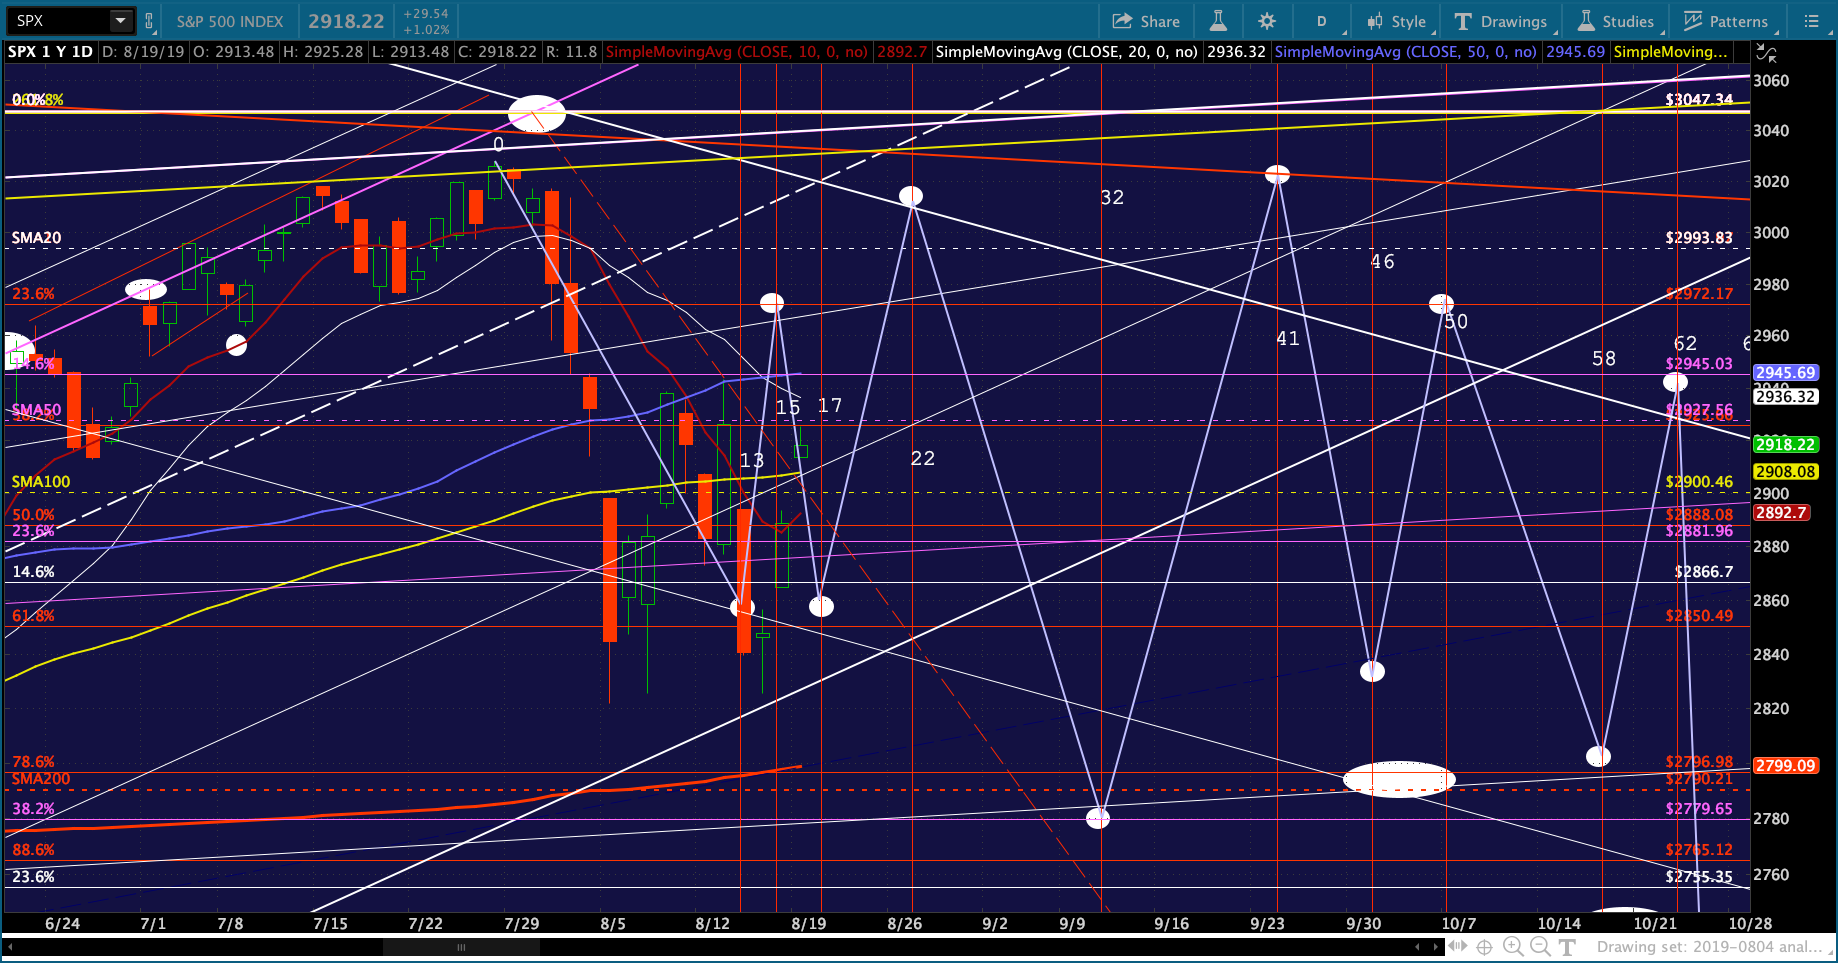 I looked at the original turning points and offered alternatives that I felt worked better with the Fib levels that seemed likely to be established along the way. These are the purple dots seen in the chart below.
The lower Aug 16 target, for instance, was based on what I expected to be the .618 retracement — a more likely target, IMO, than the .707 retracement at 2967.66 let alone 2972.
 How have things changed? The fact that SPX didn’t make it up to 3047 (the 2.618 Fib) on 7/28, but instead topped out two days earlier at 3027 was bearish. Also, the fact that the Aug 5 plunge was so severe was also bearish. It established a cycle low on what turned out to be day 6 rather than day 13 as our analog indicated.
On day 14 (Aug 15) SPX almost made a lower low which would have put everything back on track, but it came up 3 points short in addition to being a day late.
Our analog calls for a two session bounce and then a two session drop back to near (within a point of) the Day 13 lows. So, wherever it tops out today should usher in a drop back to 2823-2826 on Wednesday — unless the timing shifts yet again. That move should then be followed by a strong surge into the end of the month which is followed by a drop to new lows — ideally 2792.83.
I like the idea of a Wednesday low because Jackson Hole happens on Thursday and Friday and would be the perfect time for a rip higher to, say, the .9886 at 3004.51. A Wednesday low would also give SPX and ES a chance to flesh out their rising white channels that weren’t quite tagged with last week’s lows.
If that all comes to fruition, then today would be the equivalent of Day 15 even though it’s Day 16. I’ll hold off on making any adjustments to the chart until we see whether we get a significant reversal at today’s high.
 From a harmonic standpoint, any reversal shy of the .618 at 2949.34 would set up a potential Bat Pattern targeting the .886 at 3004.51. In fact, the Aug 13 high at 2943 would do the trick – meaning we don’t need to make a new high today. A reversal which occurs very close to 2949.34 would suggest a potential Gartley pattern targeting the .786 at 2983.93.
Another fly in the analog ointment is that ES has already tested its .618 twice. Today would mark the 3rd test.
For buy and hold type investors, use this information to inform your entry and exit points. If you’re adding to positions, for instance, you might want to wait until Wednesday’s lows at what could be 4% lower than today’s highs. If you’re trimming back, you might want to wait until the end of August when SPX should reach a cycle high. A few percent here and there can really differentiate returns.
For traders, we discussed strategy last week. There are many different approaches. But, I see this as the early rounds in what could ultimately be a lucrative opportunity to buy some “lottery tickets.” If SPX were to fall 7% between Aug 27 and Sep 11, some out-of-the-money SPY puts purchased during the late Aug spike could do quite well.
This is not a recommendation, of course — merely an observation.
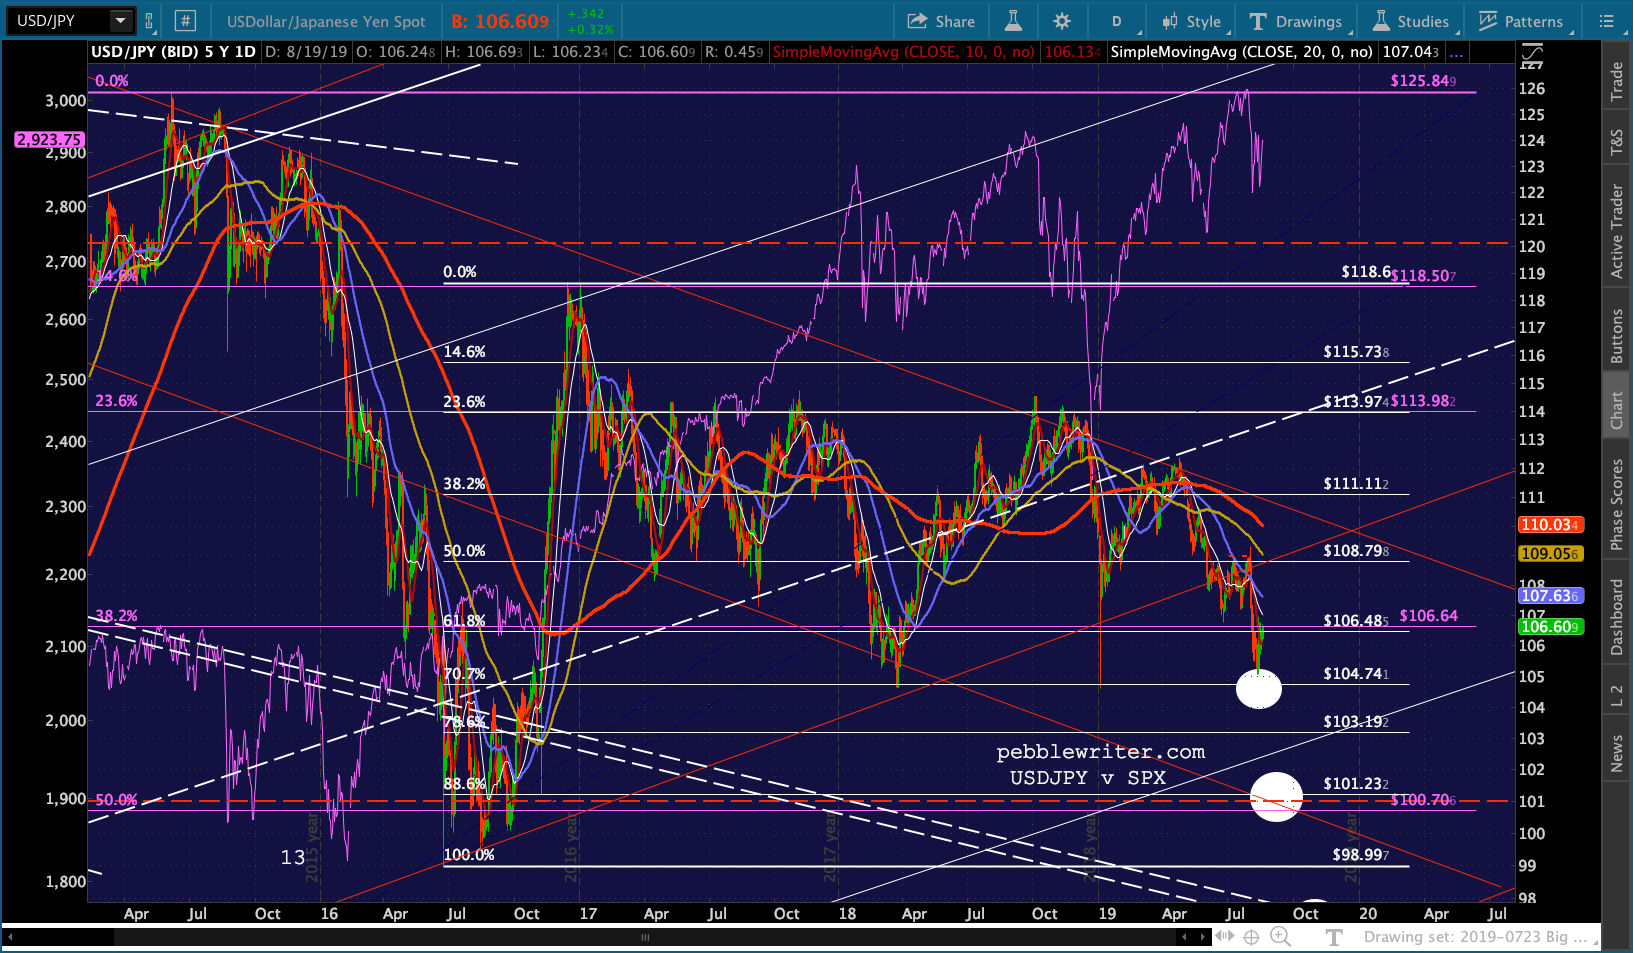
For those interested, here’s the initial drop and recovery back in May-June 2015 — obviously much more sedate and orderly and much less bearish than what we’ve seen over the past month.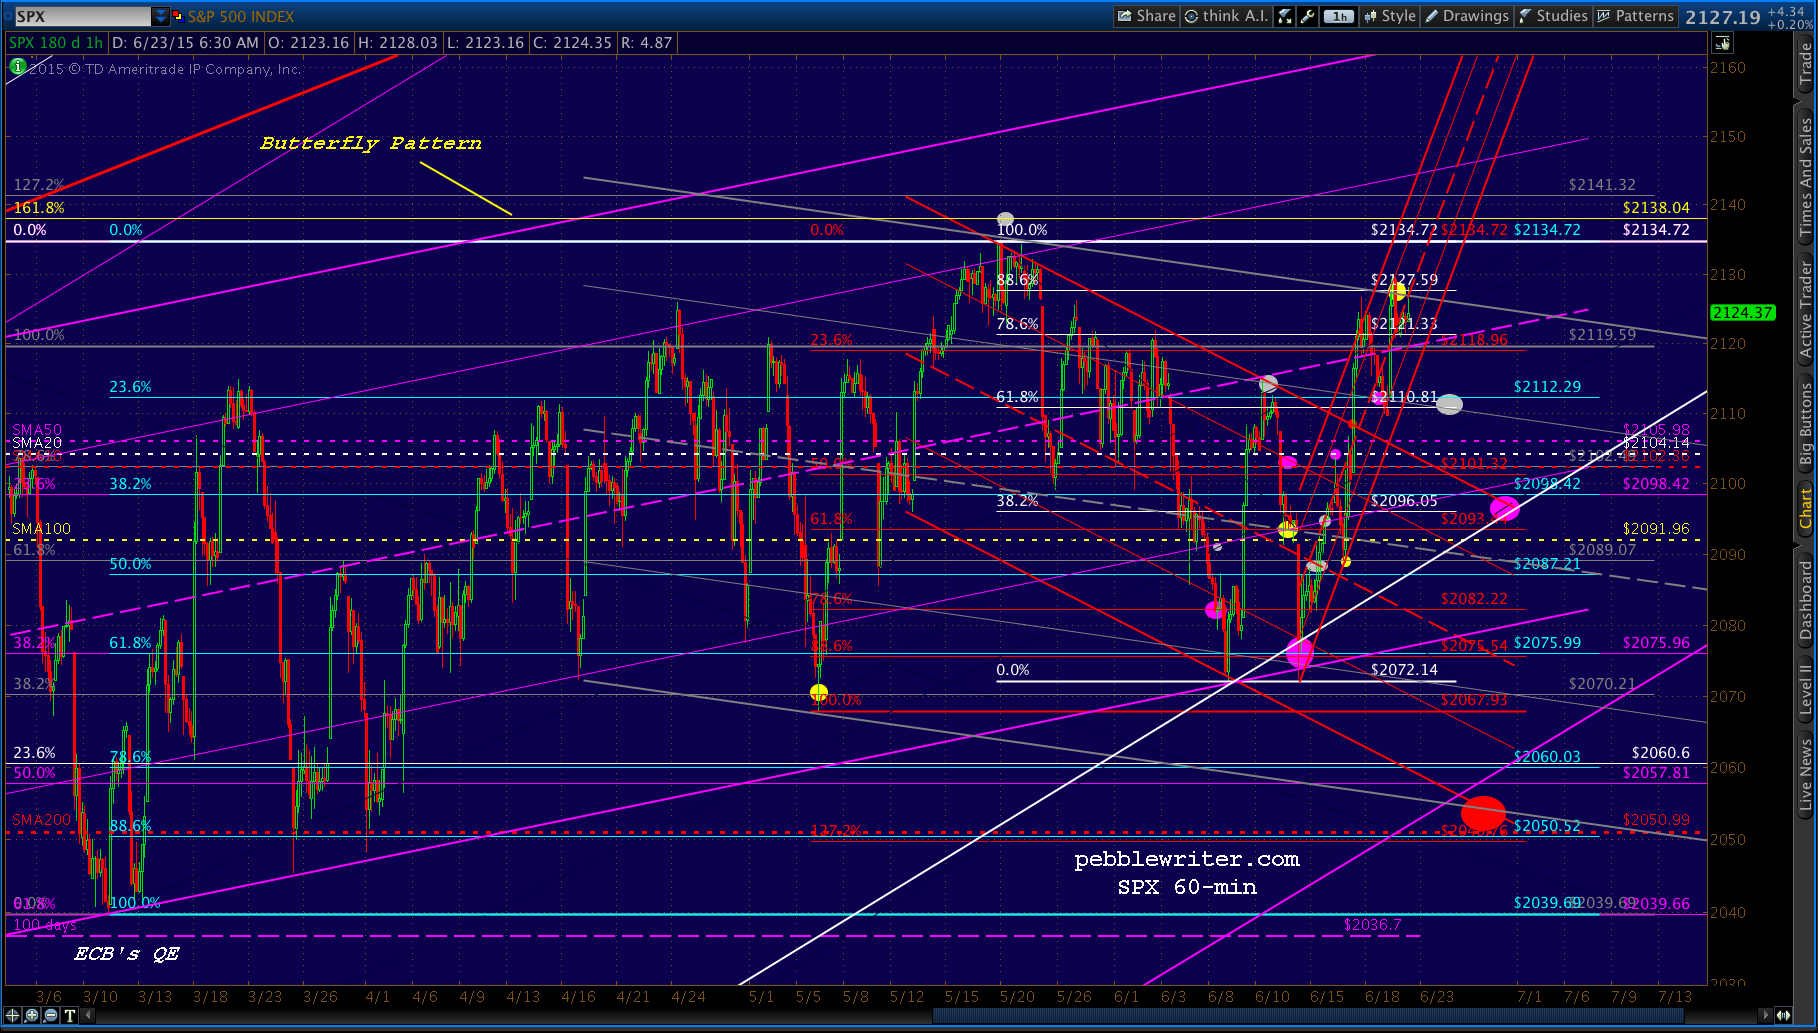 One last note regarding the analog…everything is connected. When SPX drops precipitously, we can expect oil and/or USDJPY to also drop or at least threaten to drop and VIX to rally or at least threaten to rally. These moves don’t have to be to new highs/lows. It can be enough for VIX, for instance, to threaten a breakdown below resistance. That’s often all it takes to get the algos going.
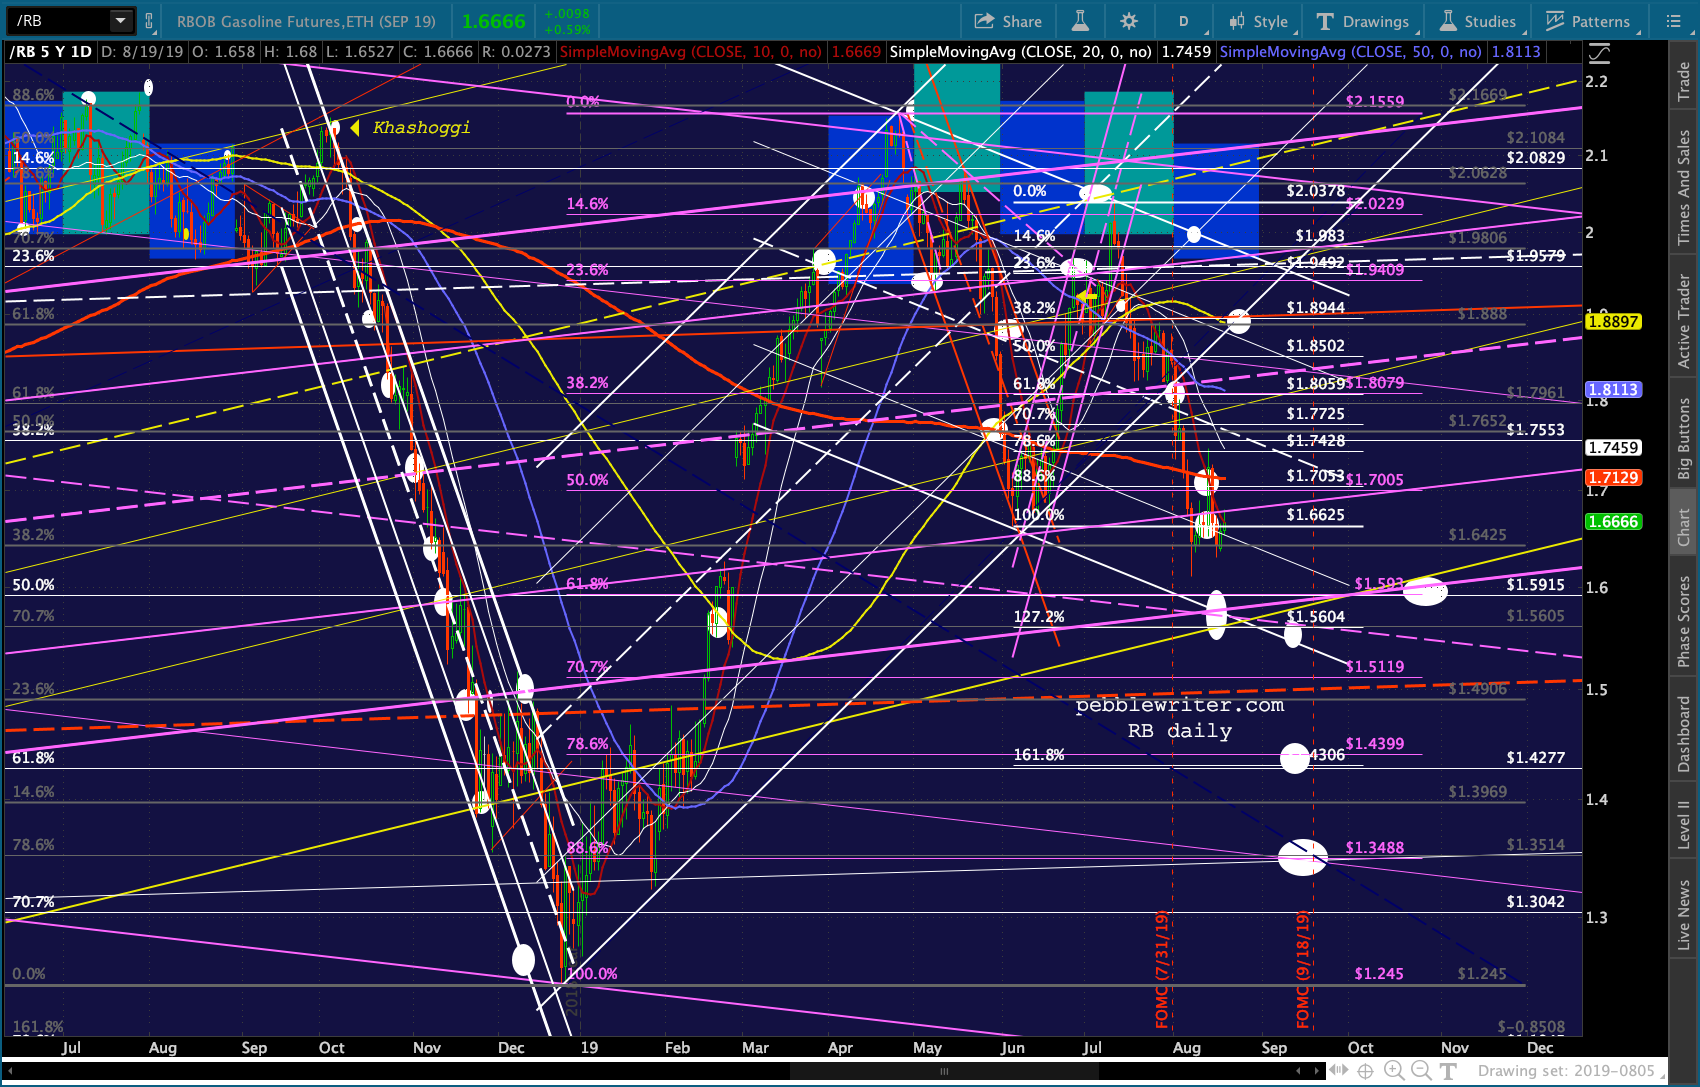
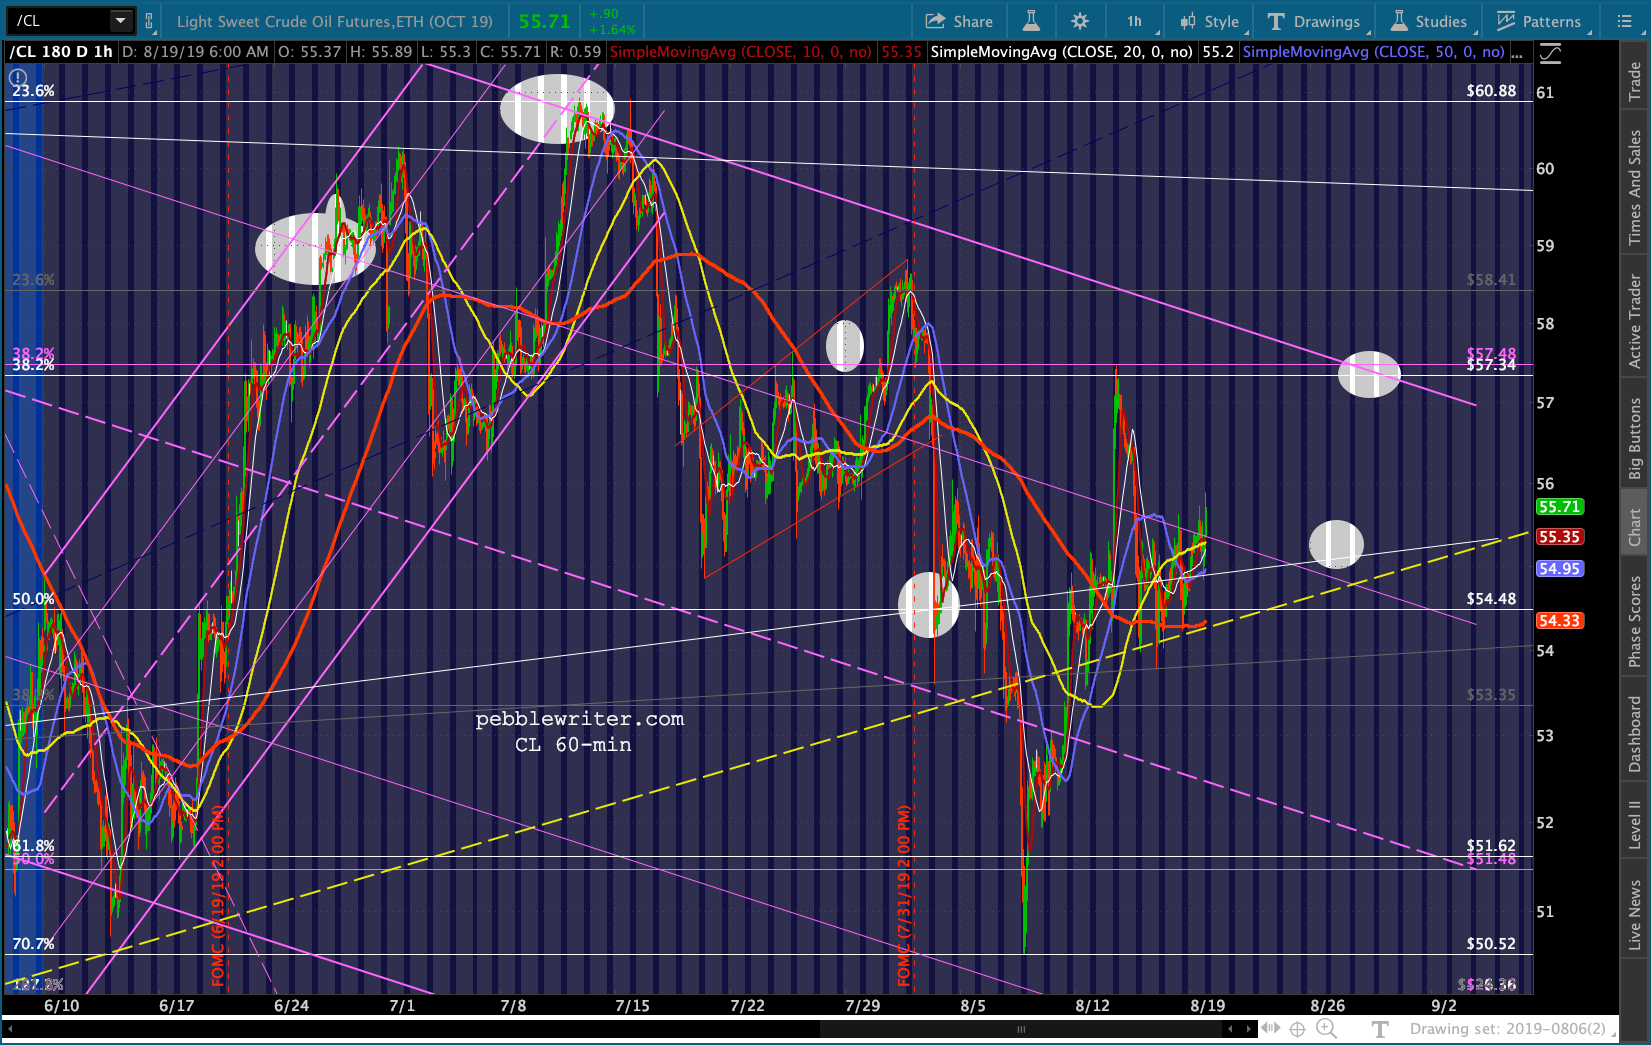
As long as we’re in analog mode, the expected swings in SPX will play an important role in determining where USDJPY, CL, RB and VIX go. But, that’s backward…right? It’s actually these instruments that will, in the end, drive stock values. But, by knowing where SPX is going we can make certain assumptions regarding how these factors will behave. The only thing we can’t know for certain is whether, for instance, SPX’s next collapse will be touched off by VIX spiking up to 25 or CL dropping to 47.55…or both.
So, I’ll continue to look at expected stock moves and make some educated guesses about the factors that should help produce those moves.