Thanks to the many well-wishers for your messages of support over the past few days. My knee surgery went very well Tuesday and I’ve already graduated from the walker to crutches and am determined to replace them with a cane by the end of the day. I’ll probably skip the Boston Marathon this year, but there’s always next year. The downside of a knee replacement is that it’s somewhat painful. So, please excuse the drug-induced typos that are bound to crop up over the next few days!
* * *
On to the markets. This one is easy. SPX will make new highs on the open this morning. But the 10-DMA is still below the 20-day, ES’s rising red TL is hanging by a thread…

 …and VIX has passed on the opportunity to ramp things even higher – remaining above its SMA200 and the red TL from Aug 5. There are many other warning signs flashing from TNX to AAPL. In other words, caution is warranted. Despite the recent rally, the downside risk is far from over.
continued for members…
At the very least, ES should backtest the 1.618 it just broke through. If 3336.49 doesn’t hold, we’re looking at the red channel bottom – the channel ES broke back into after breaking down – at around 3310. If it breaks down again, then the purple channel backtest – where it intersects with the SMA50. And, so forth.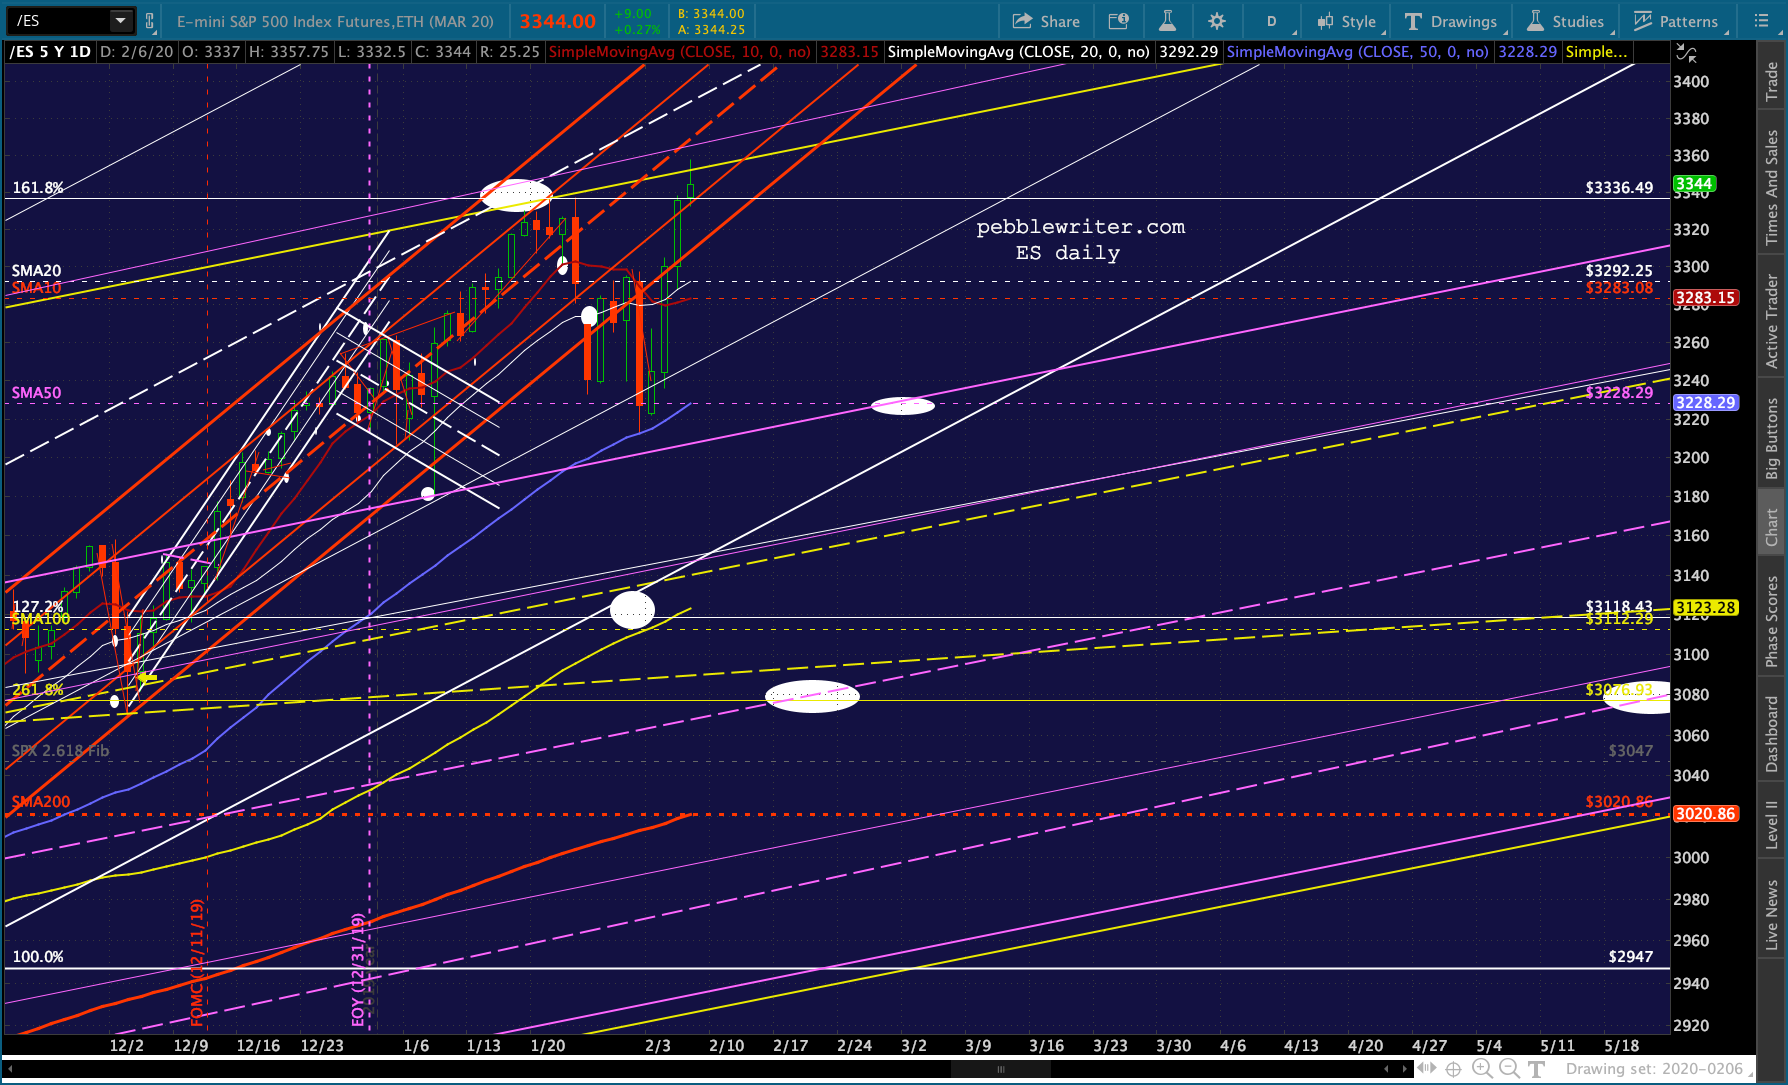 The yellow channel .786 line is around 3341. If ES is unable to breakout, then this opens up the yellow midline currently near the SMA100 at 3123.19.
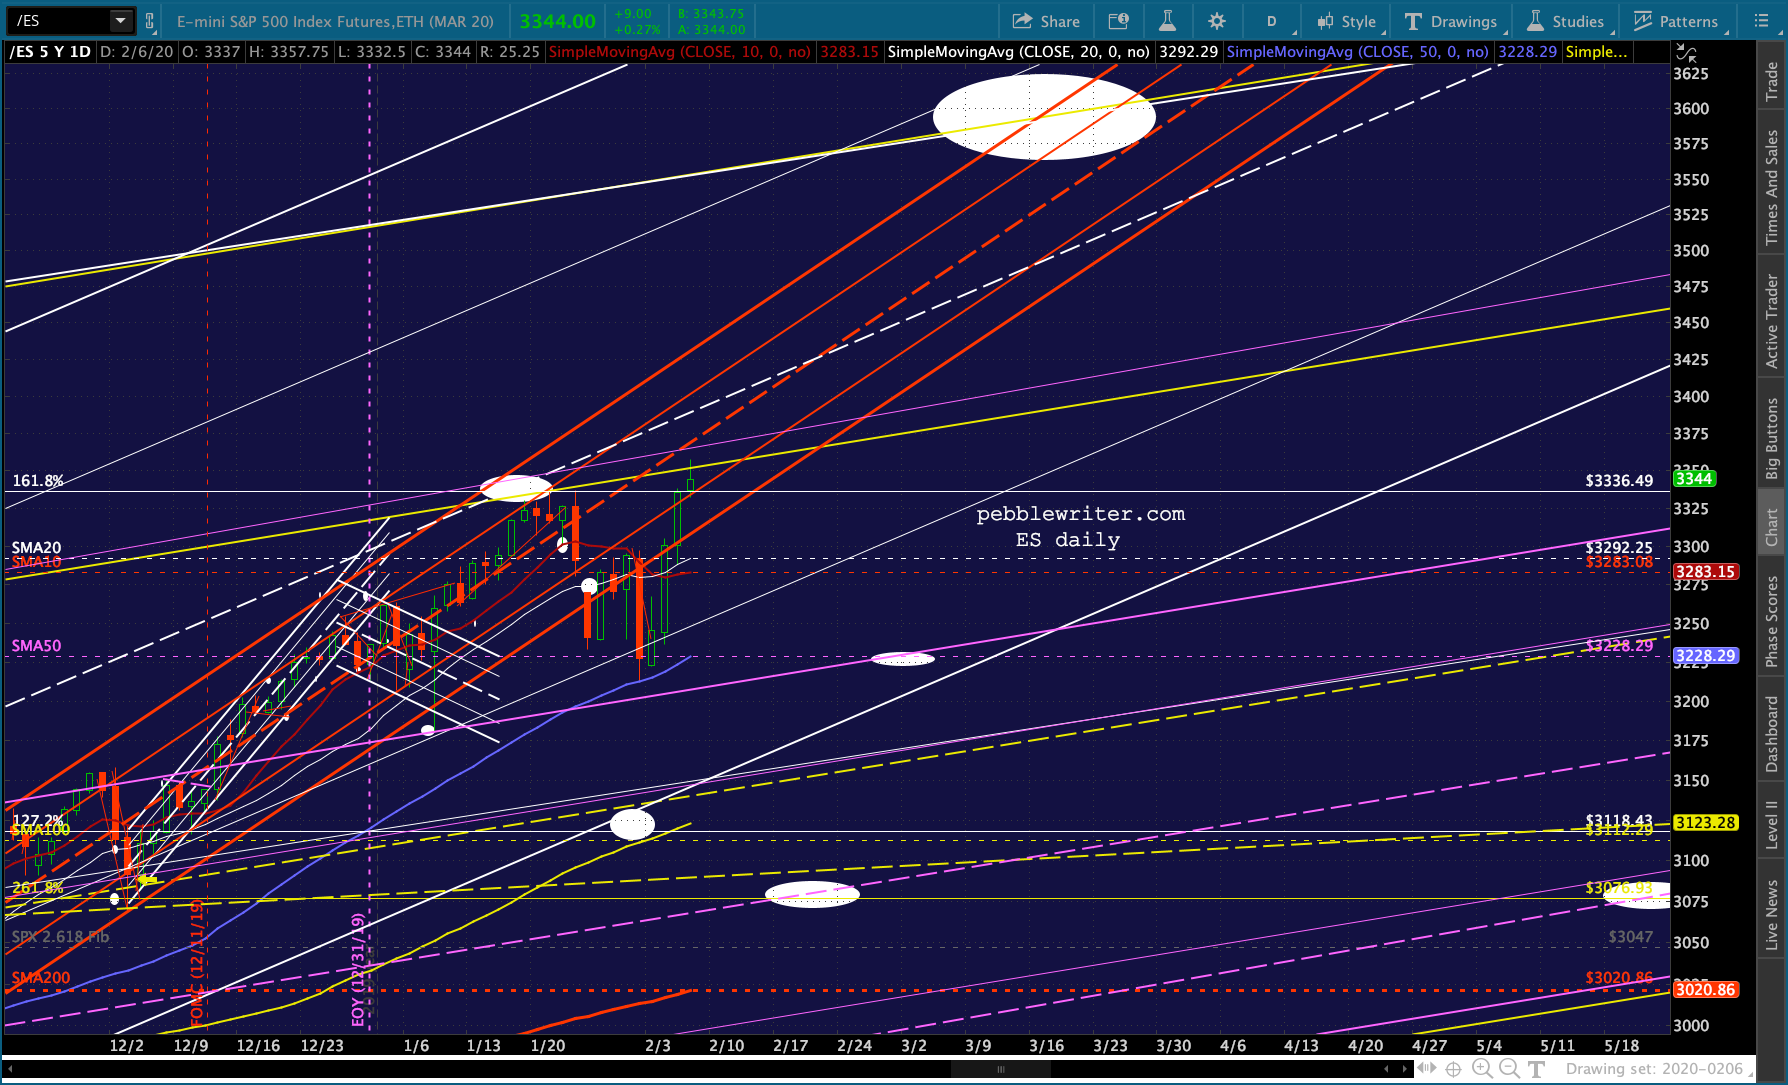 And, the SMA200 is still approaching the yellow 261.8 – which remains an interesting backtest target at 3076. If instead, ES can remain in the rising red acceleration channel, we still have an IH&S target at 3728.
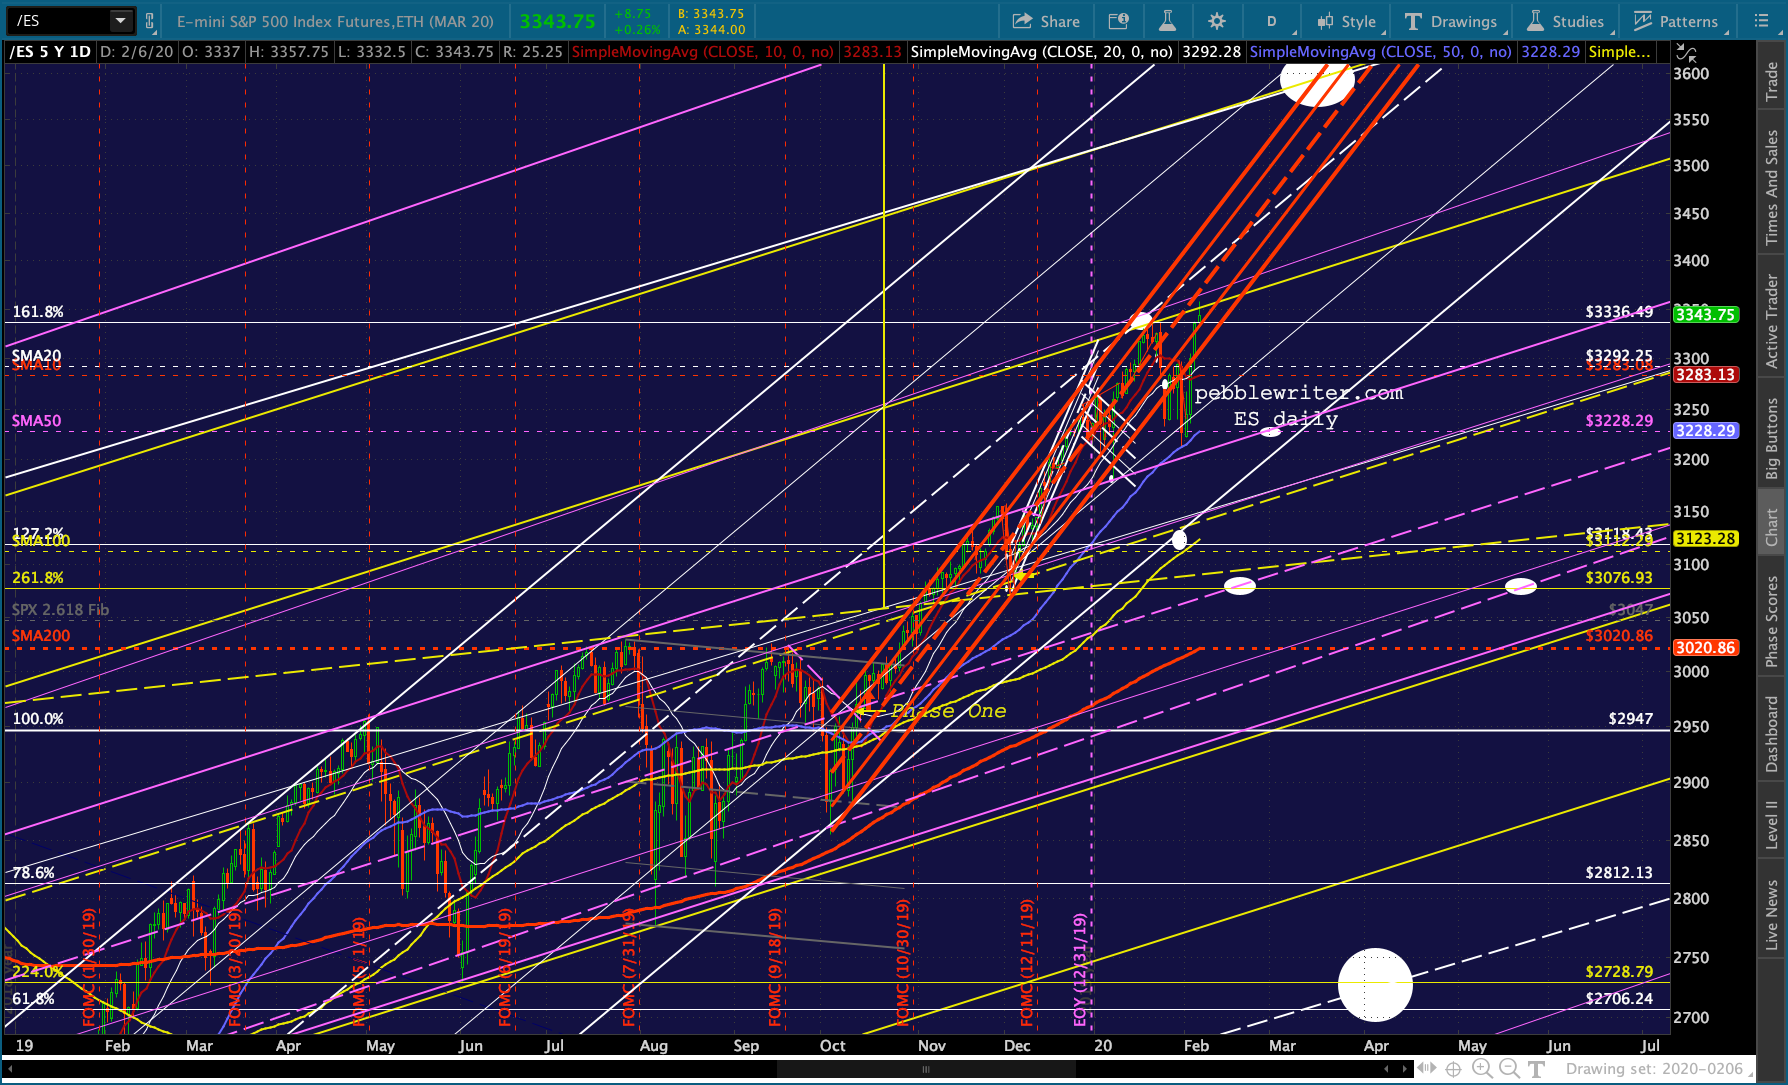 The factors still favor the downside case here. On the currency front, USDJPY is running into the .886 Fib and the red channel top again. The next major move should be lower. But, a breakout above 110.28 would be quite bullish for stocks.
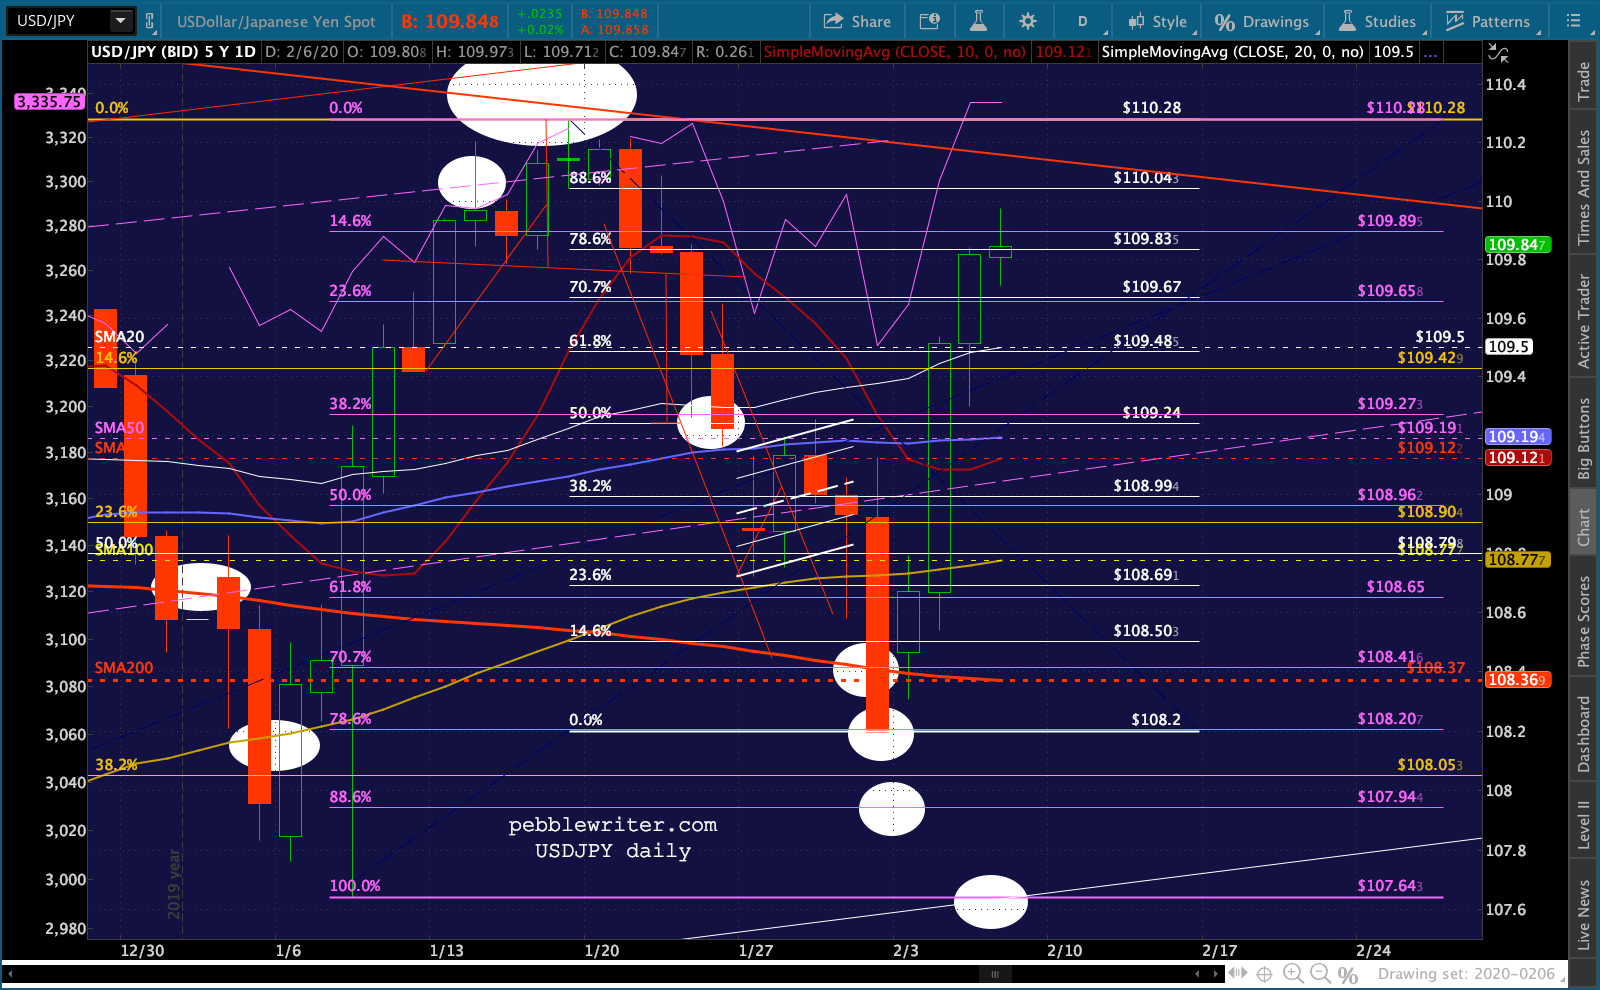 And, while EURUSD looks bearish – with a little H&S forming – note that it has tested 1.099 four times now. If that support holds…
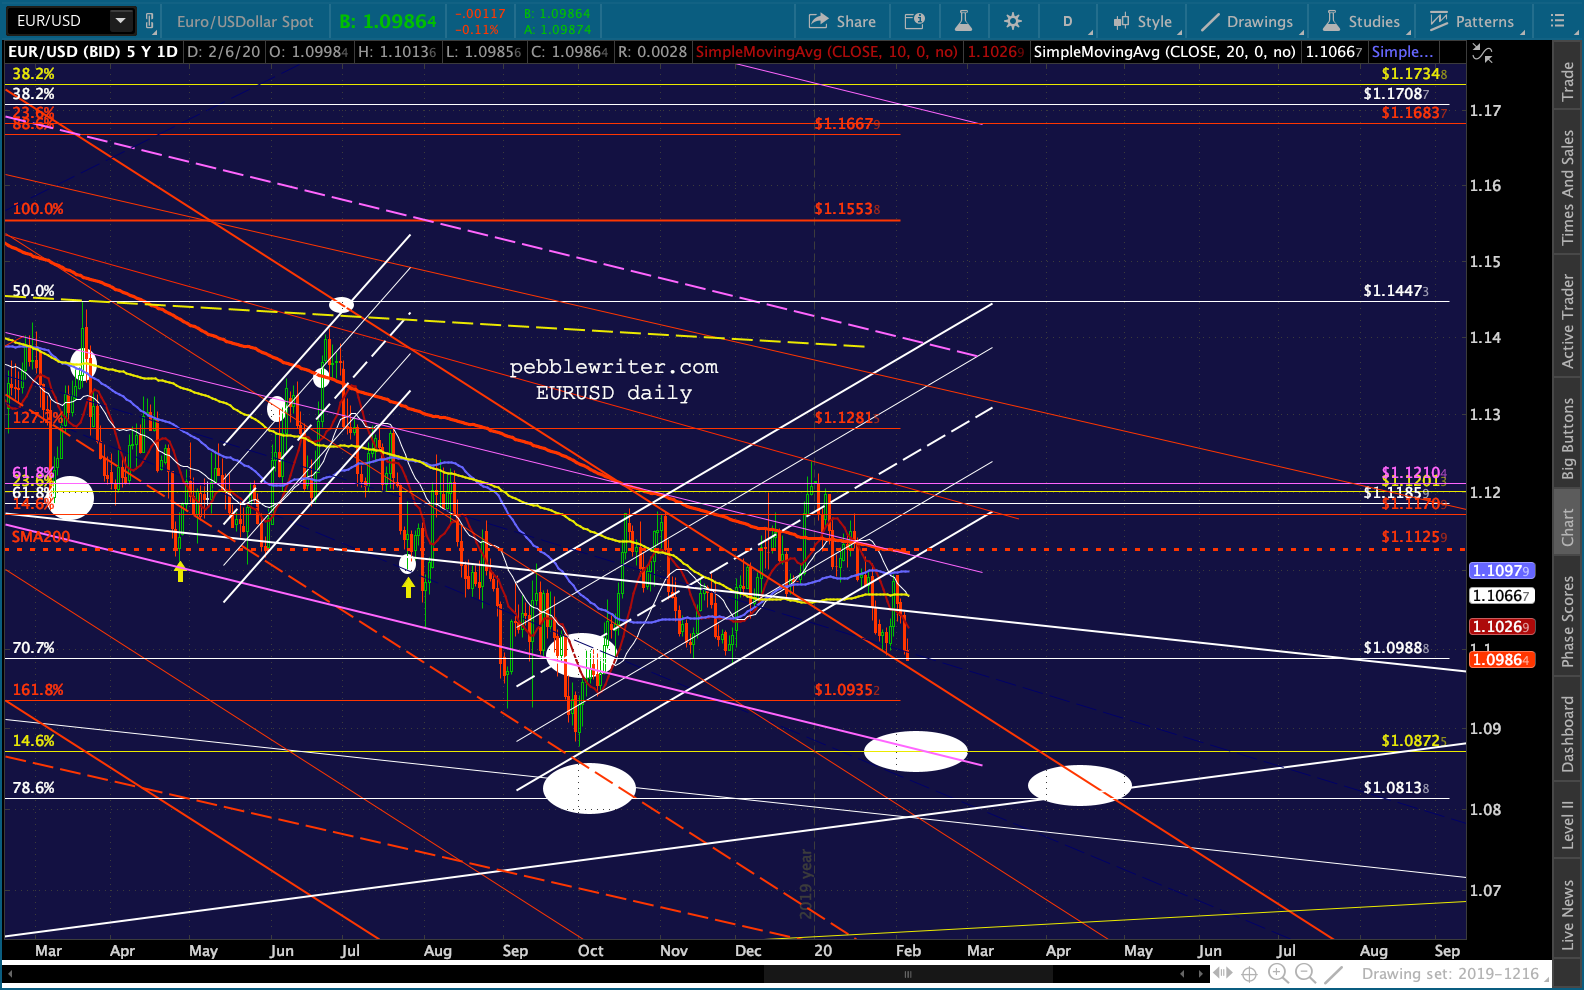 …then DXY is unlikely to break out of the little flag pattern.
 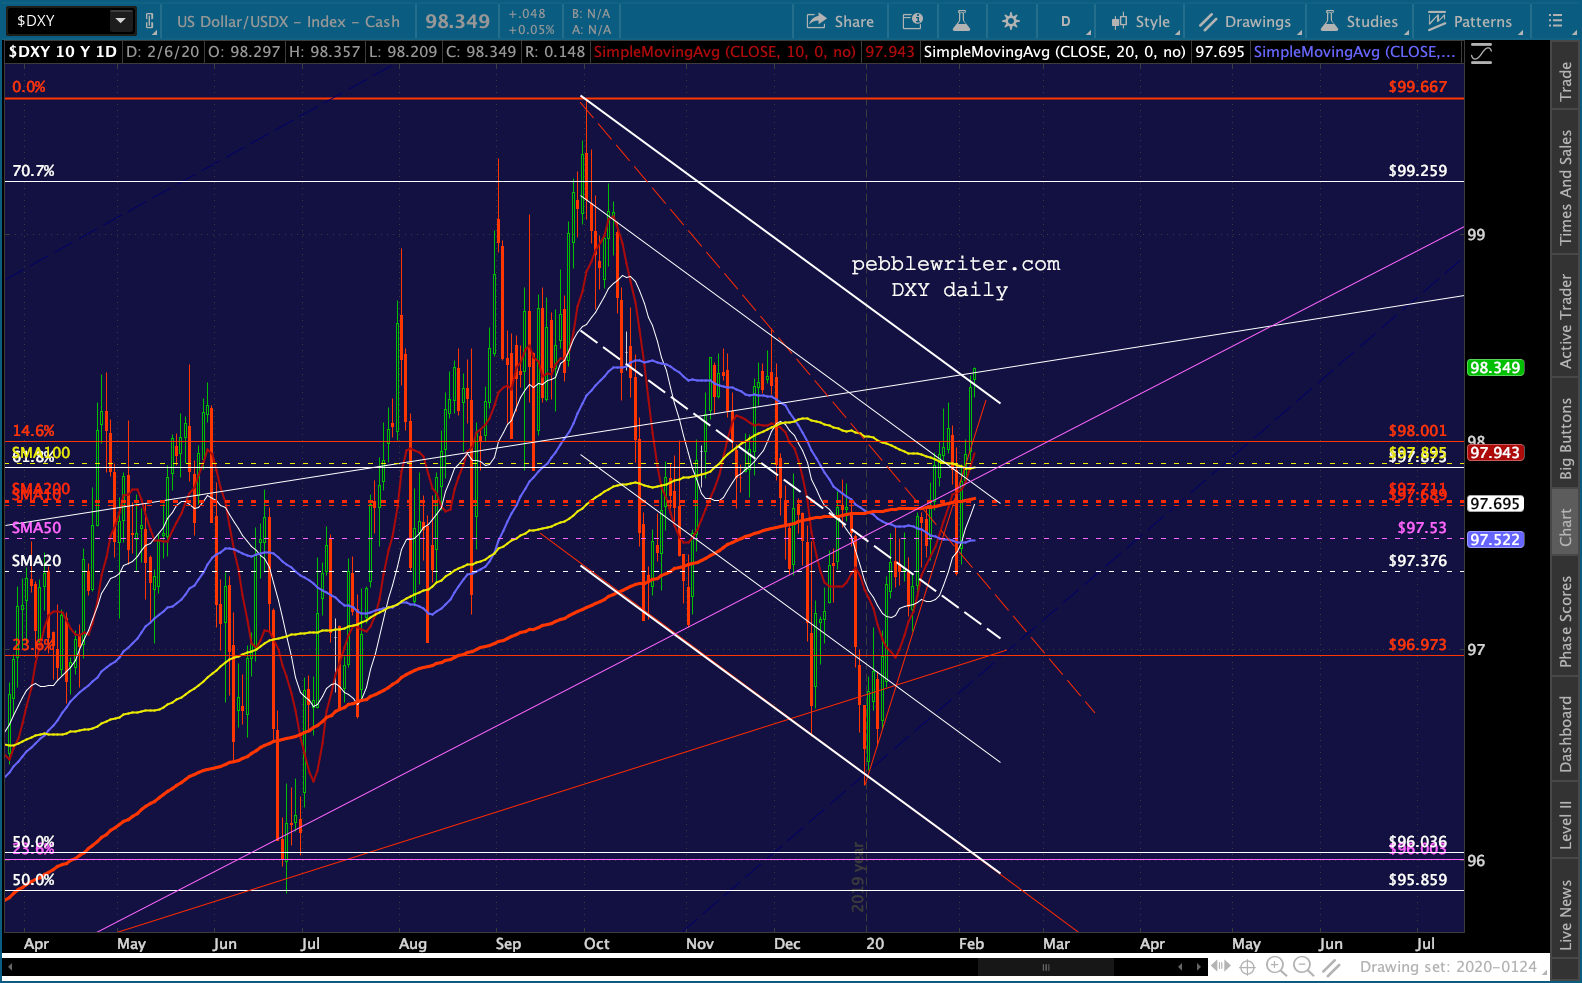 Also suggesting stocks have run out of steam: TNX has nearly closed the gap from Nov 1 at 1.7.
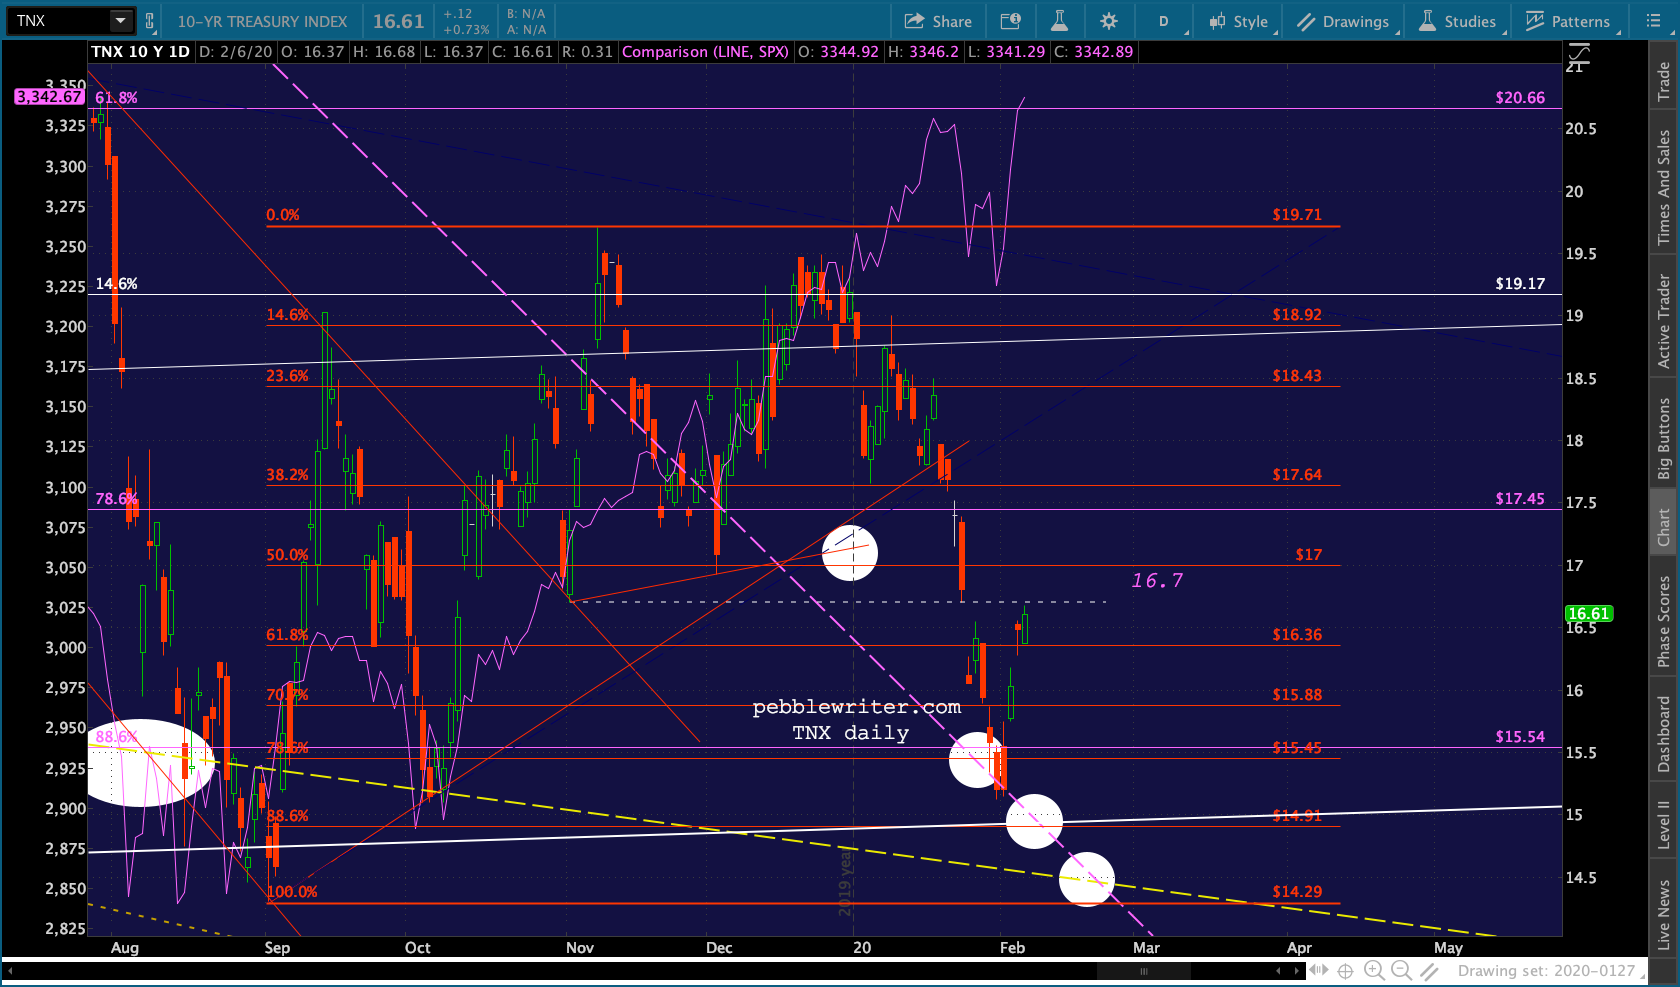 And, ZN has backtested the top of the white channel it recently broke out of again.
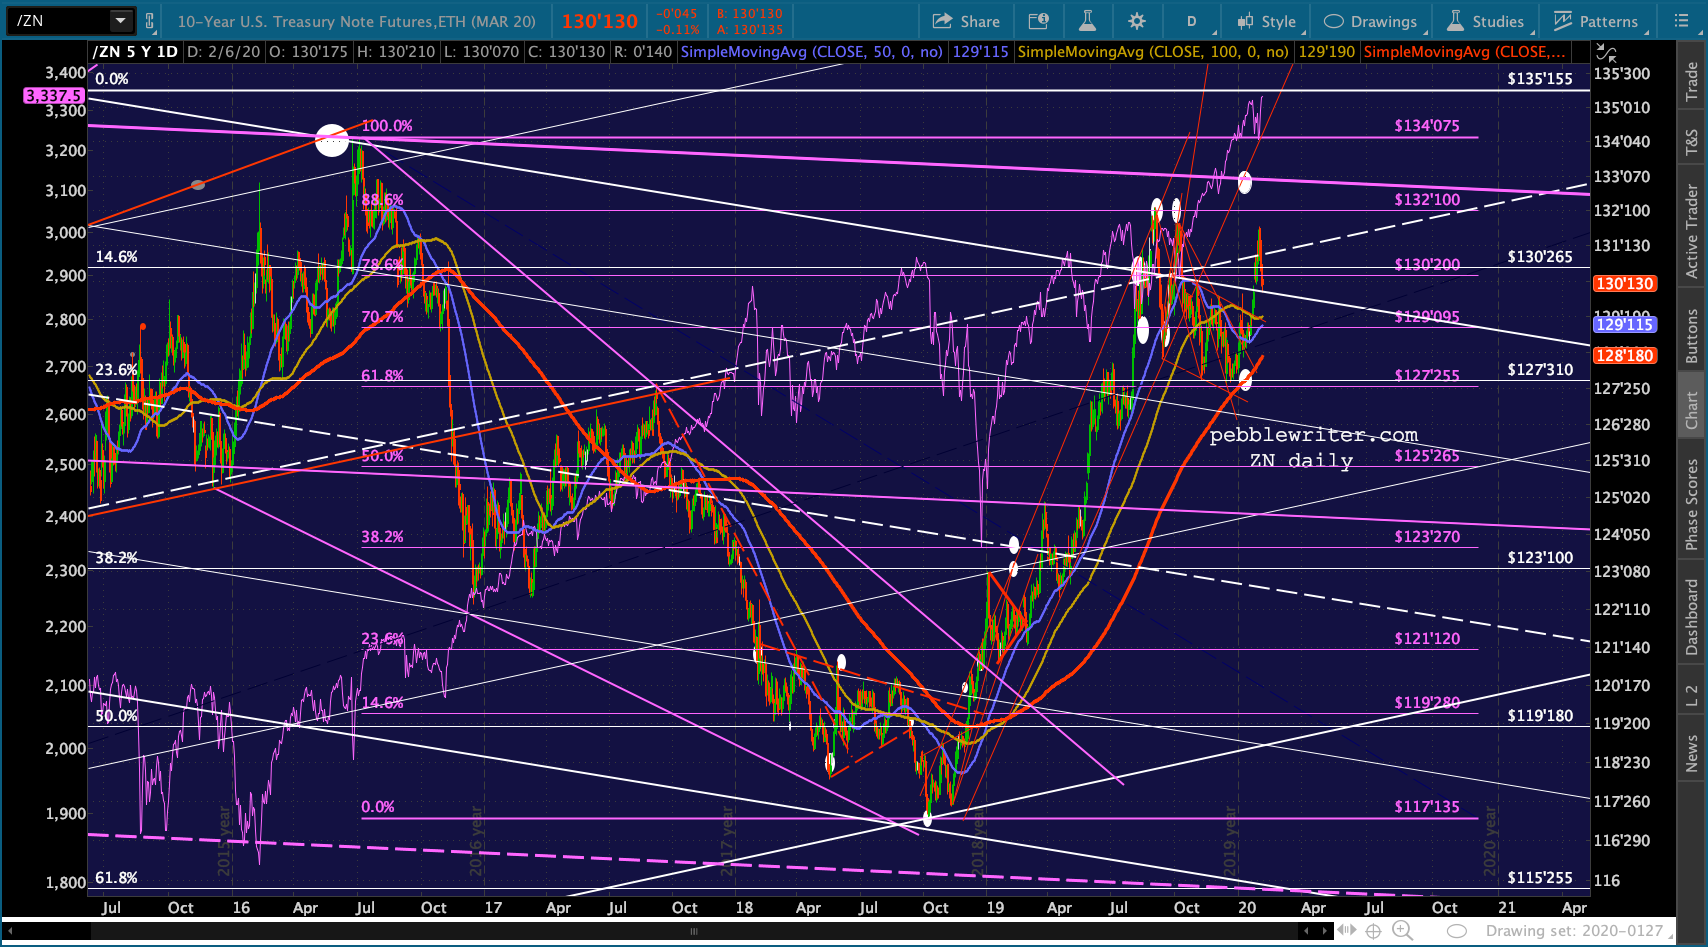 The 2Y is back above 1.4 at 1.443, which takes some of the pressure off stocks for the time being.
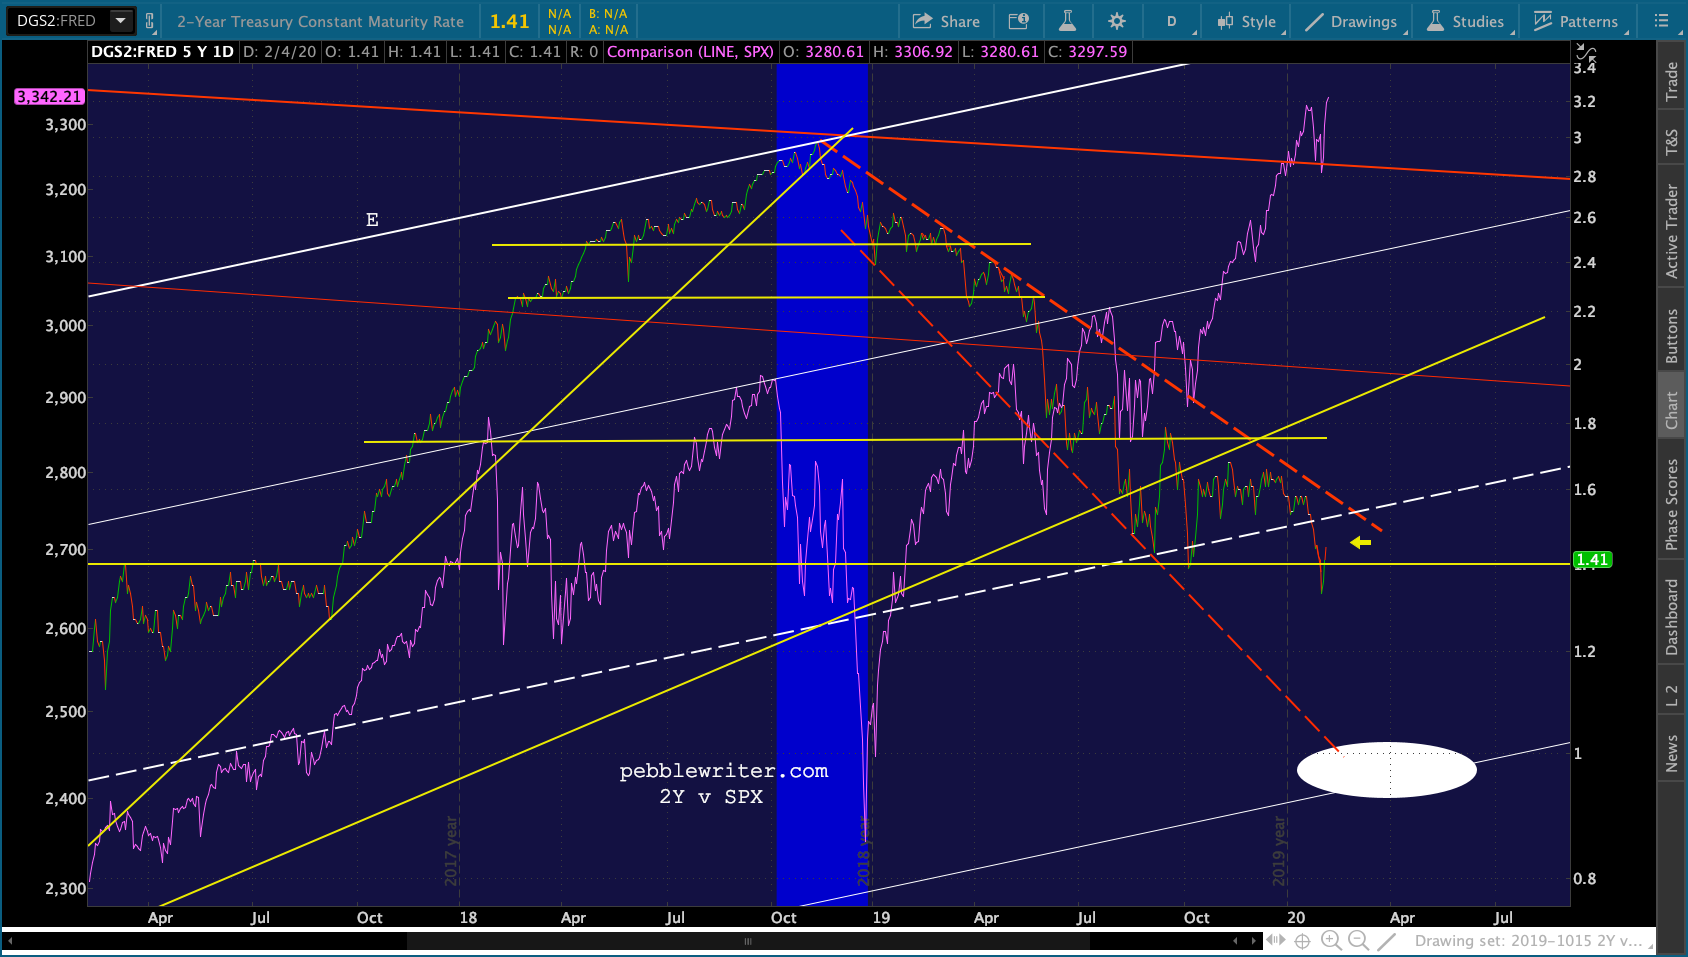 The 2s10s is also getting a bounce, but it has still broken down and faced significant resistance at .25.
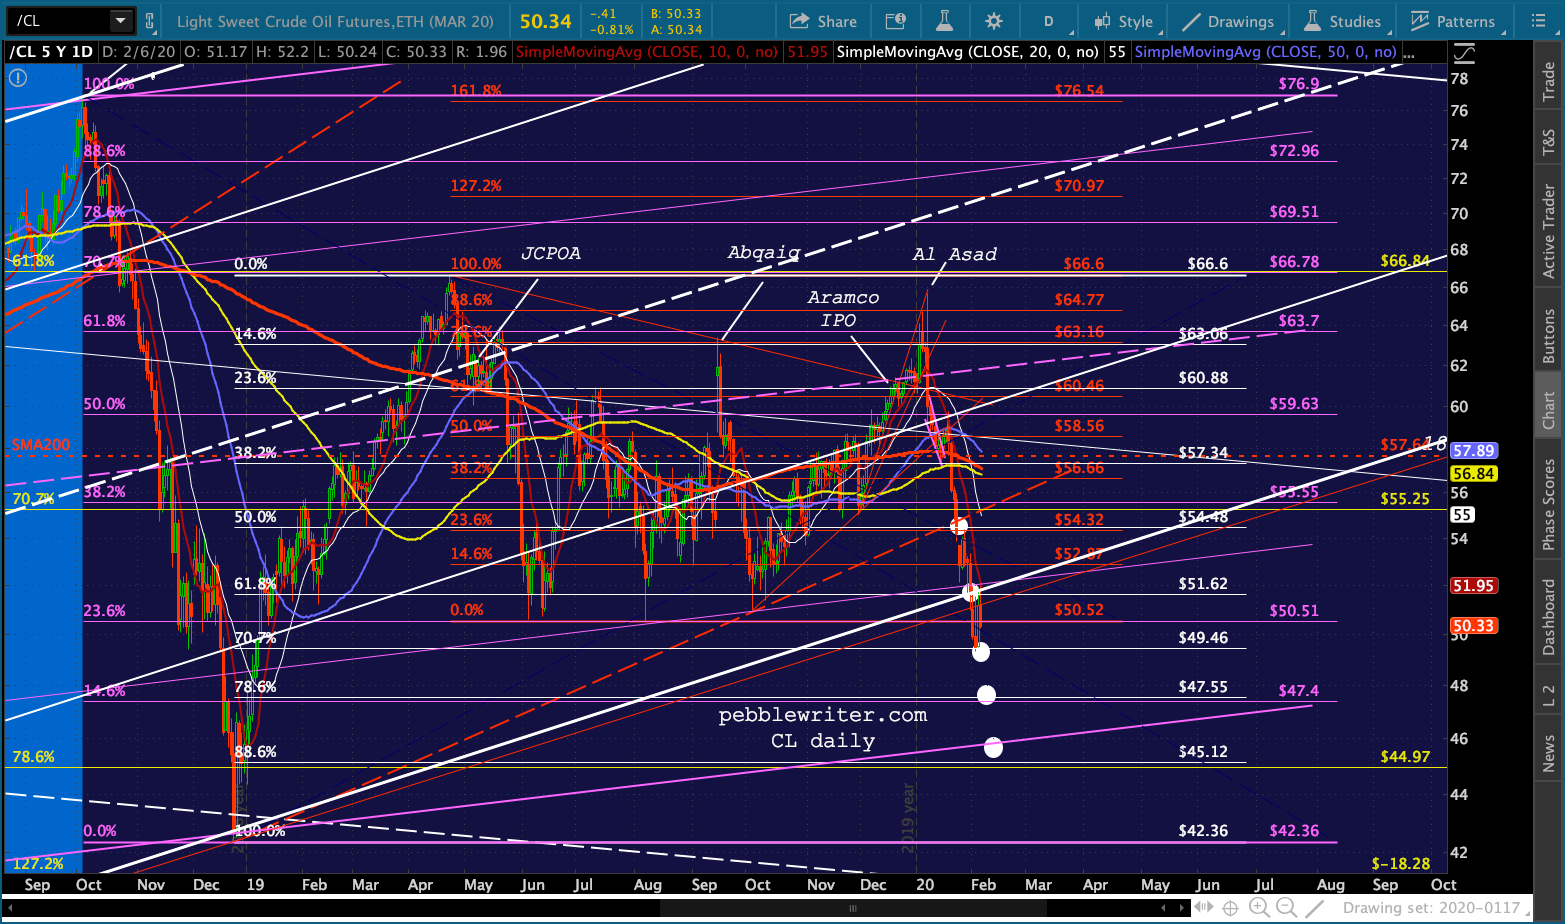
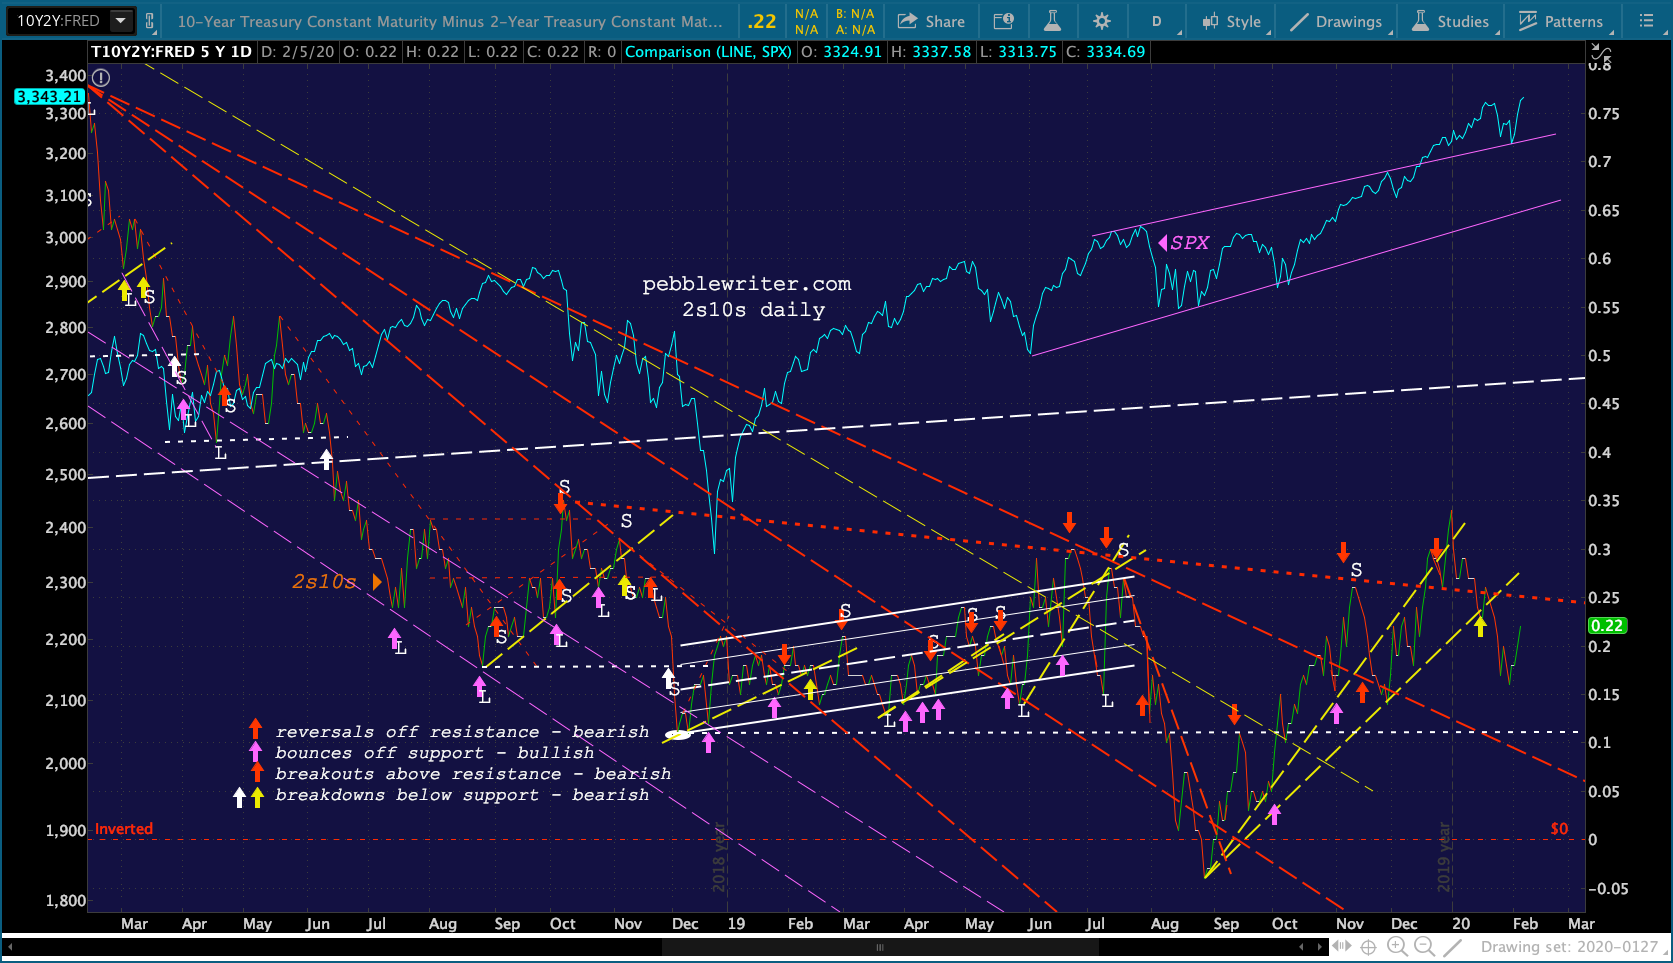 In the oil markets, CL got a nice bounce off our 49.46 target on 2/4, but ran into the SMA10 and a backtest of the white channel and is leaking lower.
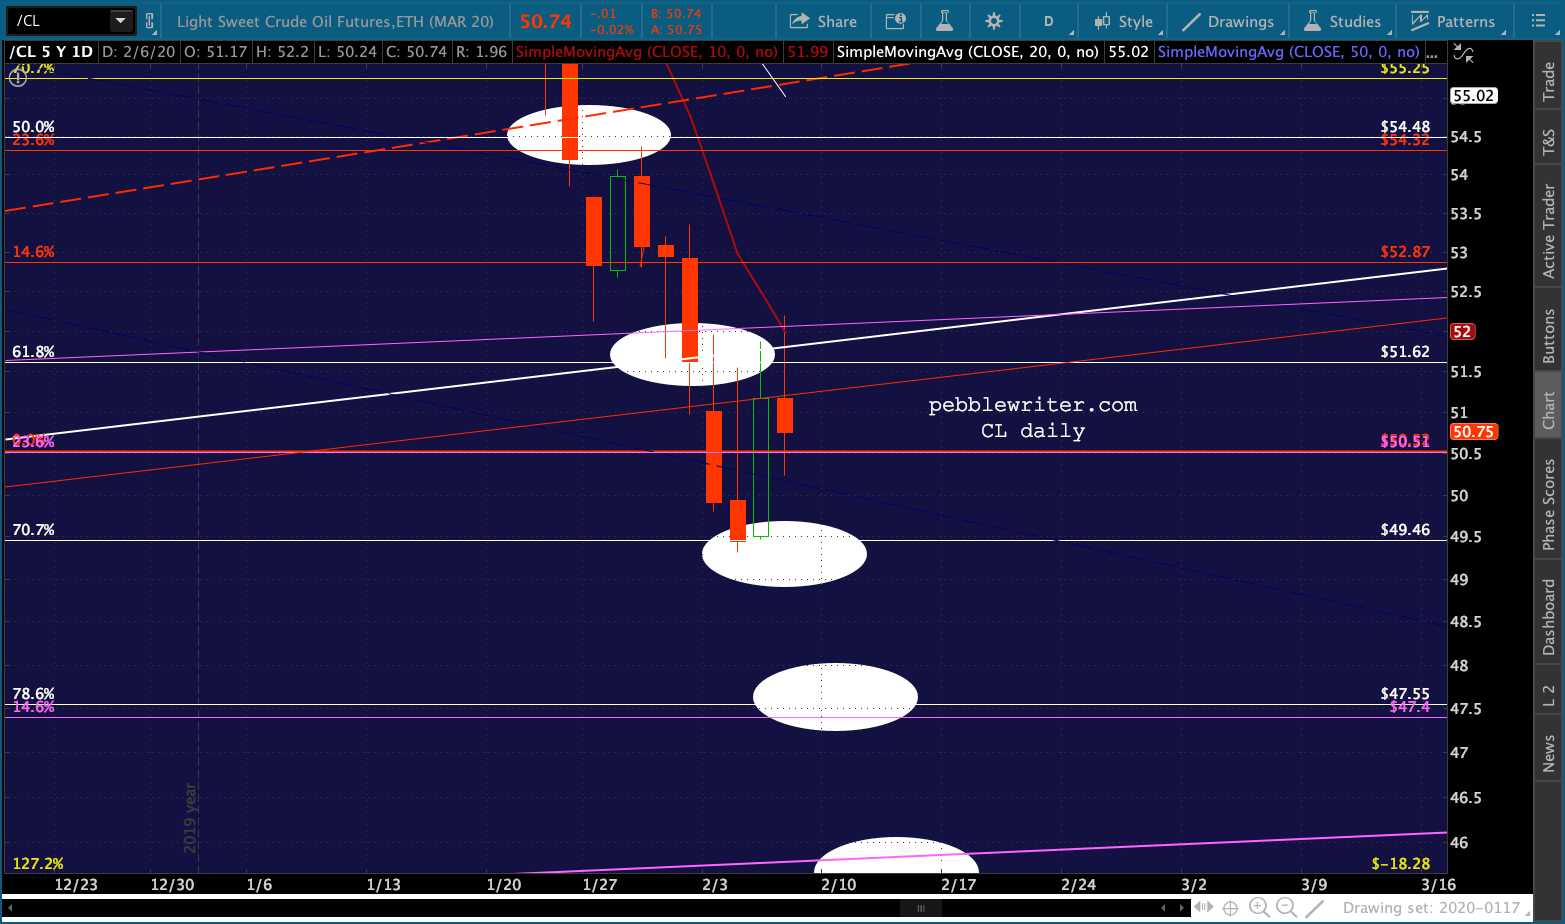
 RB is similarly backing off its SMA10, with our 1.4262 target still looking strong and a decent chance of an overshoot to 1.3513.
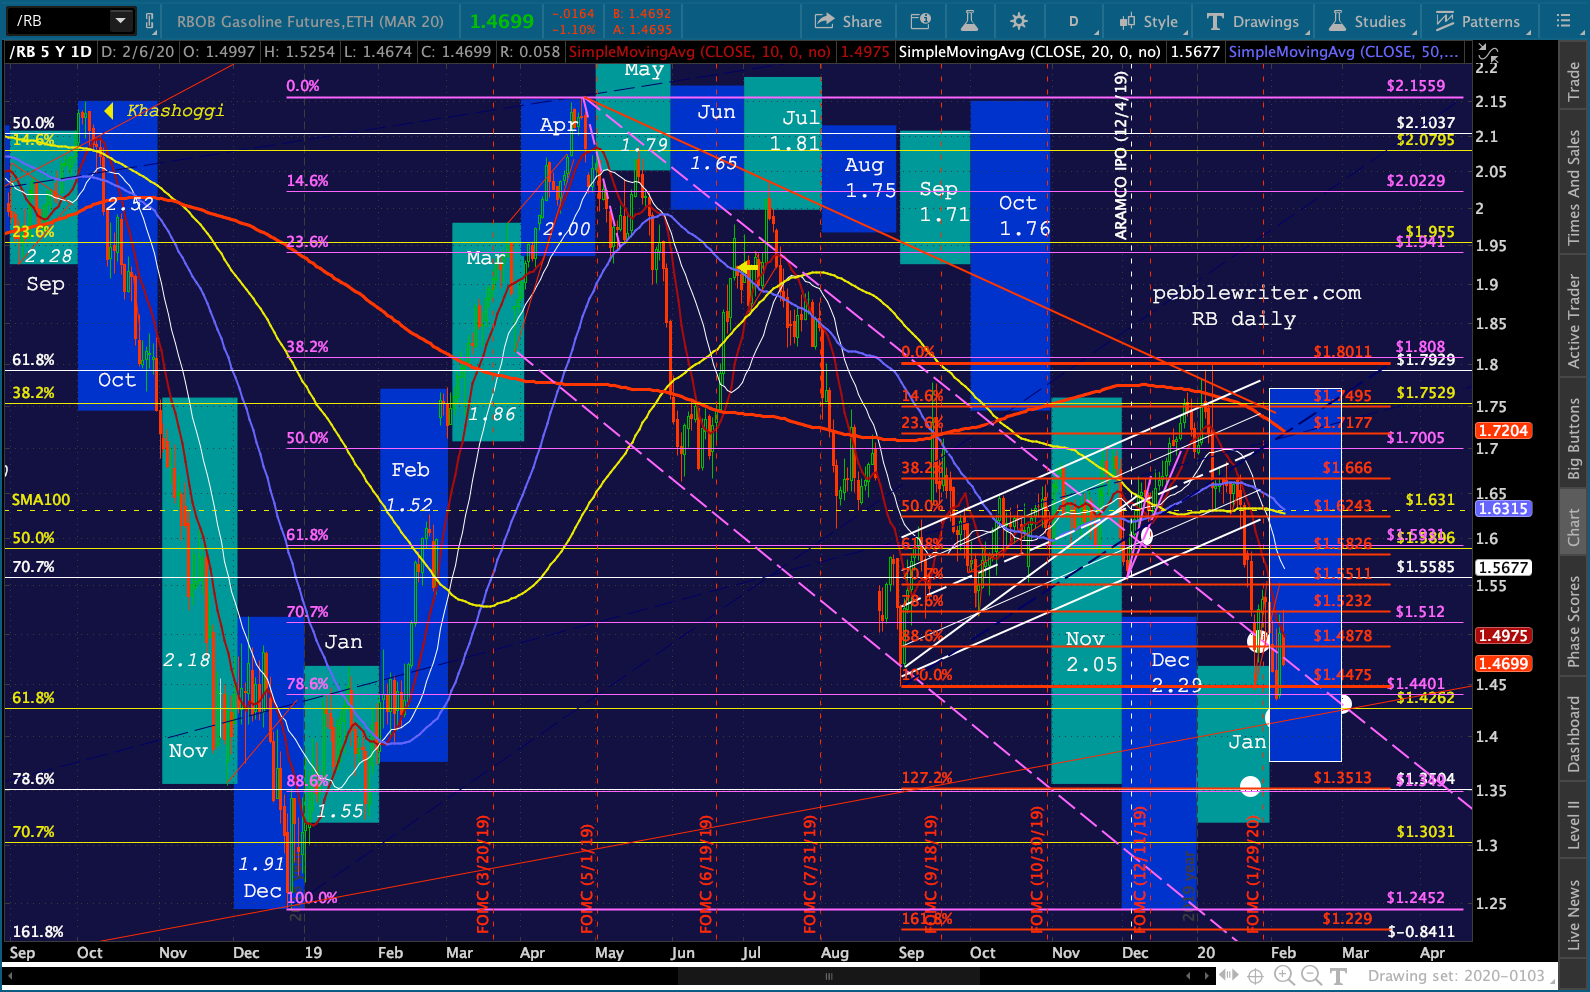 Now, for a very interesting chart. AAPL has obviously been on a tear lately – with some pretty crazy Fib and channel action. Looking at the RSI, though, we can see not only negative divergence but an breakdown of the rising TL from Jun 2019.
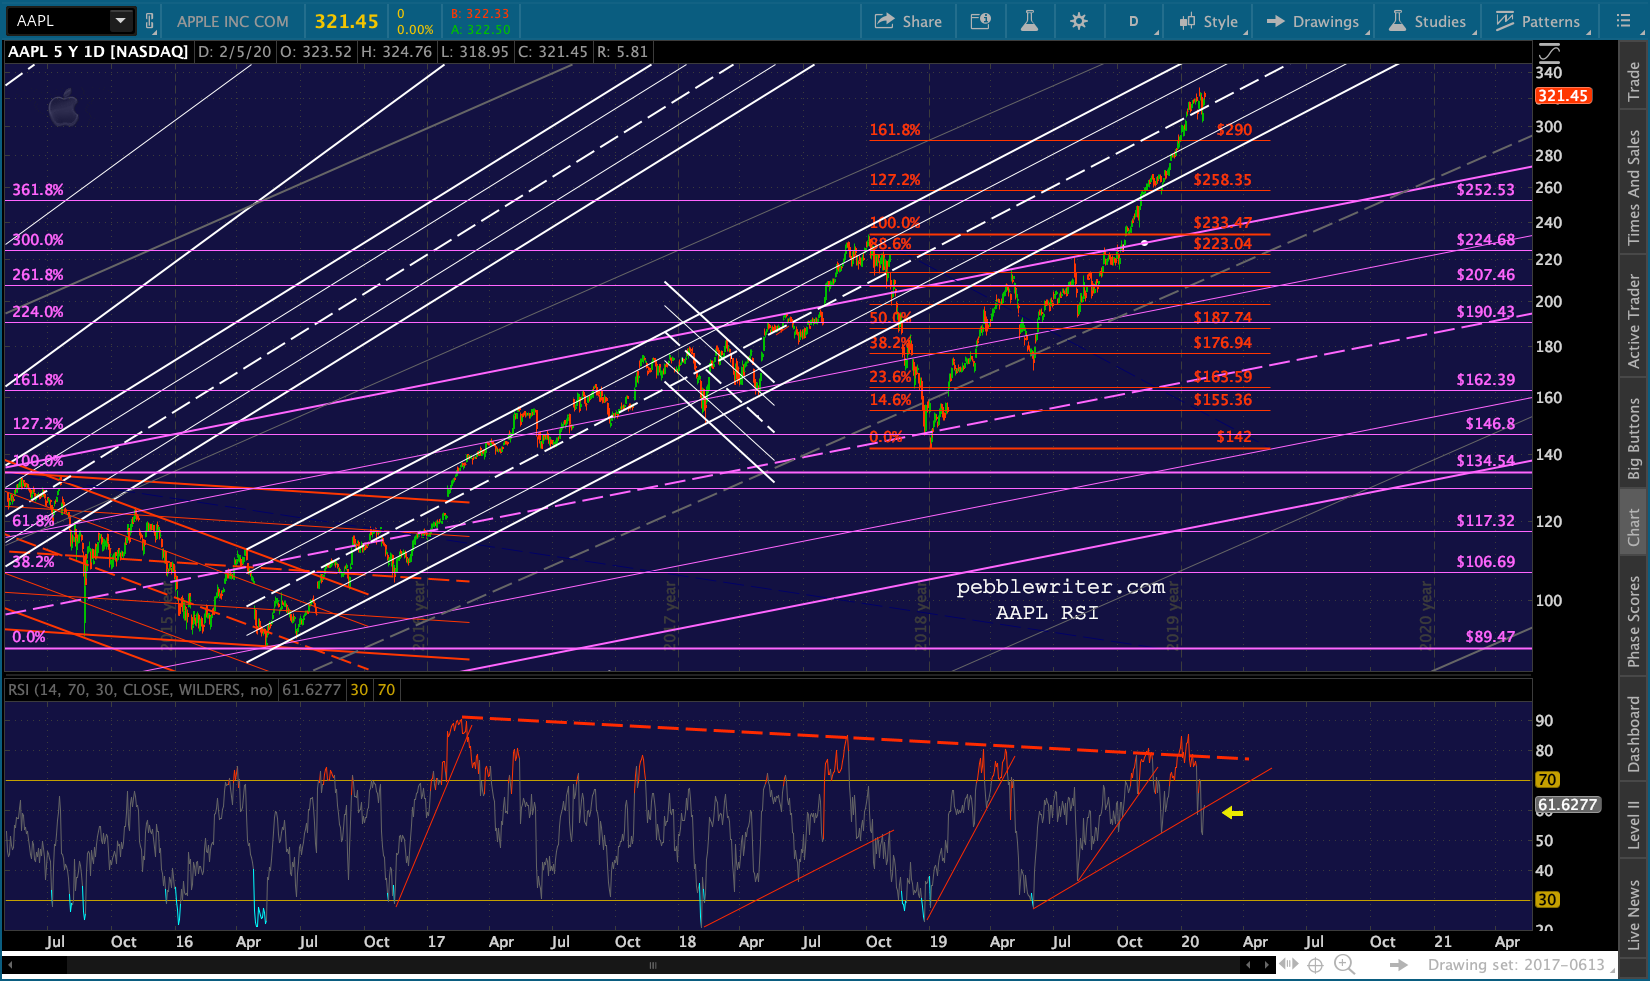 If it breaks back above that TL, then AAPL has more upside even with the negative divergence. But, there is much more downside potential, as the SMA200 has now reached the former high at 233.47, which would also permit a backtest of the purple channel top and a TL from the Jan lows. I would short AAPL here with relatively tight stops.
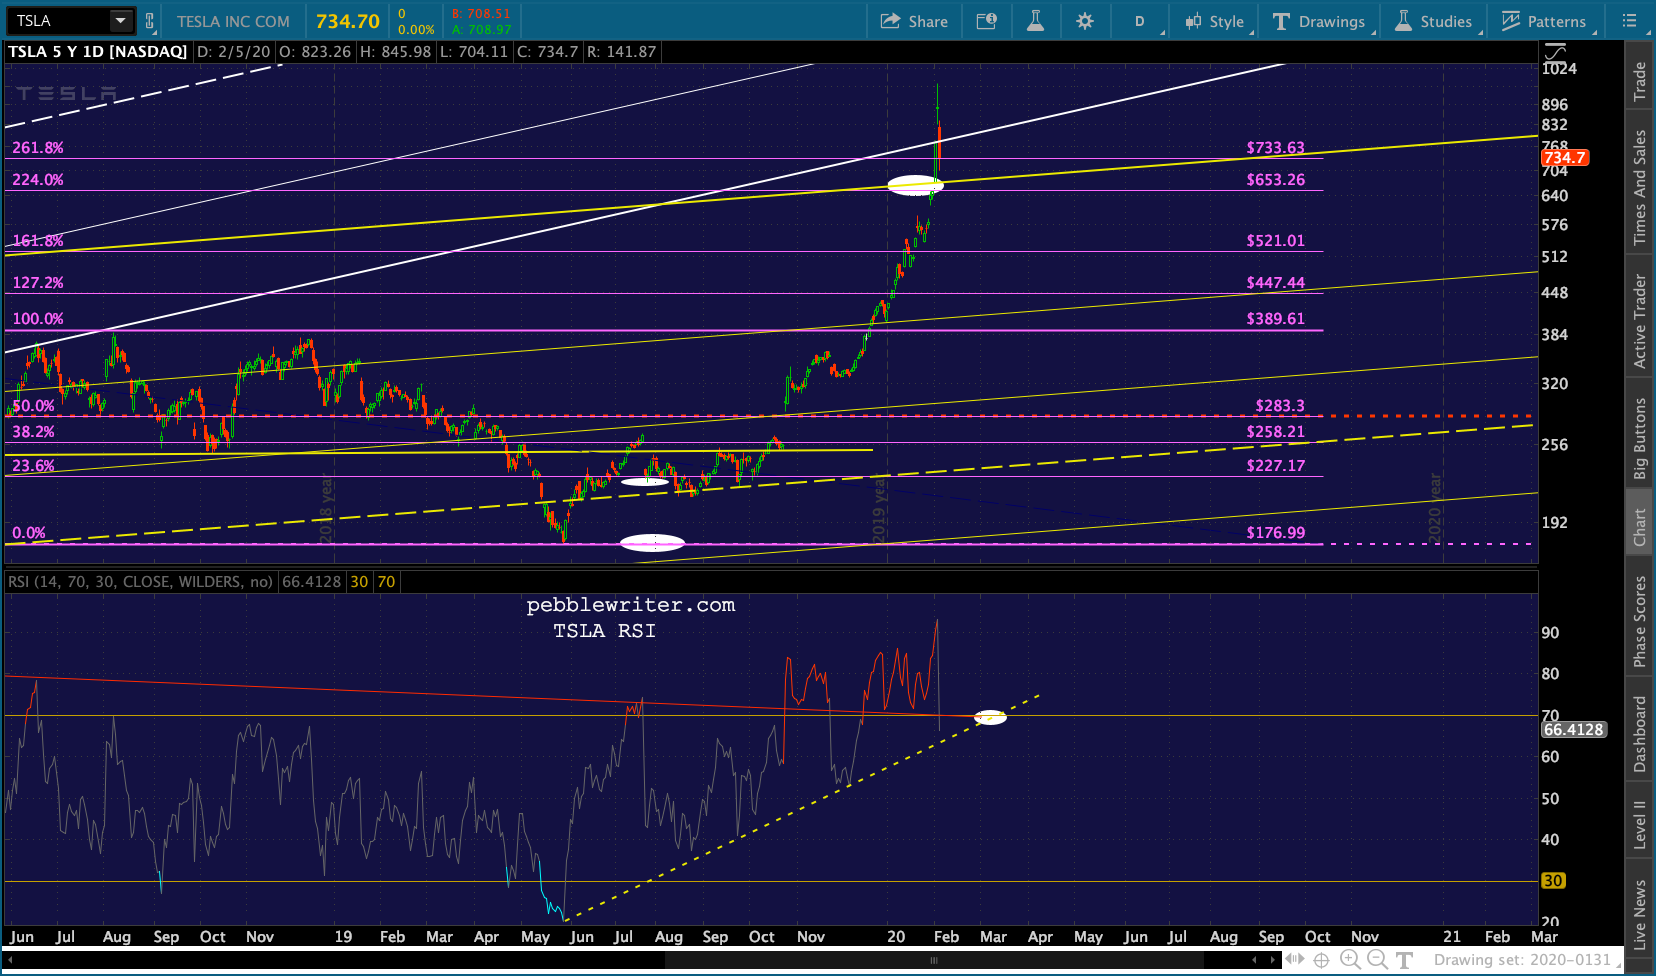
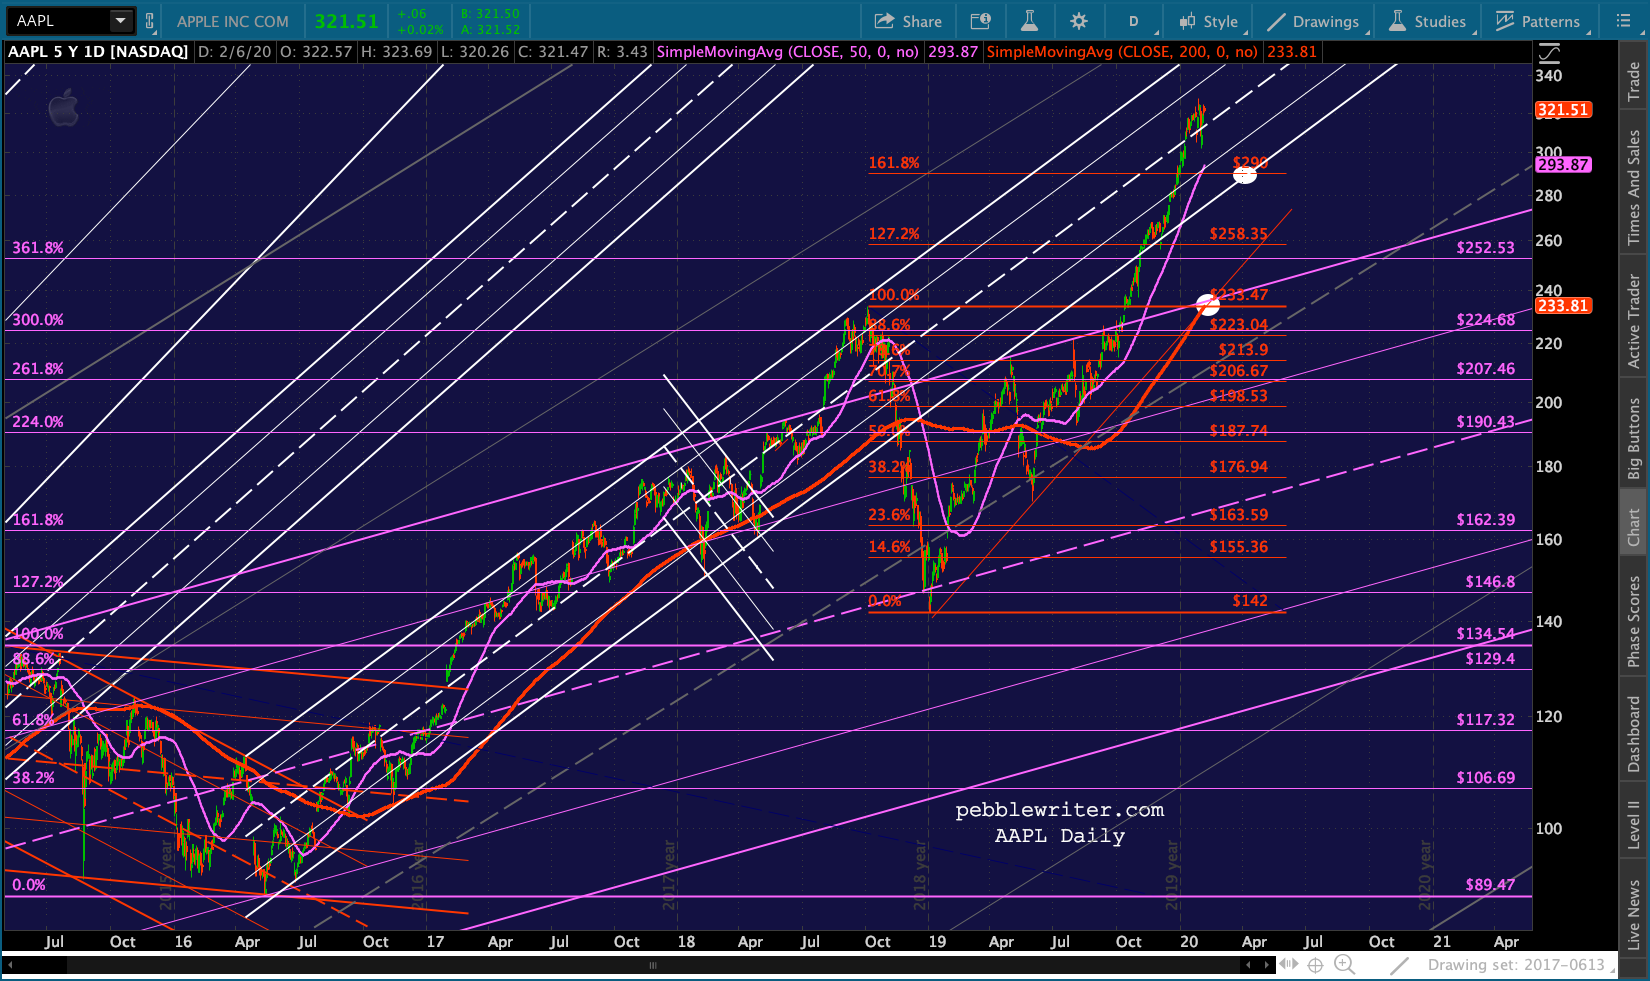 Last, TSLA saw a ridiculous short-covering rip over the last few days. The spurt was due to a breakout of the yellow channel top at the 2.24 Fib extension. It is now backtesting those levels of previous resistance (now support)…
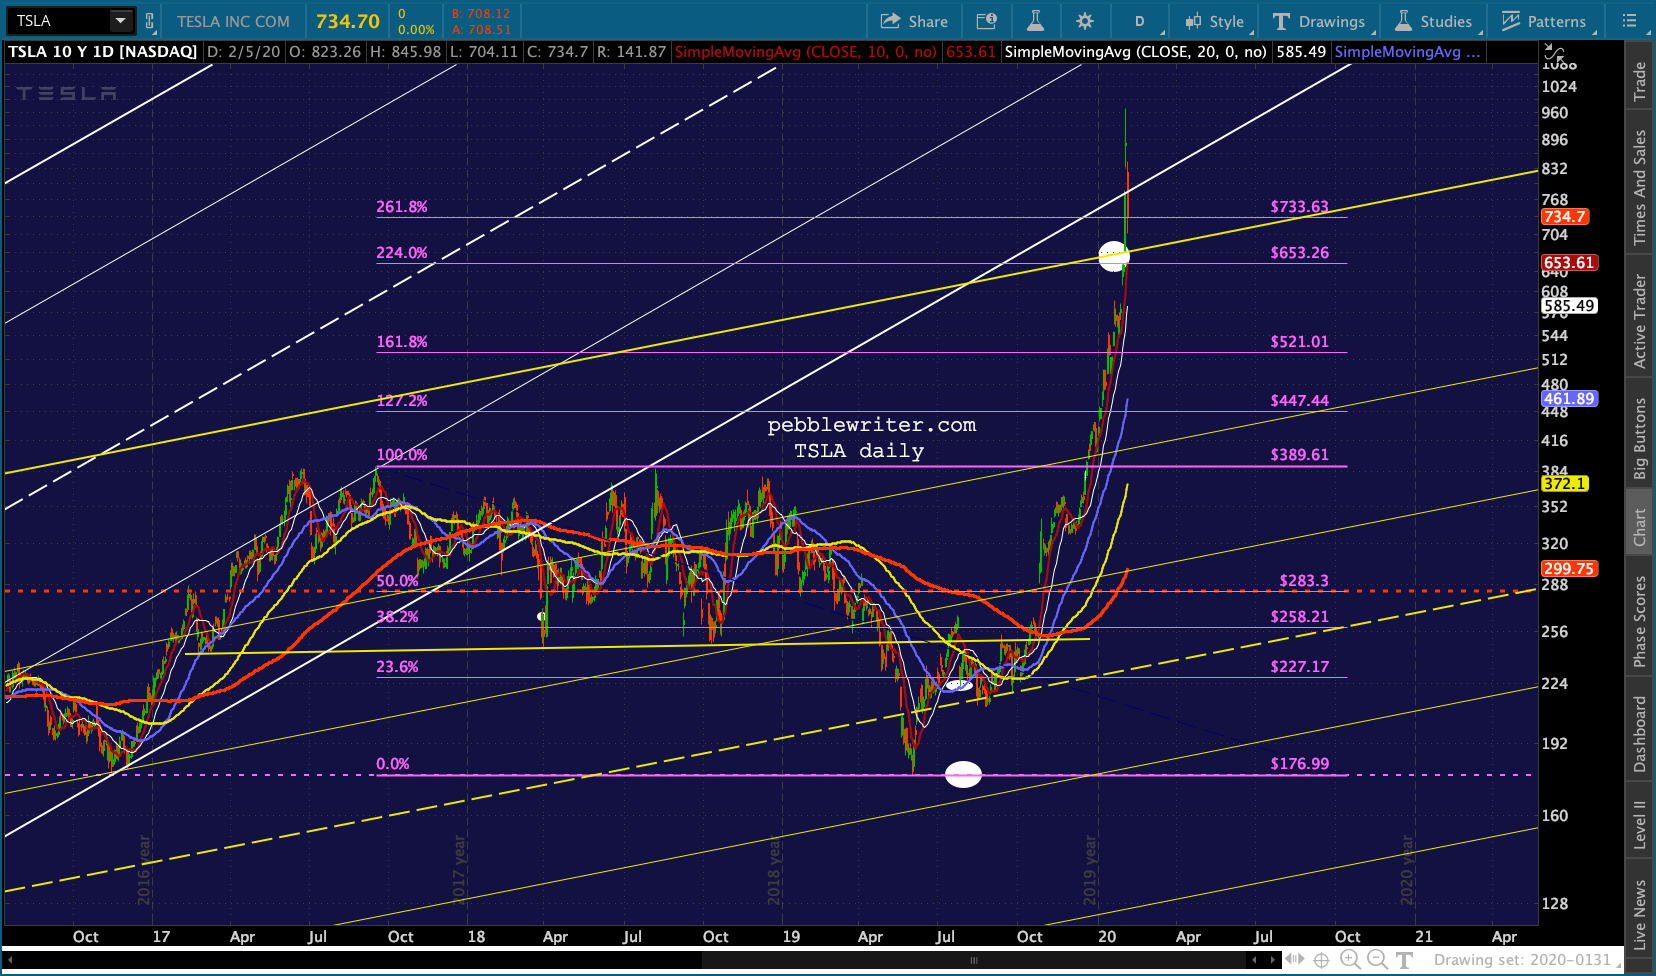 …and its RSI is barely hanging on to TL support. Its SMA10 is now up to 705 – right at the channel top. If TSLA should break below it, watch out. It could be quite a tumble.