

The USDJPY and NKD ramped back to .886 retraces of their previous highs (suggesting a reversal here), but ES has only managed a slight gain overnight.

This begs the question of whether we’ll get some follow-through from yesterday. I think so.
continued for members...
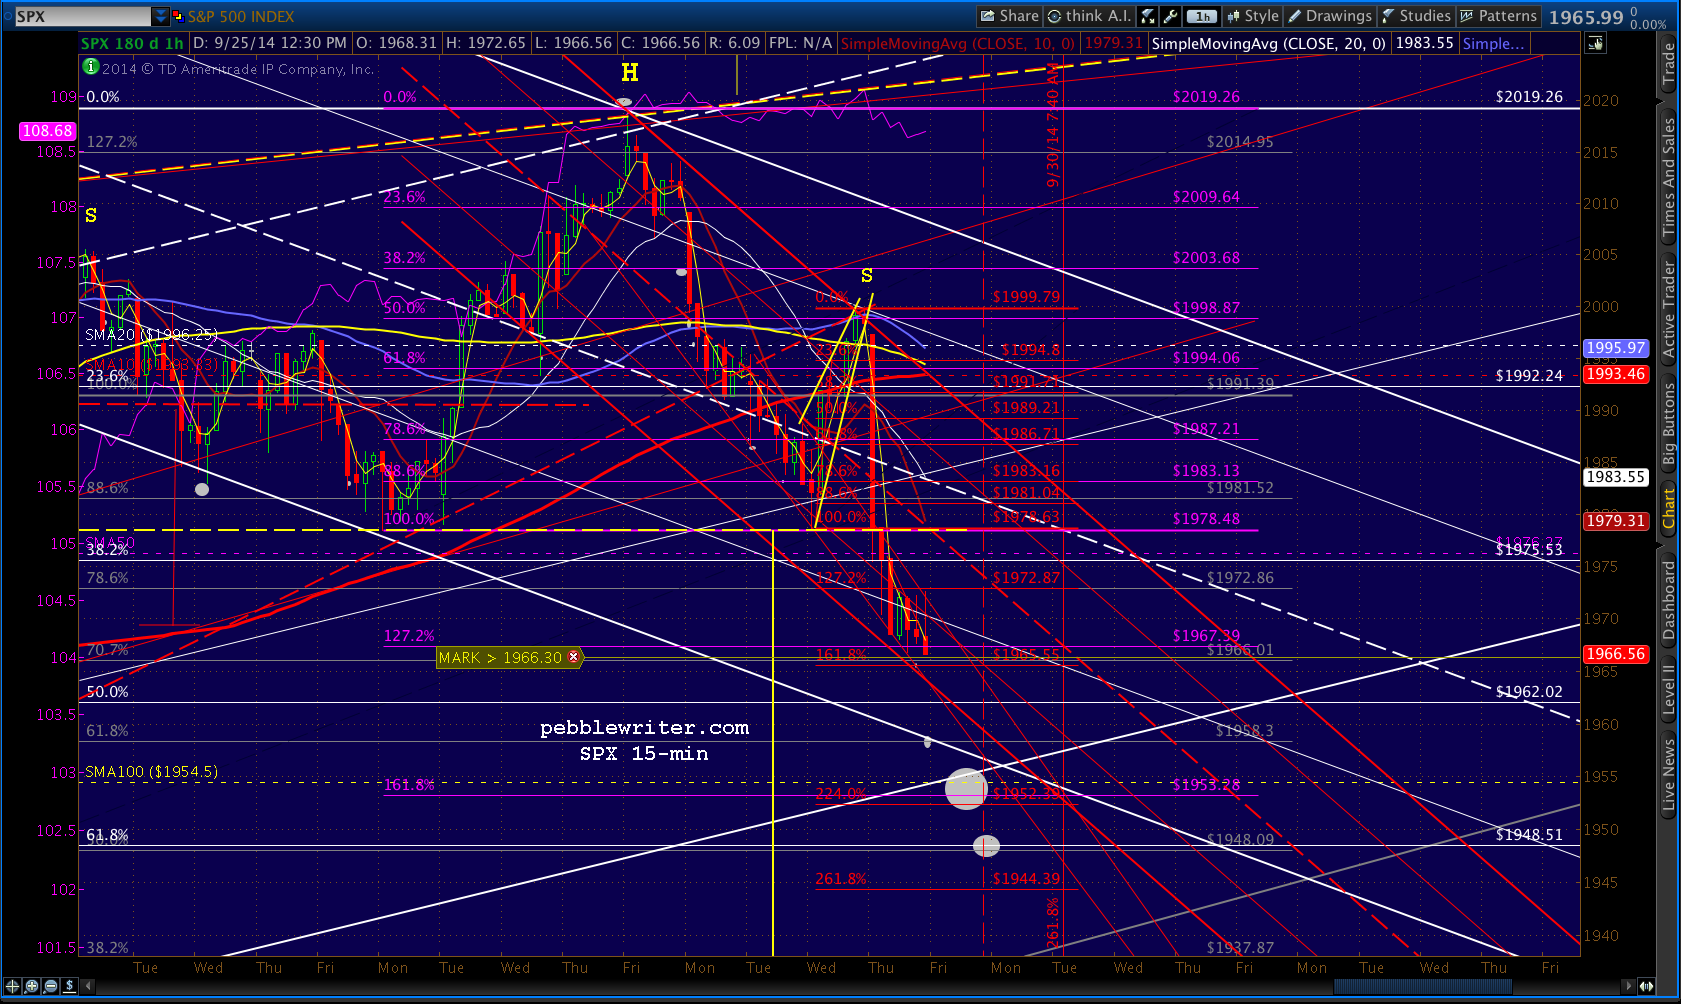
ES and SPX charts both suggest more downside (though I’m a little flummoxed by the 10-yr.) Note that both completed — and ES backtested — a H&S pattern that targets 1937 on SPX and 1922 on ES. But, remember, H&S Patterns have woefully underperformed over the past year – especially big ones.
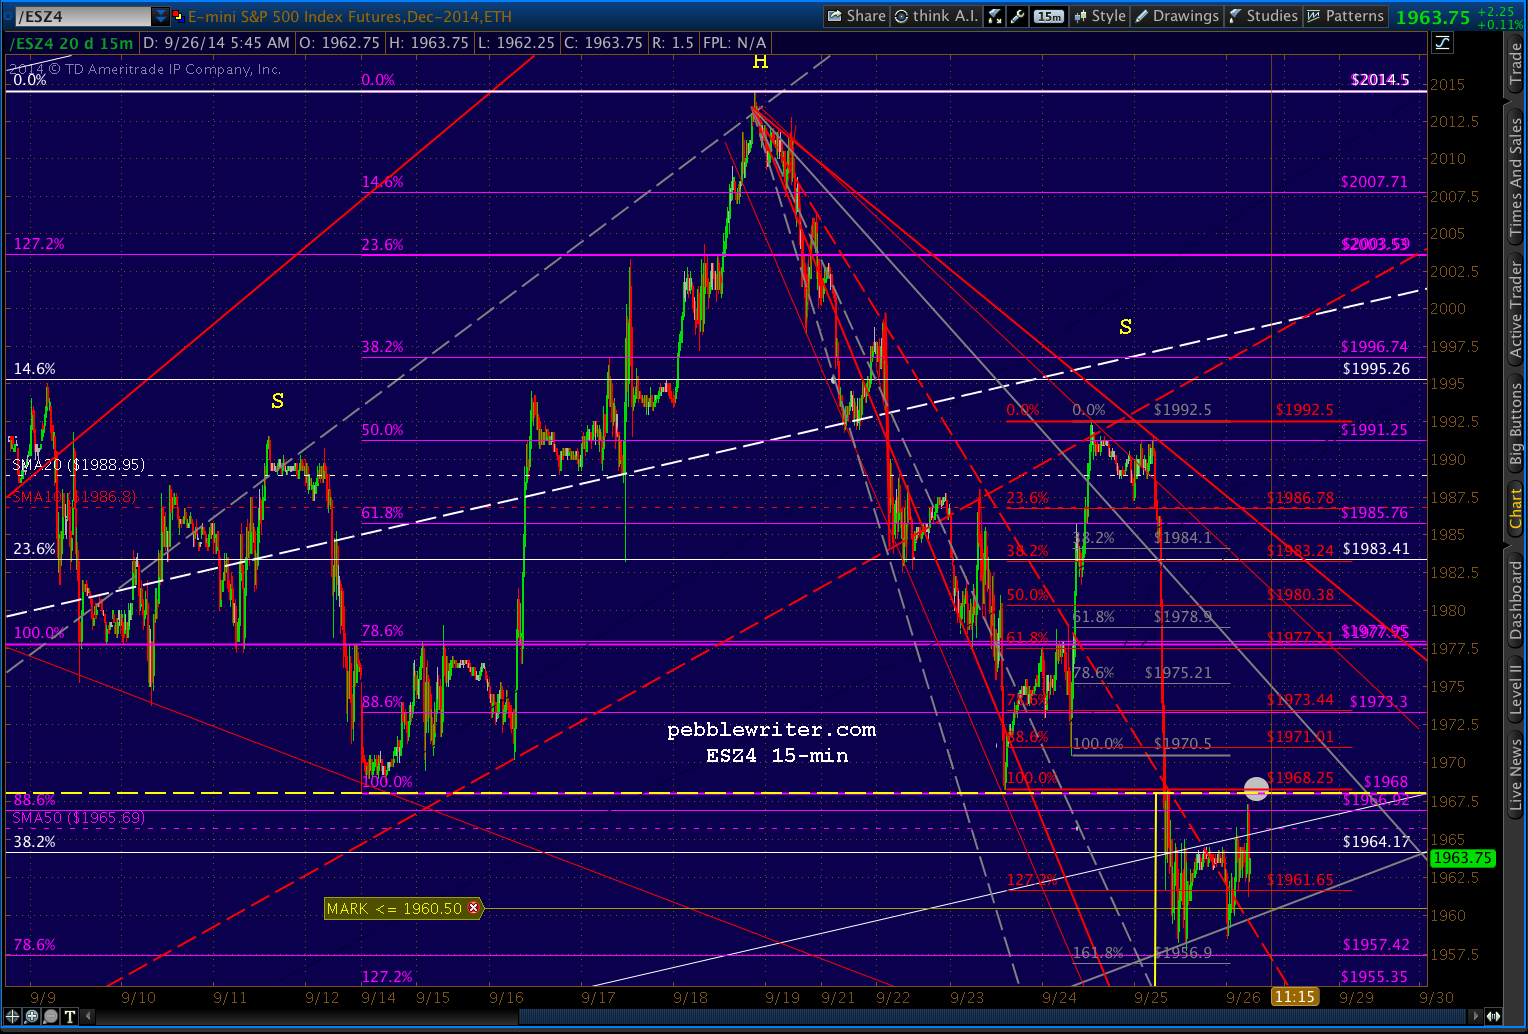
If we get follow-through today, I expect it will be about reaching the SMA100 — 1954.50 for SPX. It would tag the bottom of the rising white channel that connects the Jun and Oct 2013 lows with the Feb and Aug 2014 lows — a pretty good line of support.
Re the 10-yr, it reached our target of the SMA50, but reversed there and appears headed for the SMA100 again. Rates almost reached our 2.495% target overnight — dropping as low as 2.497 before reversing hard in the after hours. So, I’m a little concerned about how this affects our downside case. Maybe another strong plunge later in the day? Not sure. I’d keep an eye on USDJPY and NKD and VIX — which is at an inflection point that could result in a pop to 17.2 or 19.08, or down to 15.15.
GLTA.