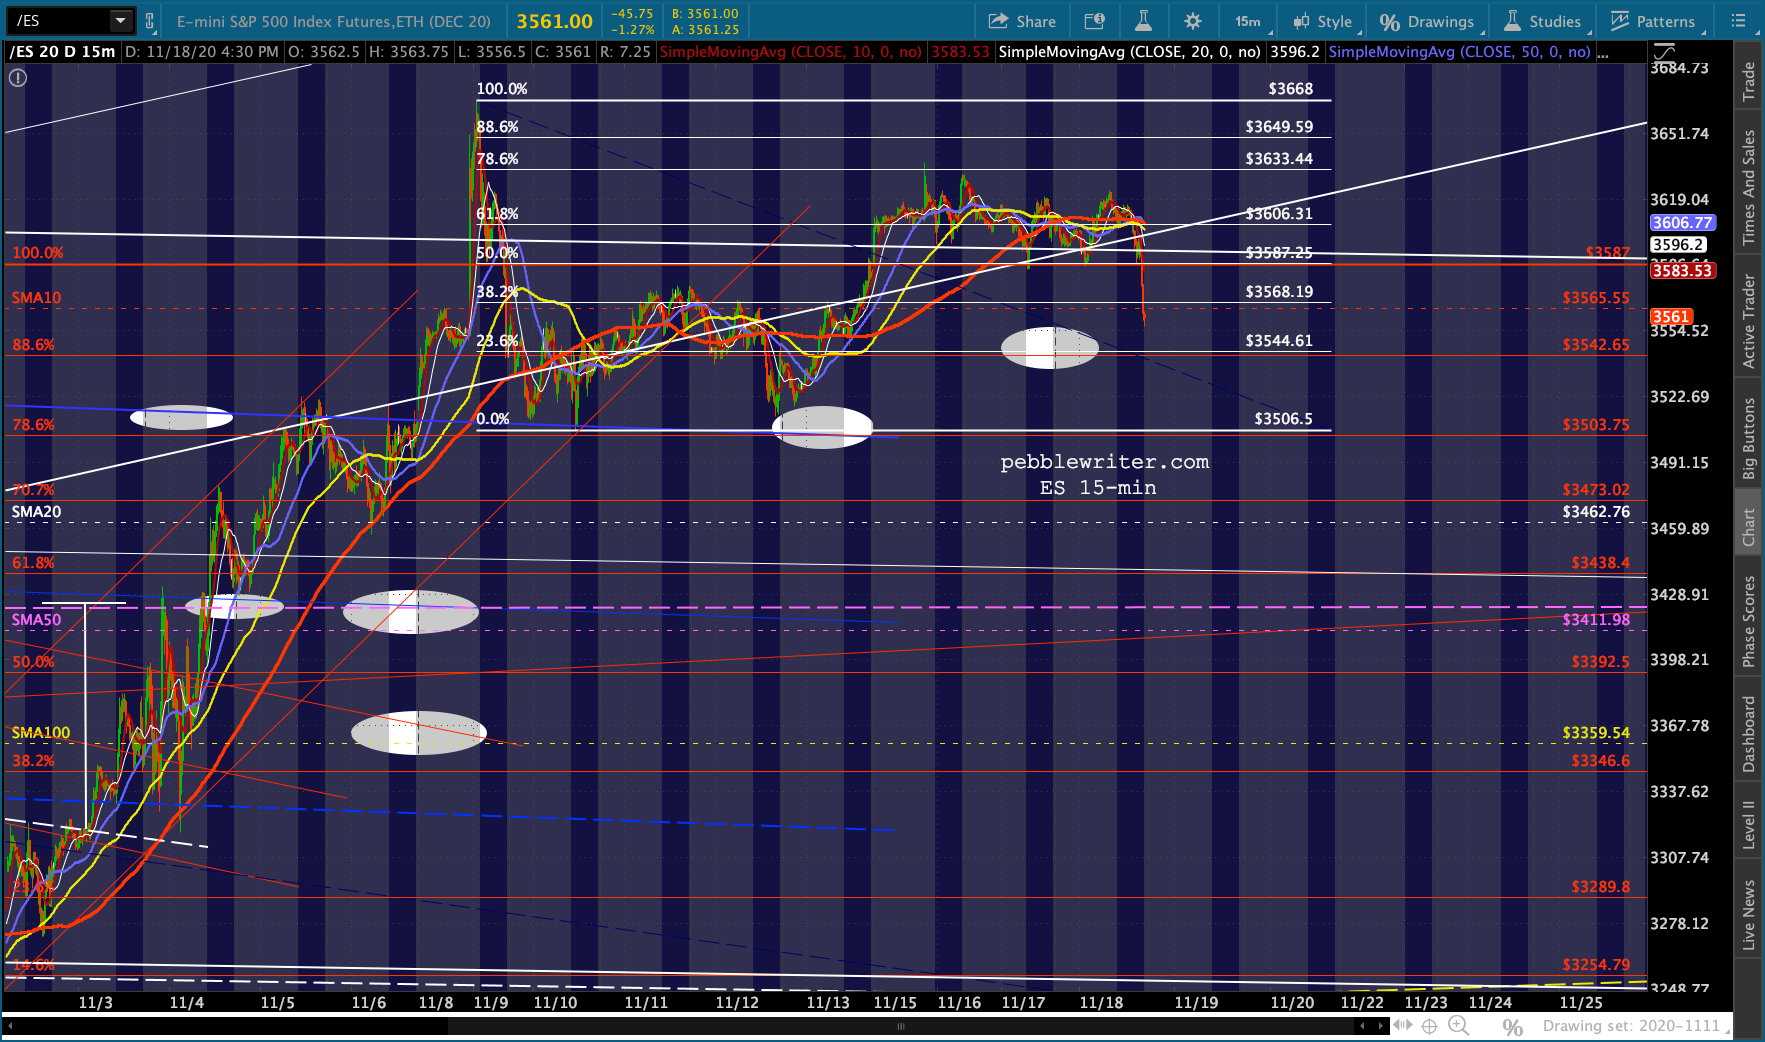
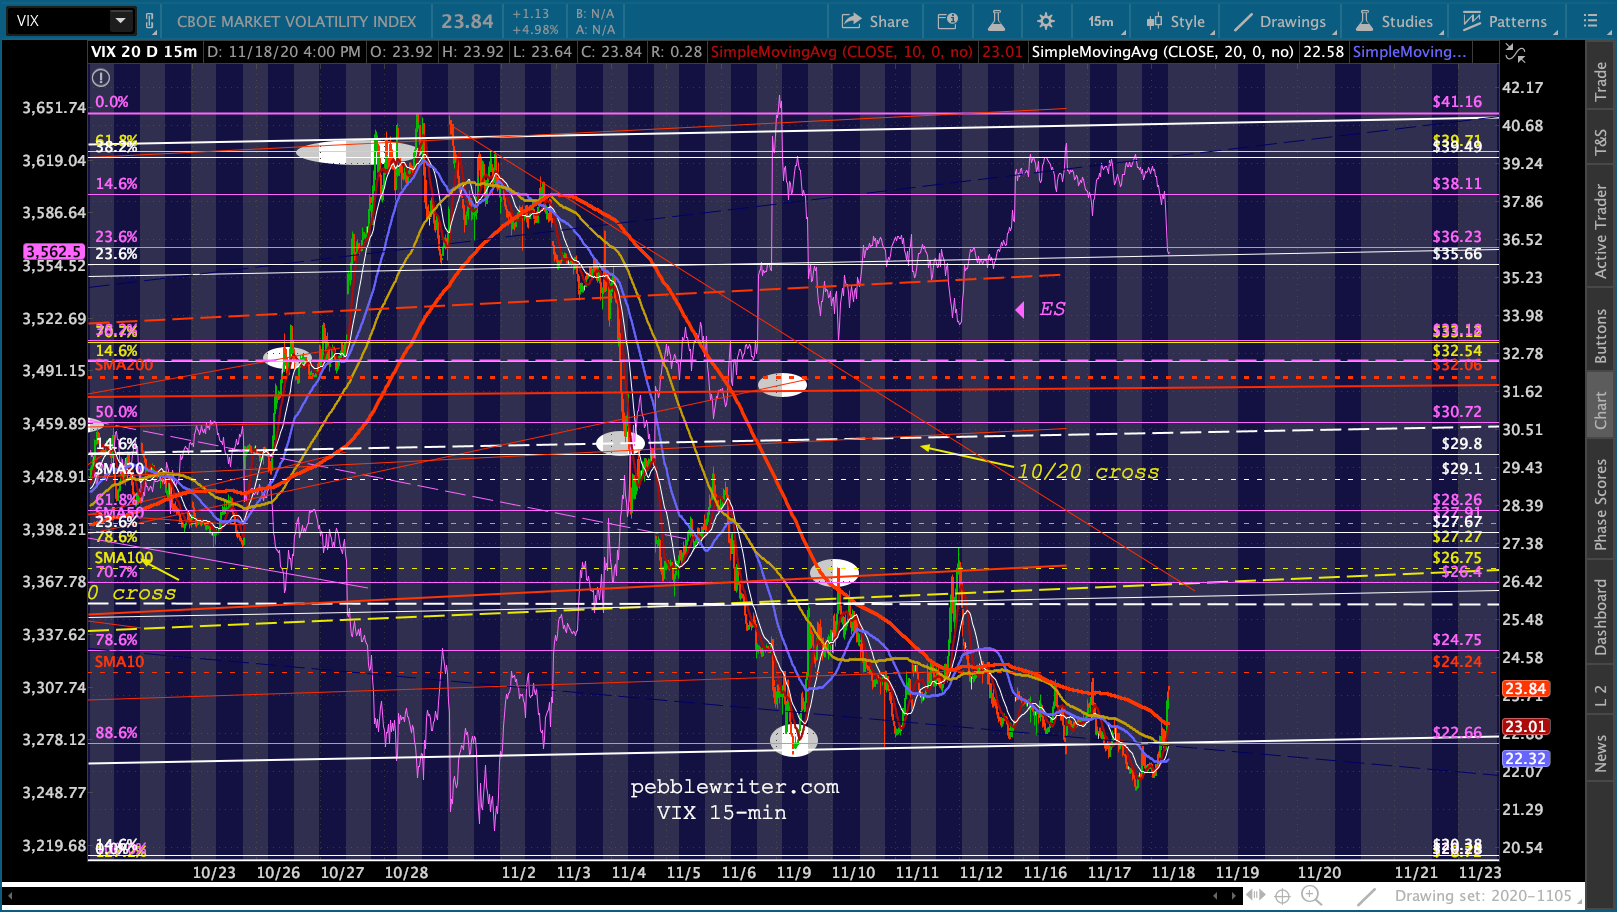
Today’s levitation is brought to you by VIX which, by plunging below its Fibonacci .886 retracement at 22.66, has once again convinced the algos that it’s a wonderful time to buy stocks.  Of course, that was in the low-volume pre-market. Carbon-based investors trading in the regular session don’t always agree.
 Meanwhile, the financial press (and the politicians) are focused on getting the meaningless DJIA up to 30,000.
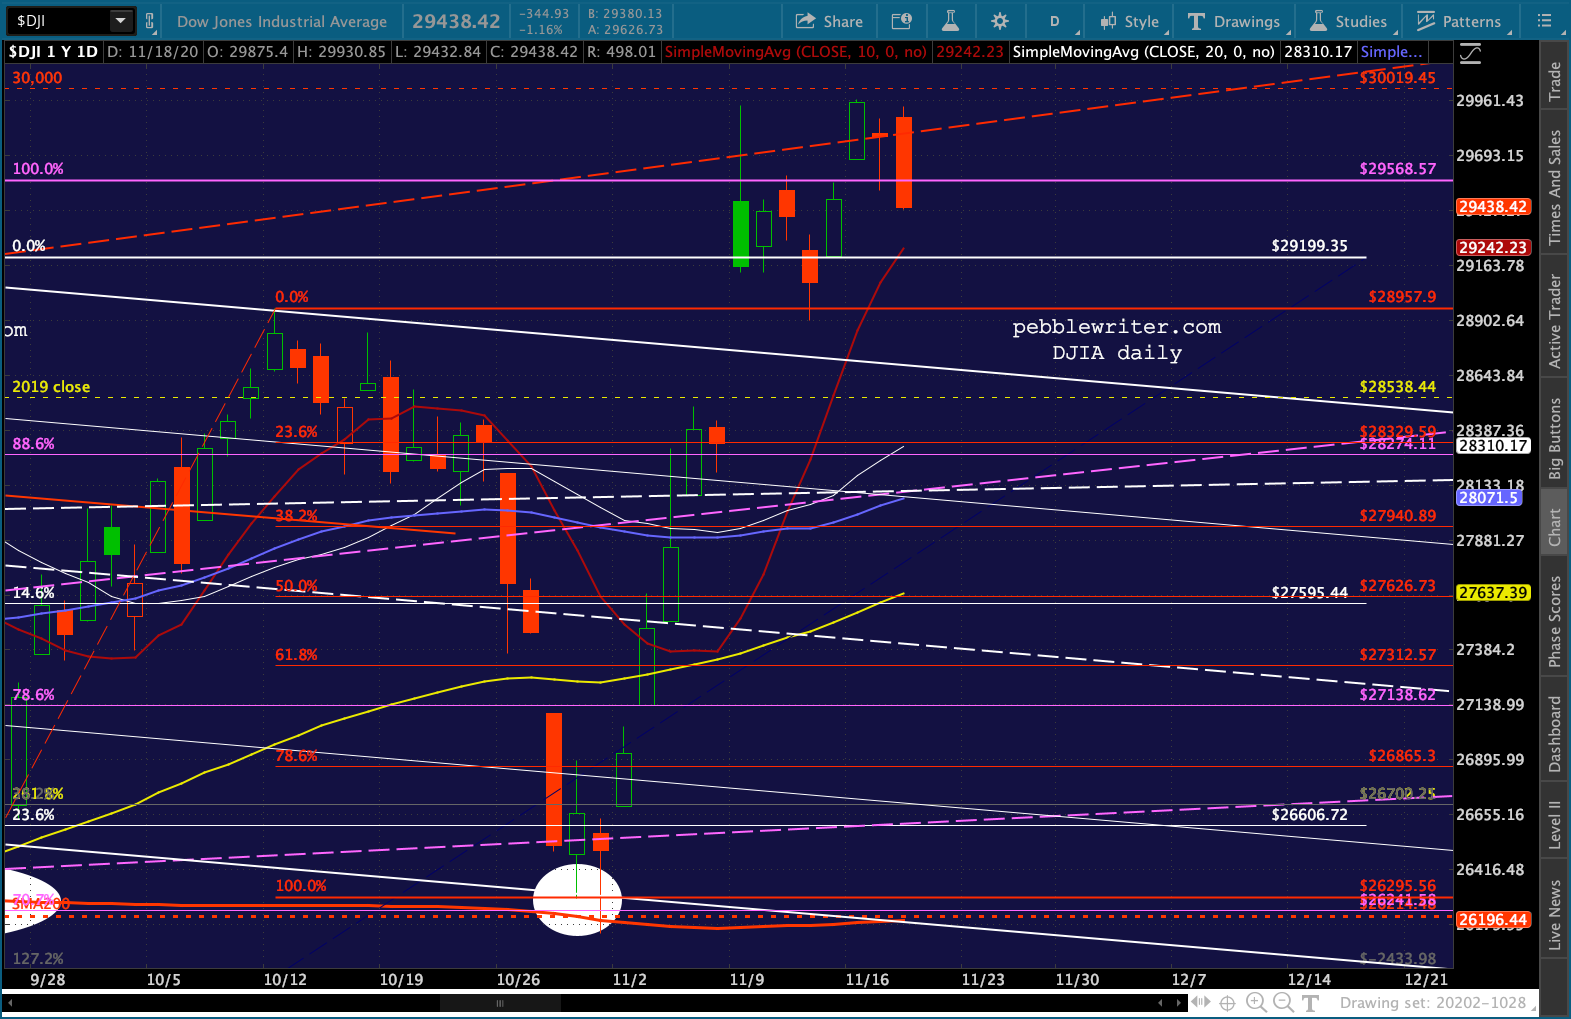
continued for members…A closer look at VIX shows that it is sneaking back toward that .886. If the bump continues beyond a backtest, it means that bagging DJIA 30000 is the goal and that stocks will be allowed to decline thereafter.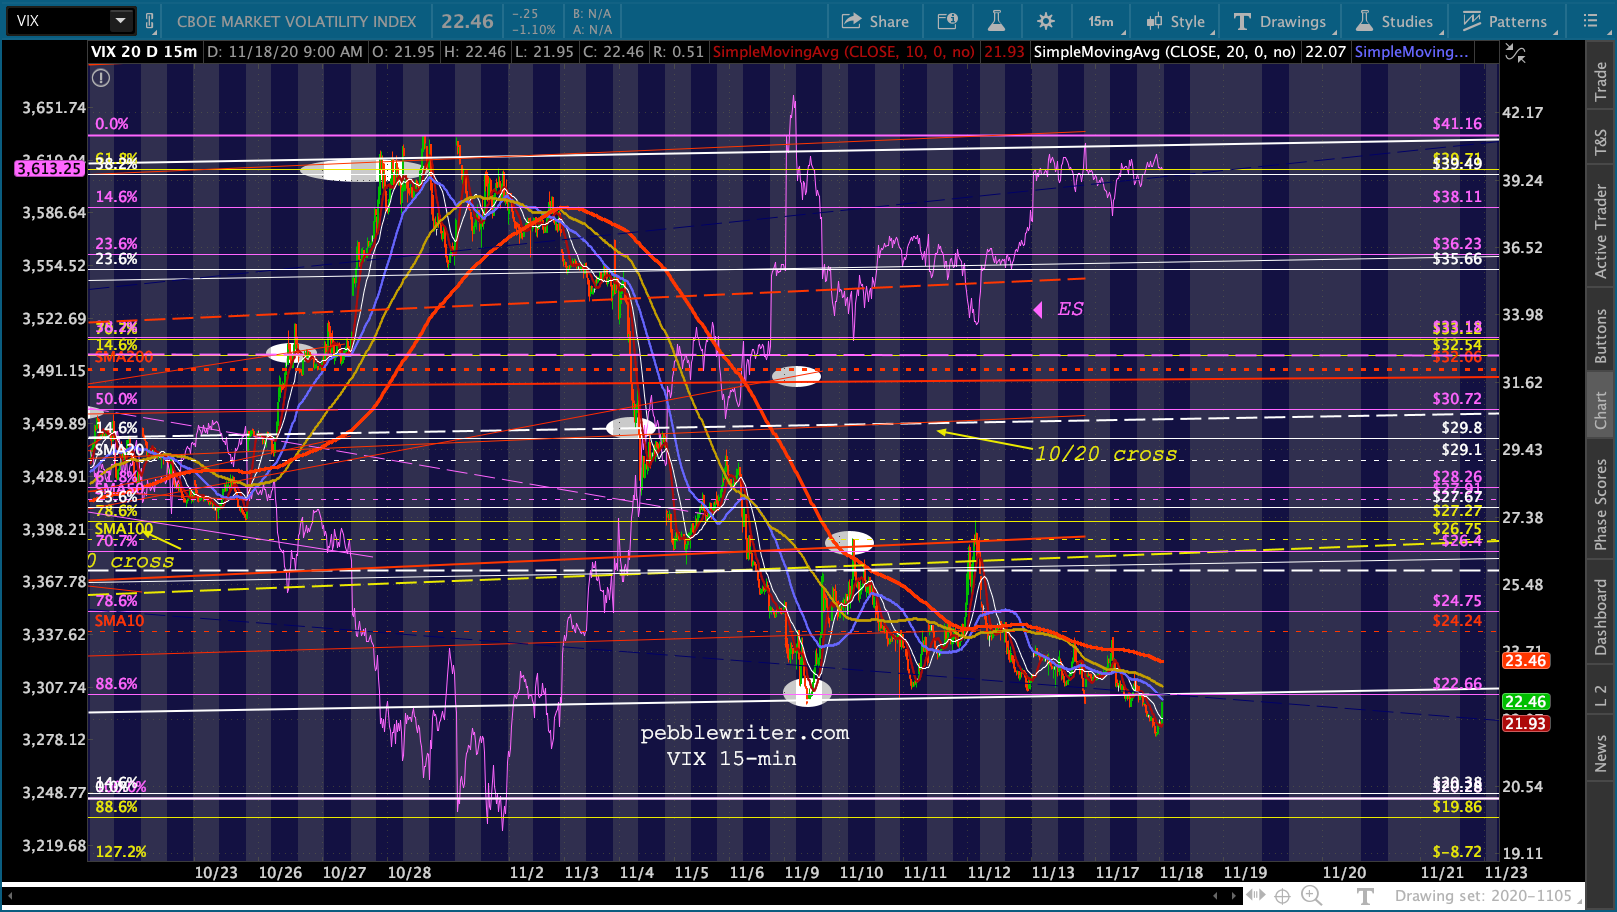 It could continue moving back and forth across this line – with a bias toward moving lower – for a while. SPX’s downside targets are unchanged, with the exception that its SMA200 continues inching higher toward a potentially acceptable backtest level…
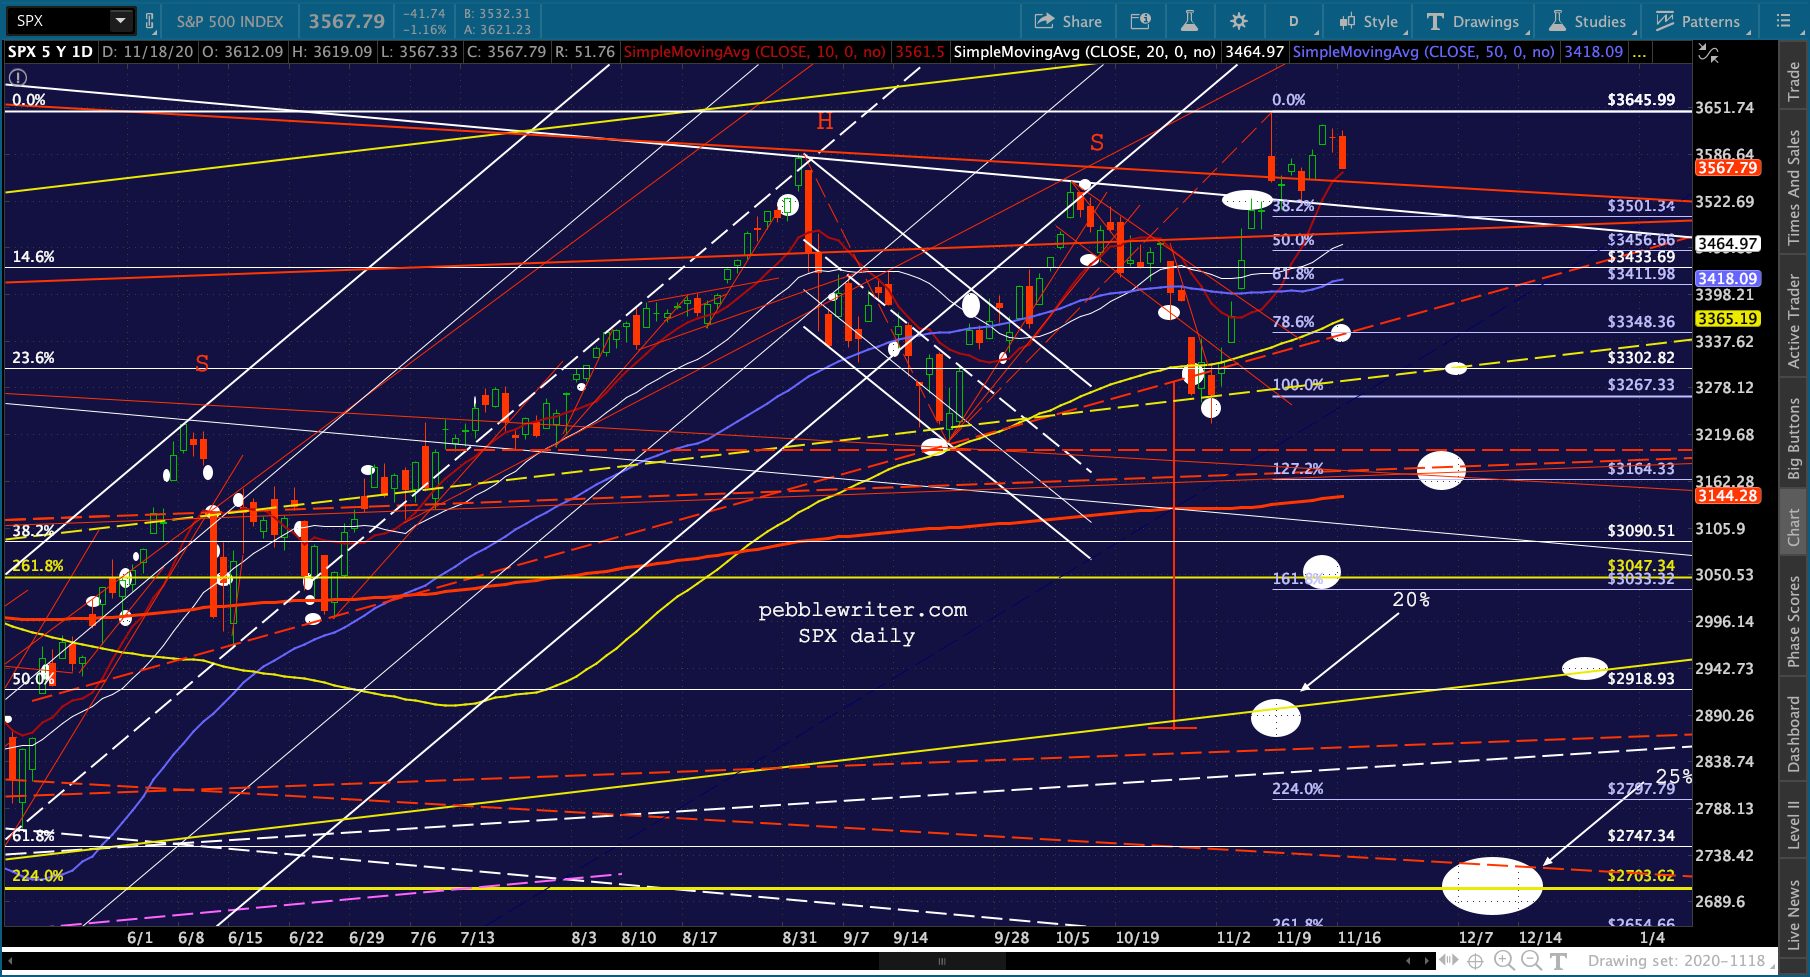
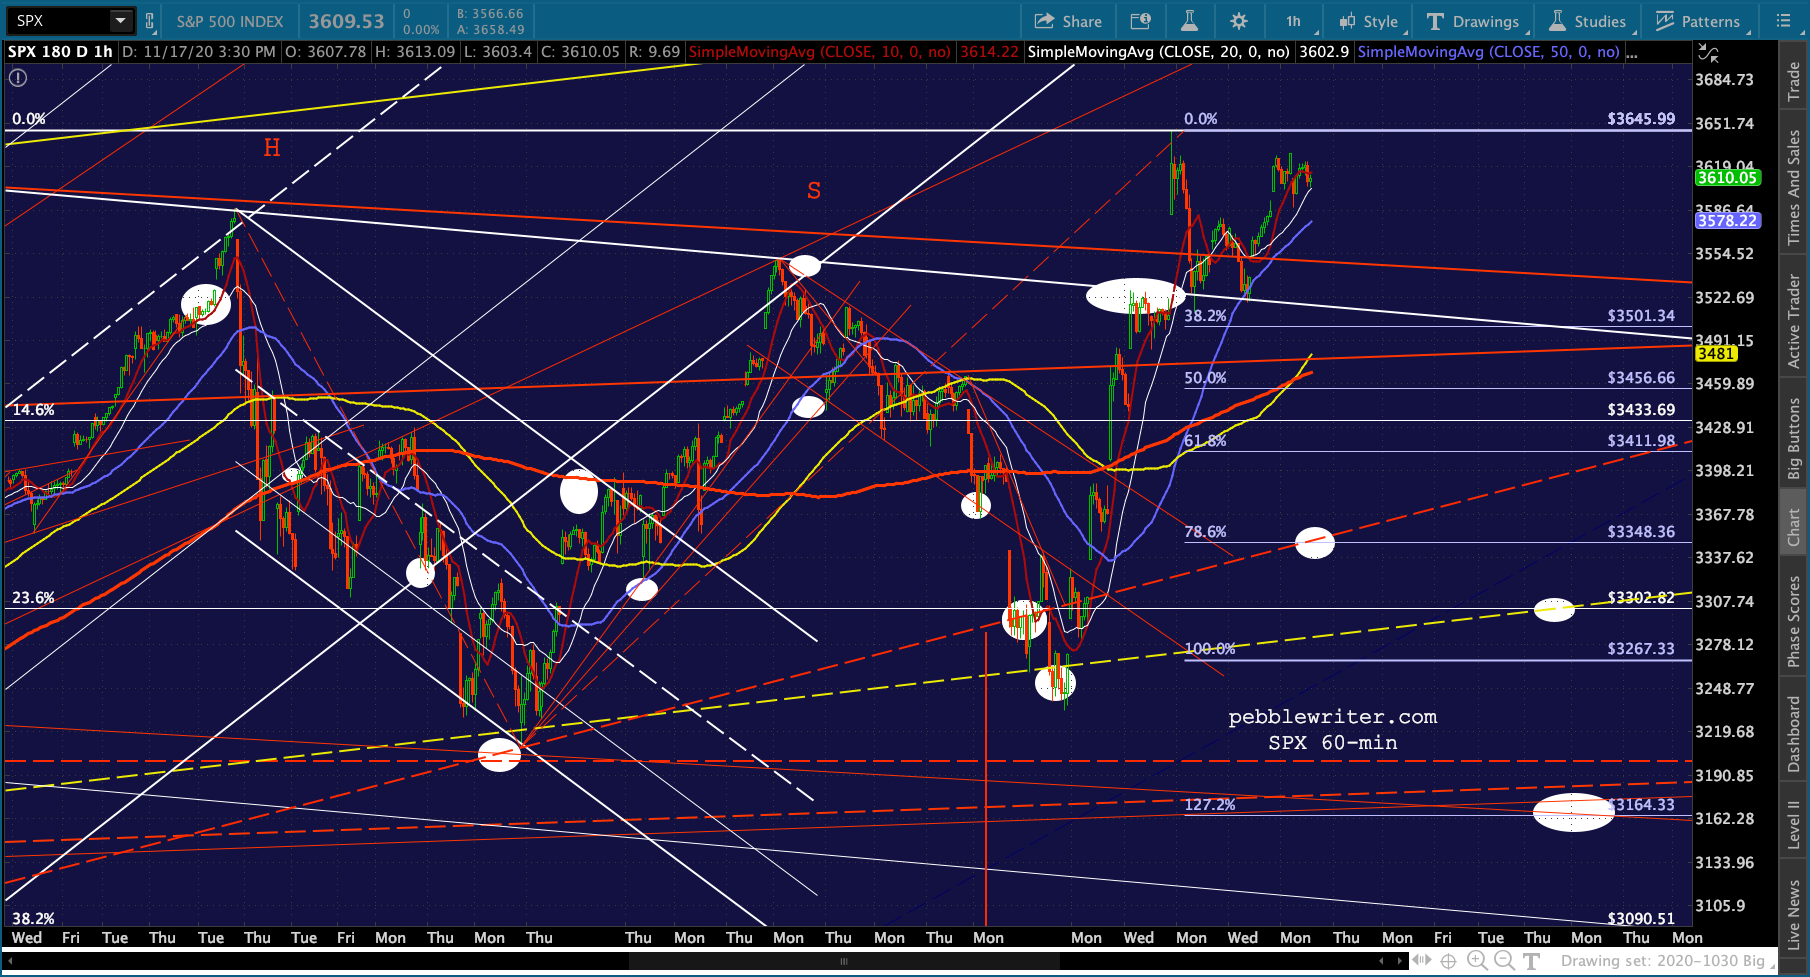 ..with the most interesting “safe” backtest being the red TL connecting the 2018 and 2019 highs – currently around 3164.
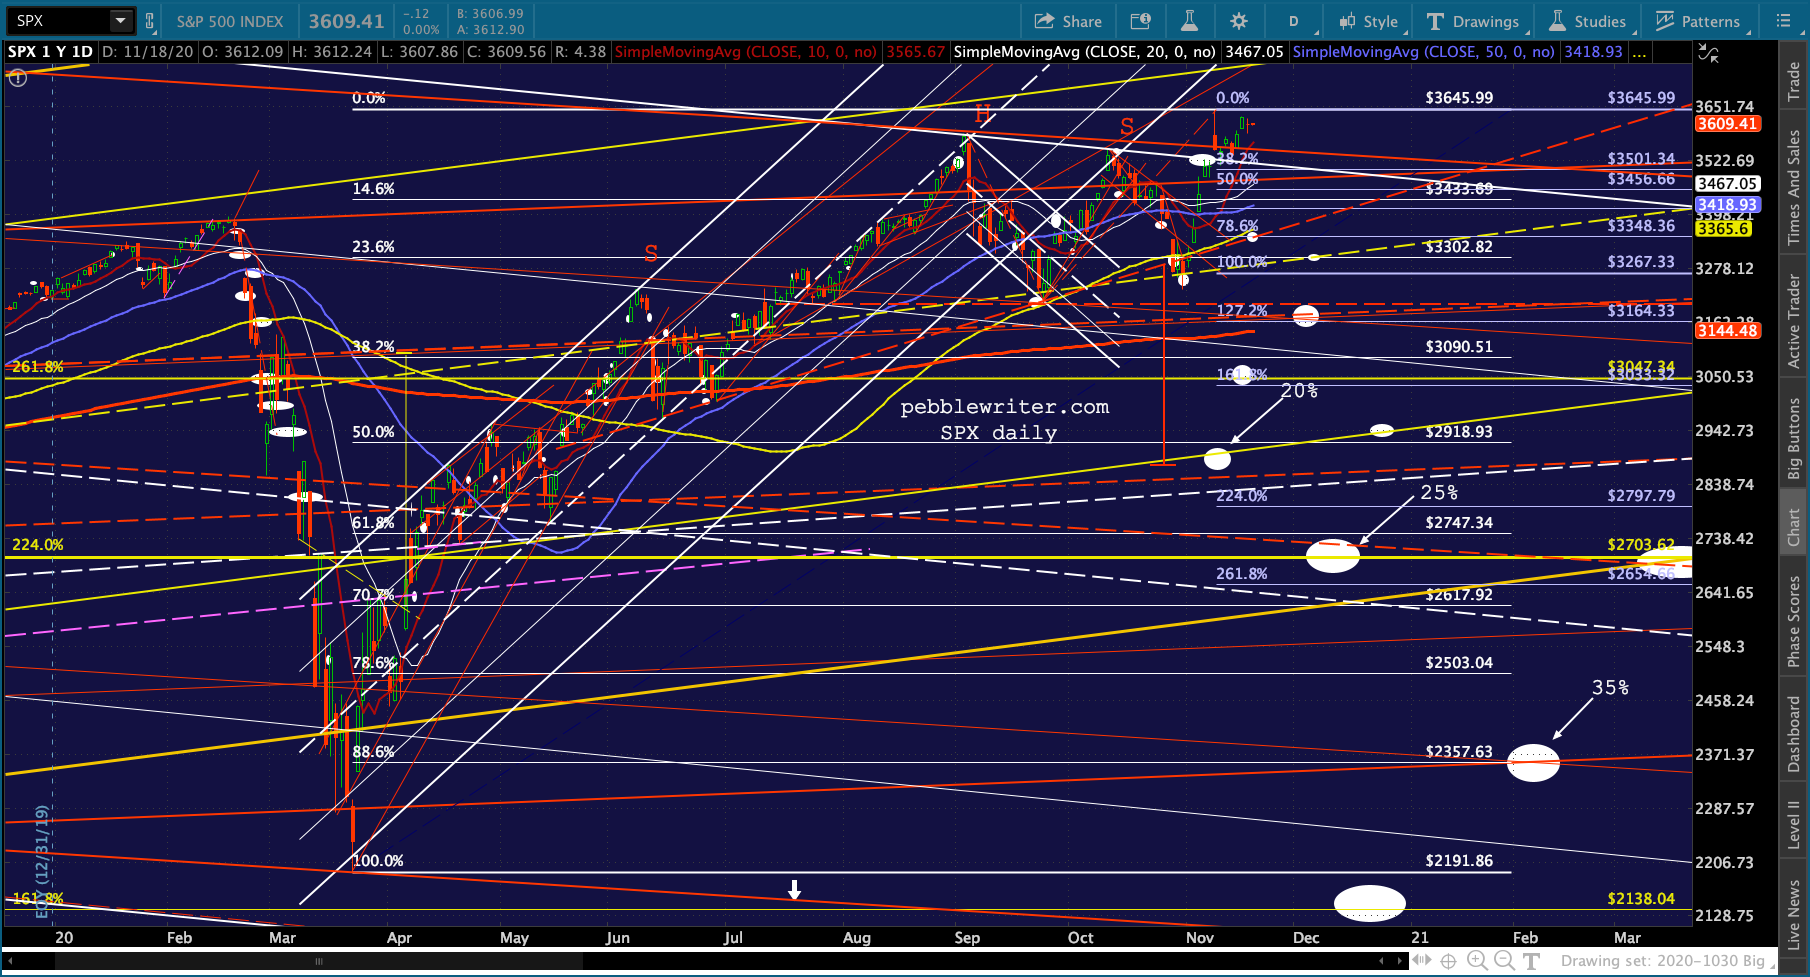 Any of the lower targets such as the 2.618 extension at 3047 or the 2.24 at 2703 would mean a breakdown of the SMA200 – which TPTB don’t seem to be ready to allow.
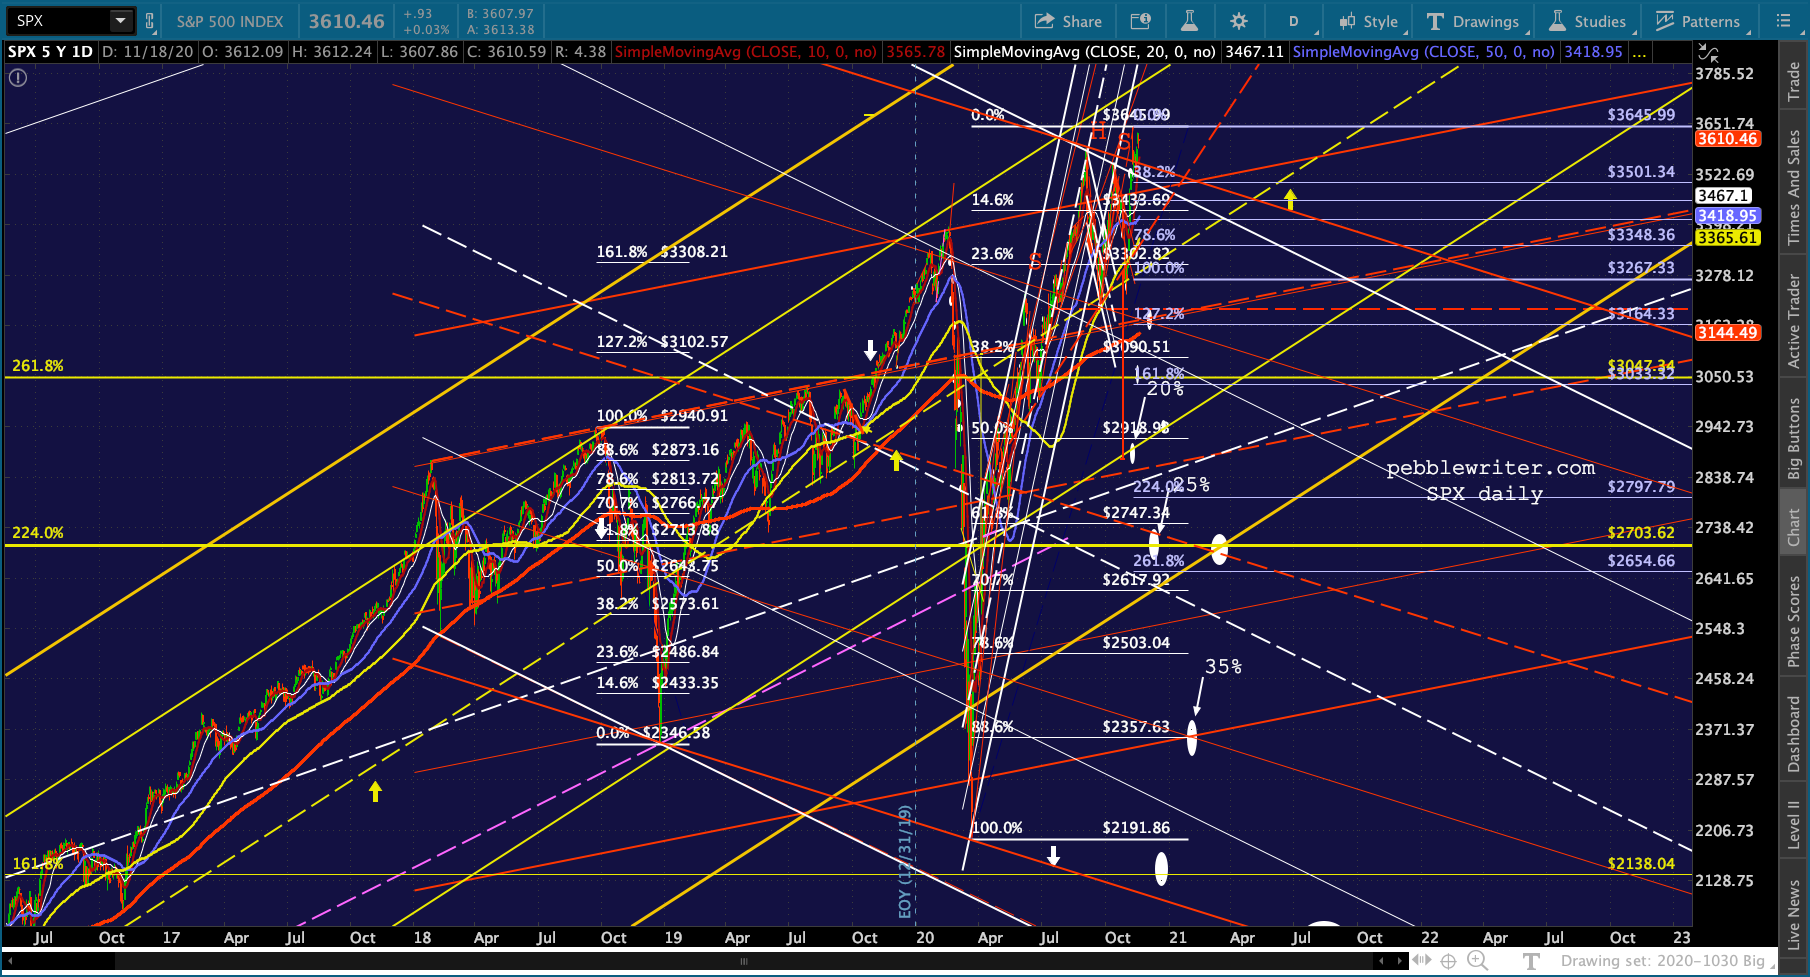 Of course, if we ignore the market’s indiscretion from late-Feb through Jun, the real support has been the rising yellow channel midline which held most recently on Sep 24 and Oct 30. It’s currently at 3348ish.
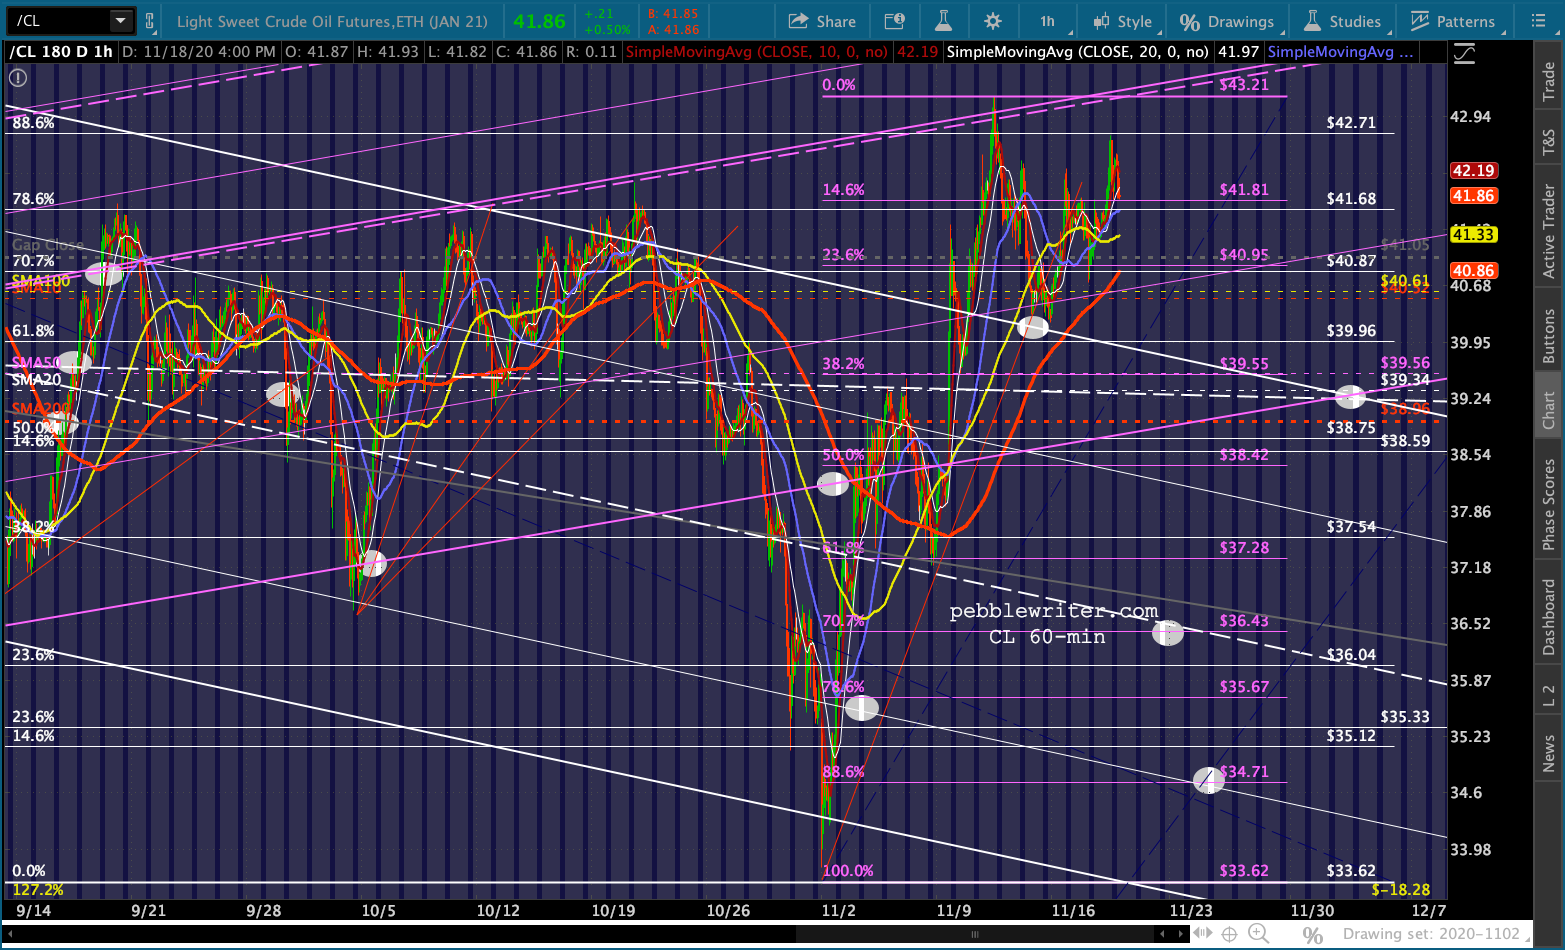
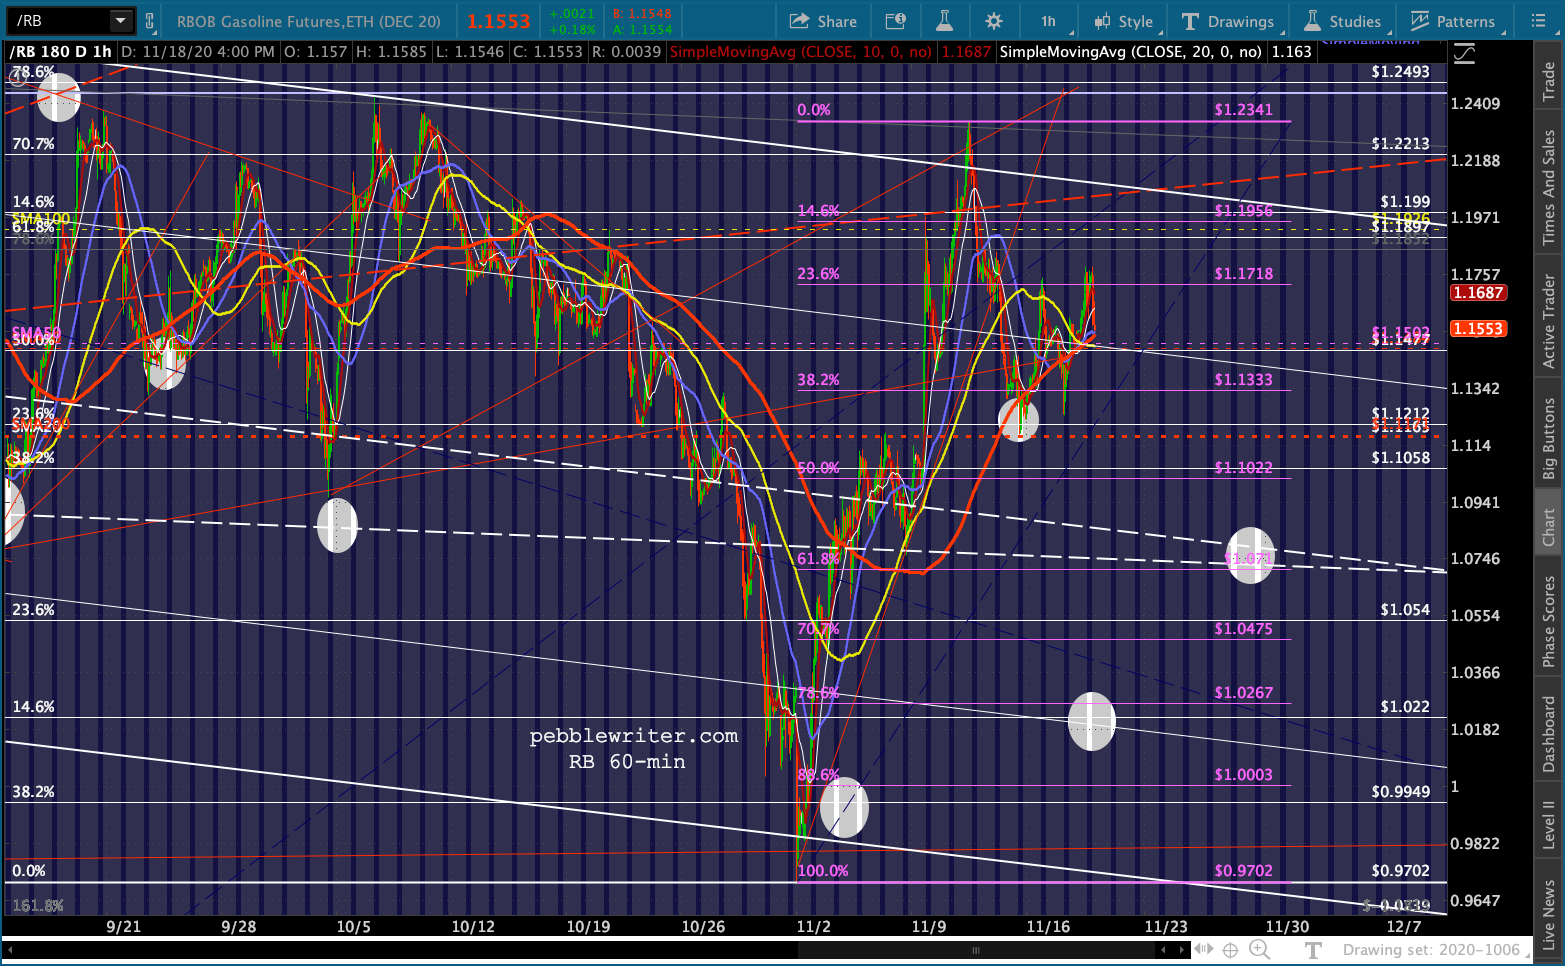
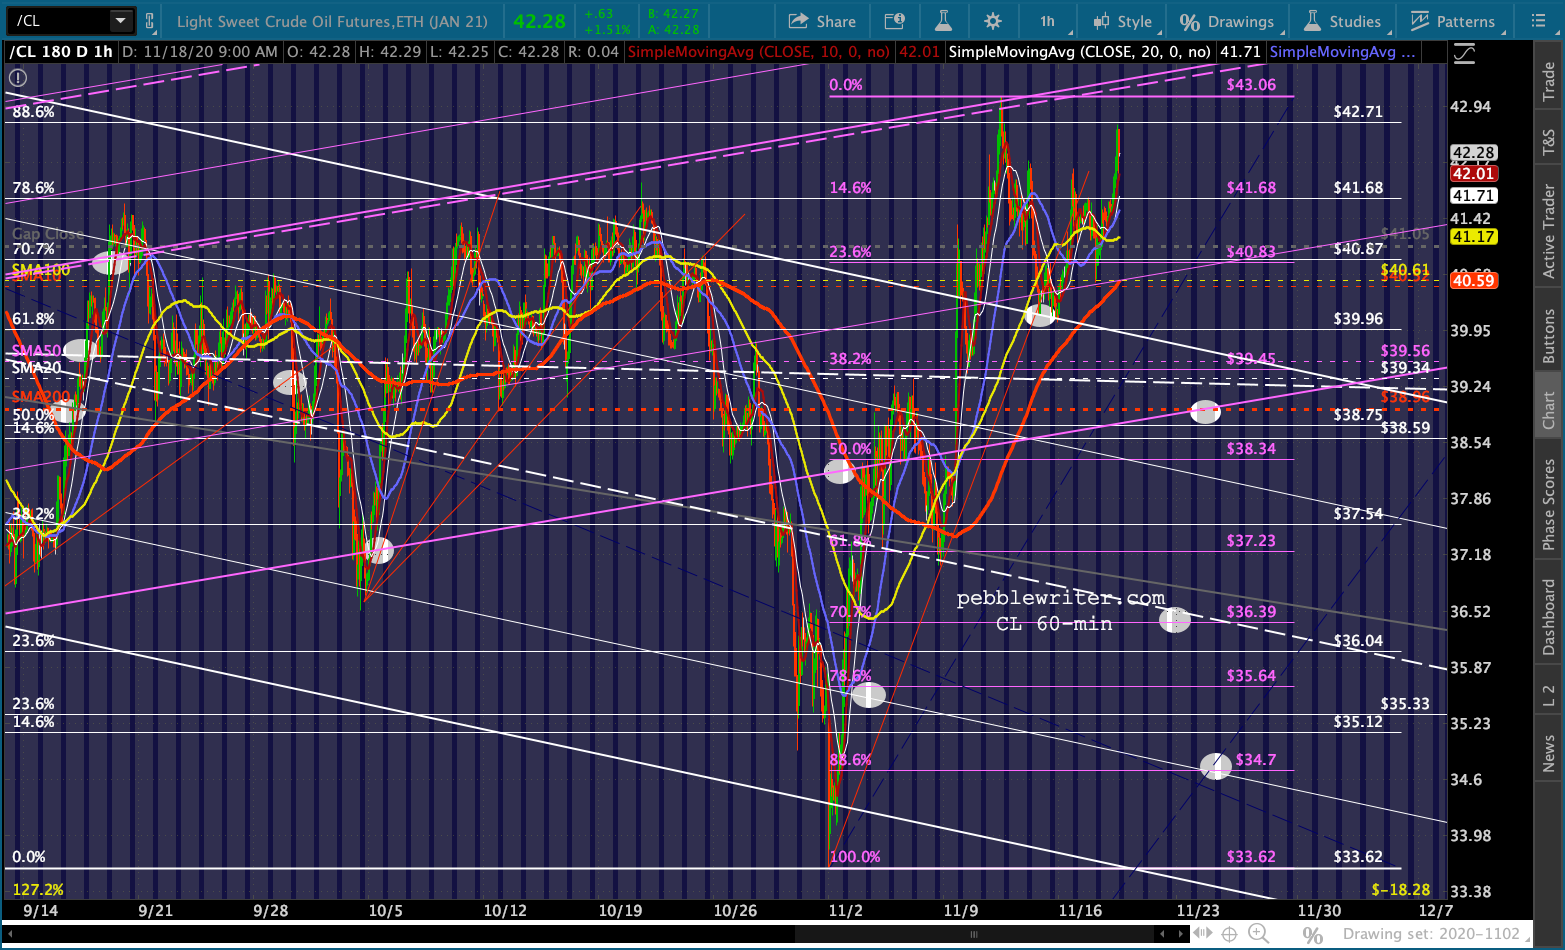
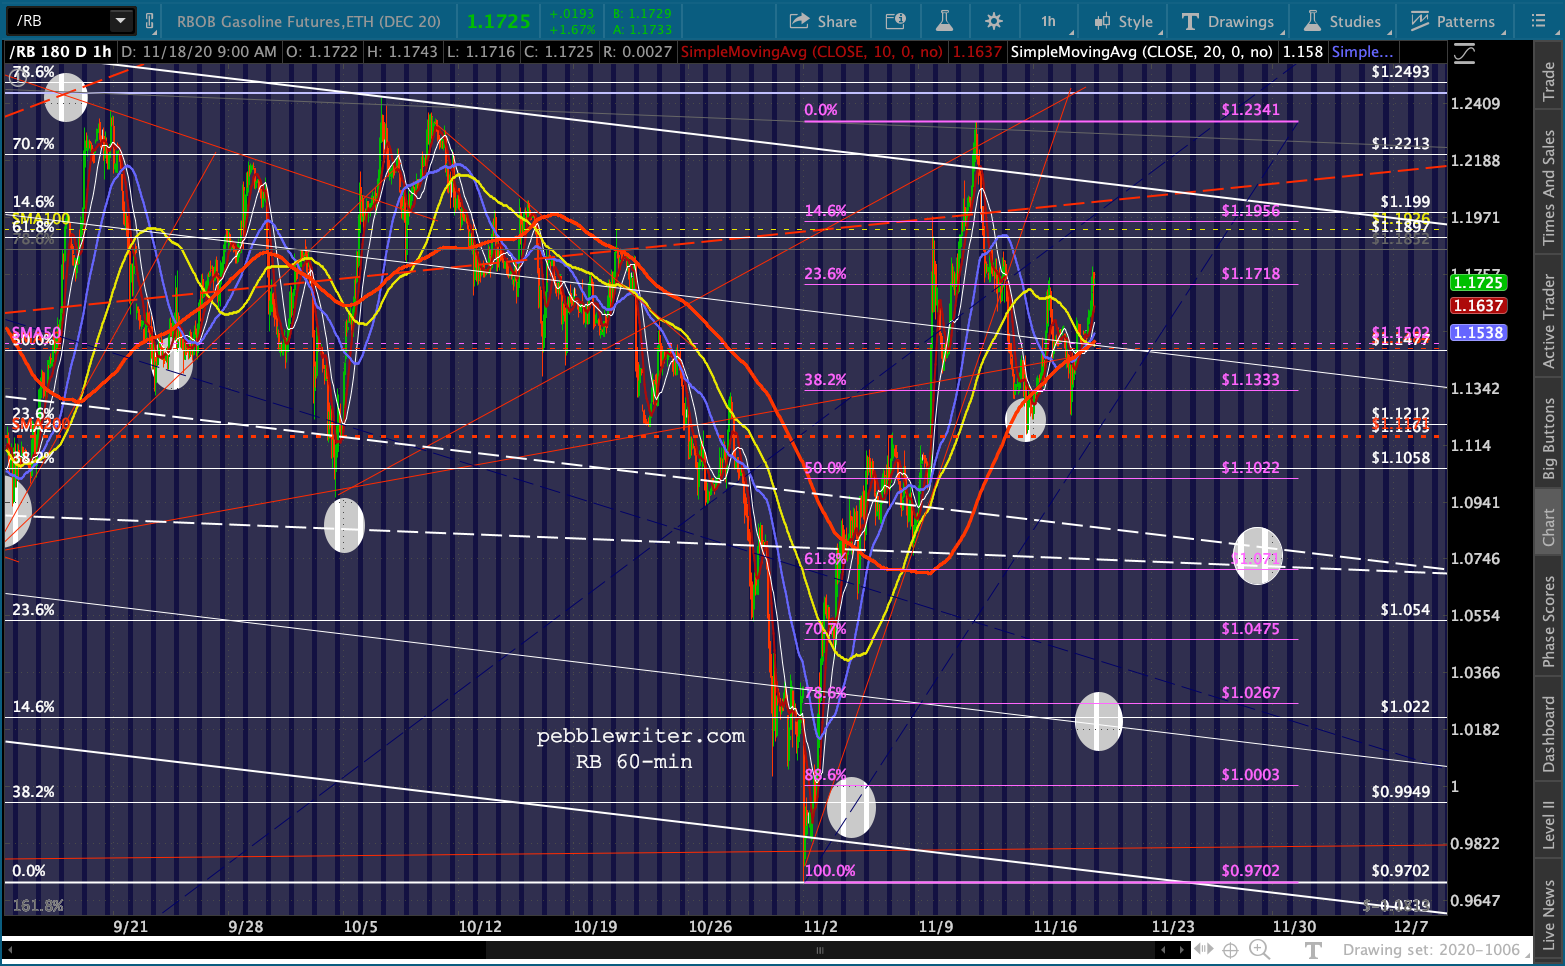
The other factors are also helping out this morning. CL and RB have rallied higher as they usually do in the runup to the EIA inventory data. OPEC has reportedly decided not to increase production. No kidding. Remember, API disappointed yesterday.
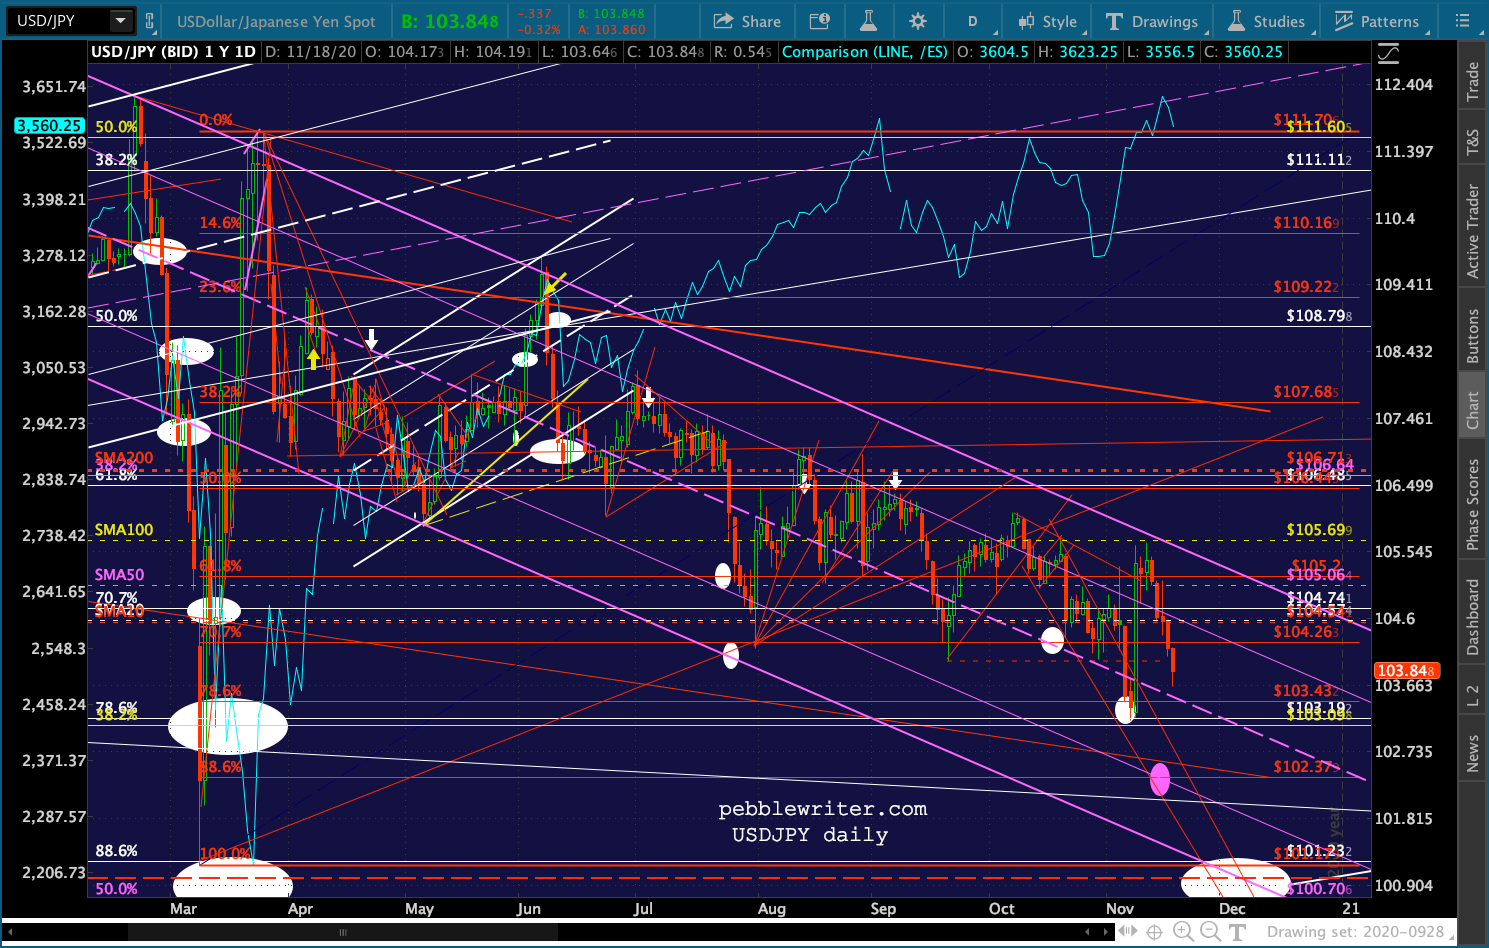
 On the currency front, USDJPY is making nice progress toward our downside targets…
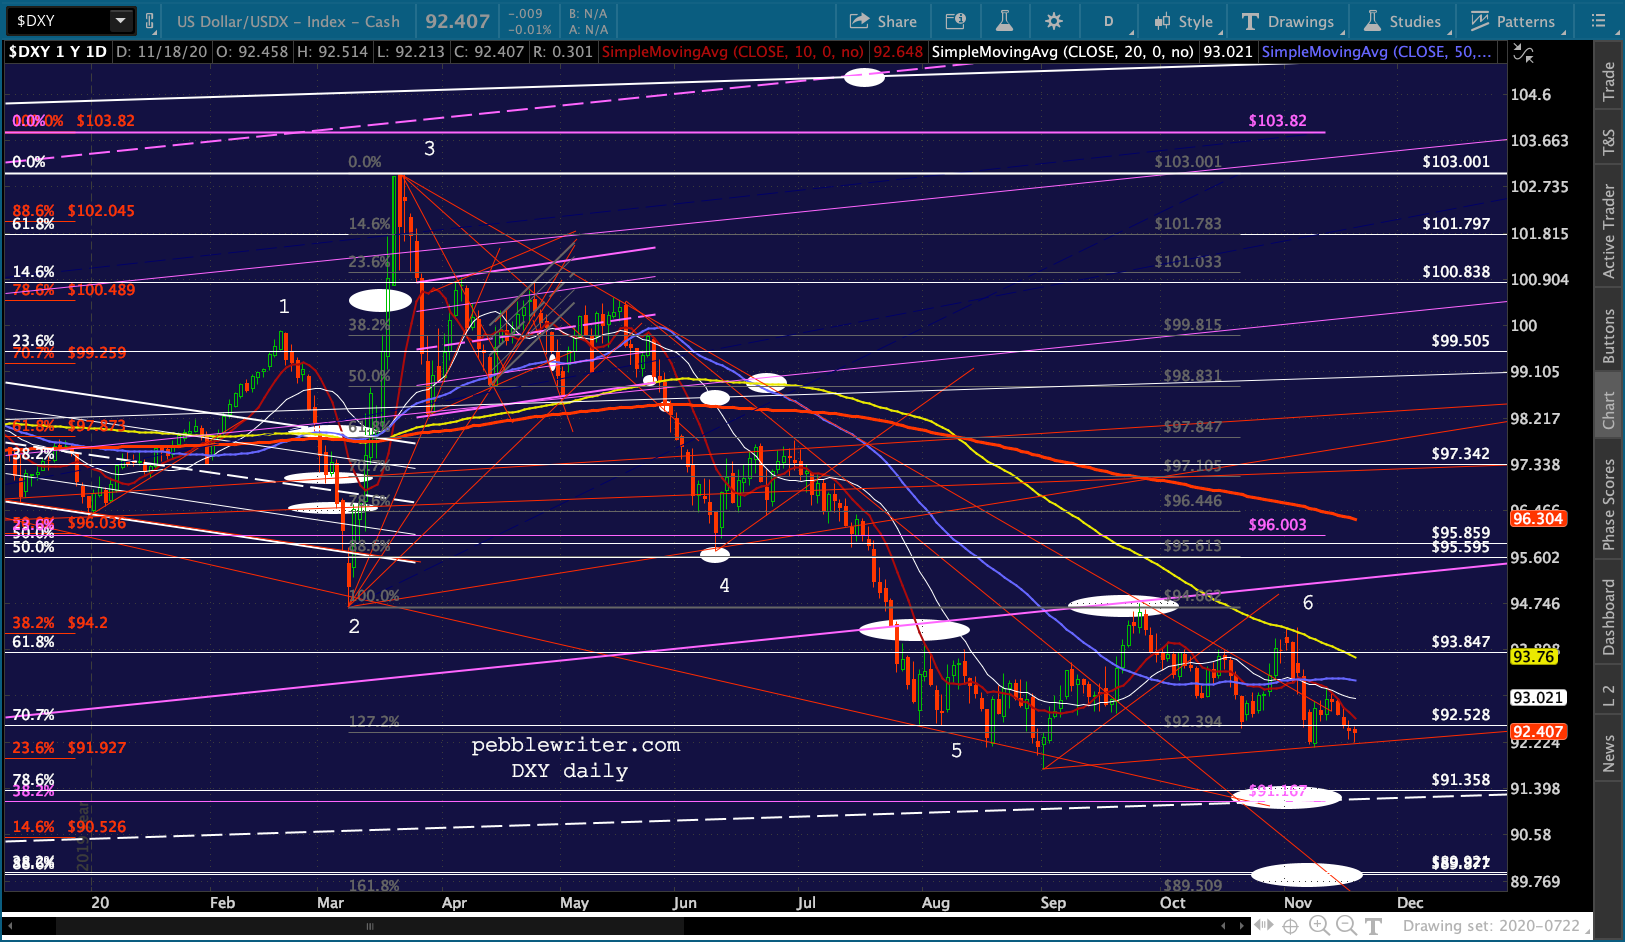
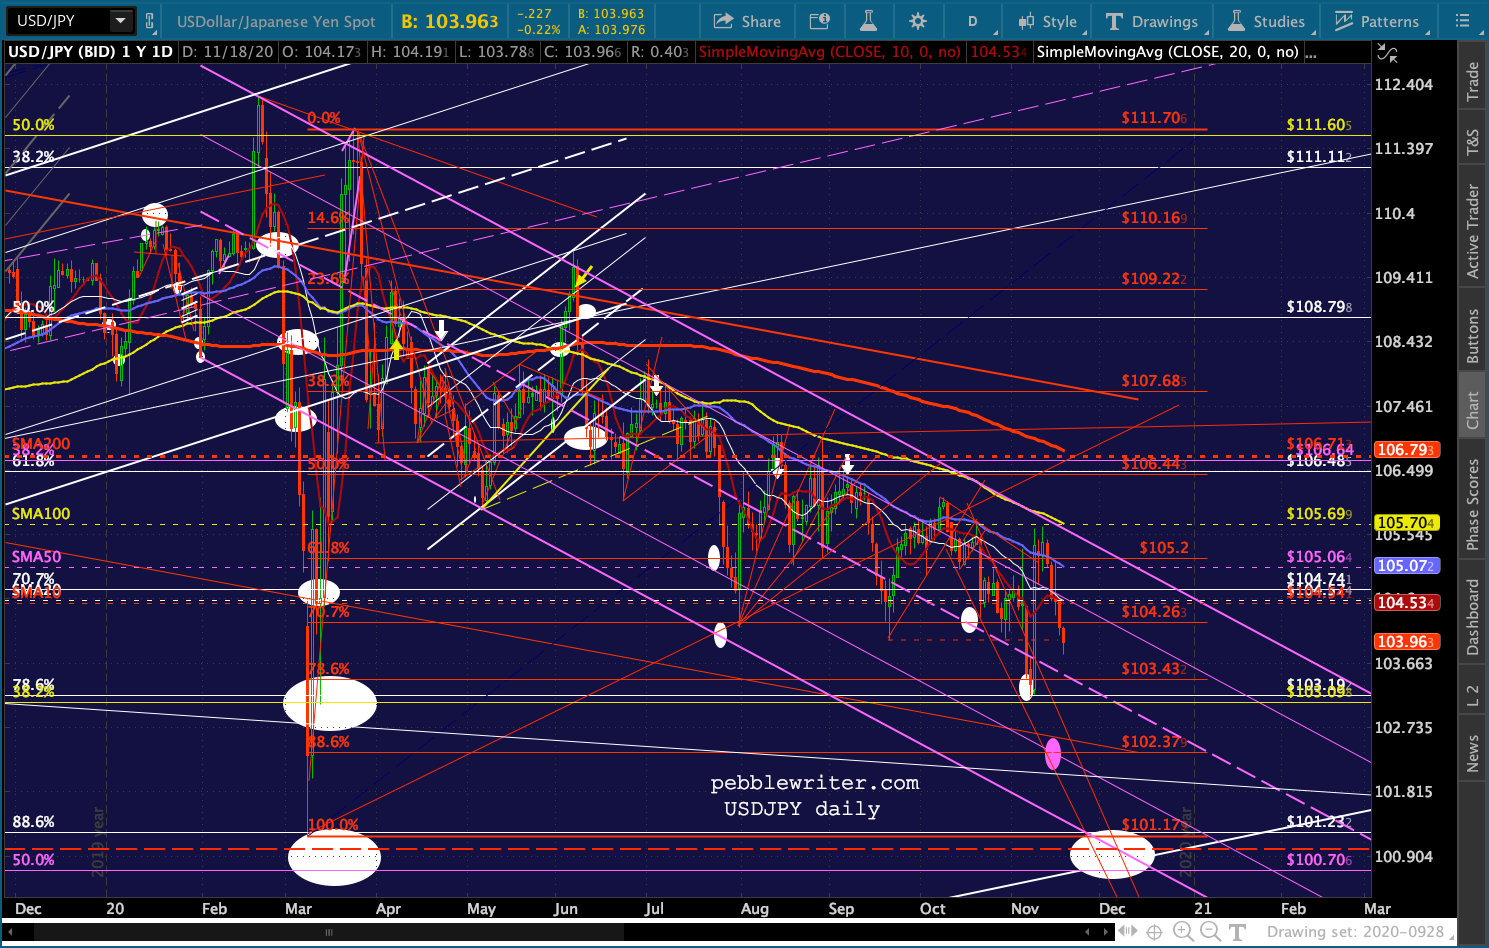 …though DXY has yet to break down – and might not until DJIA 30,000 is in the rear view.
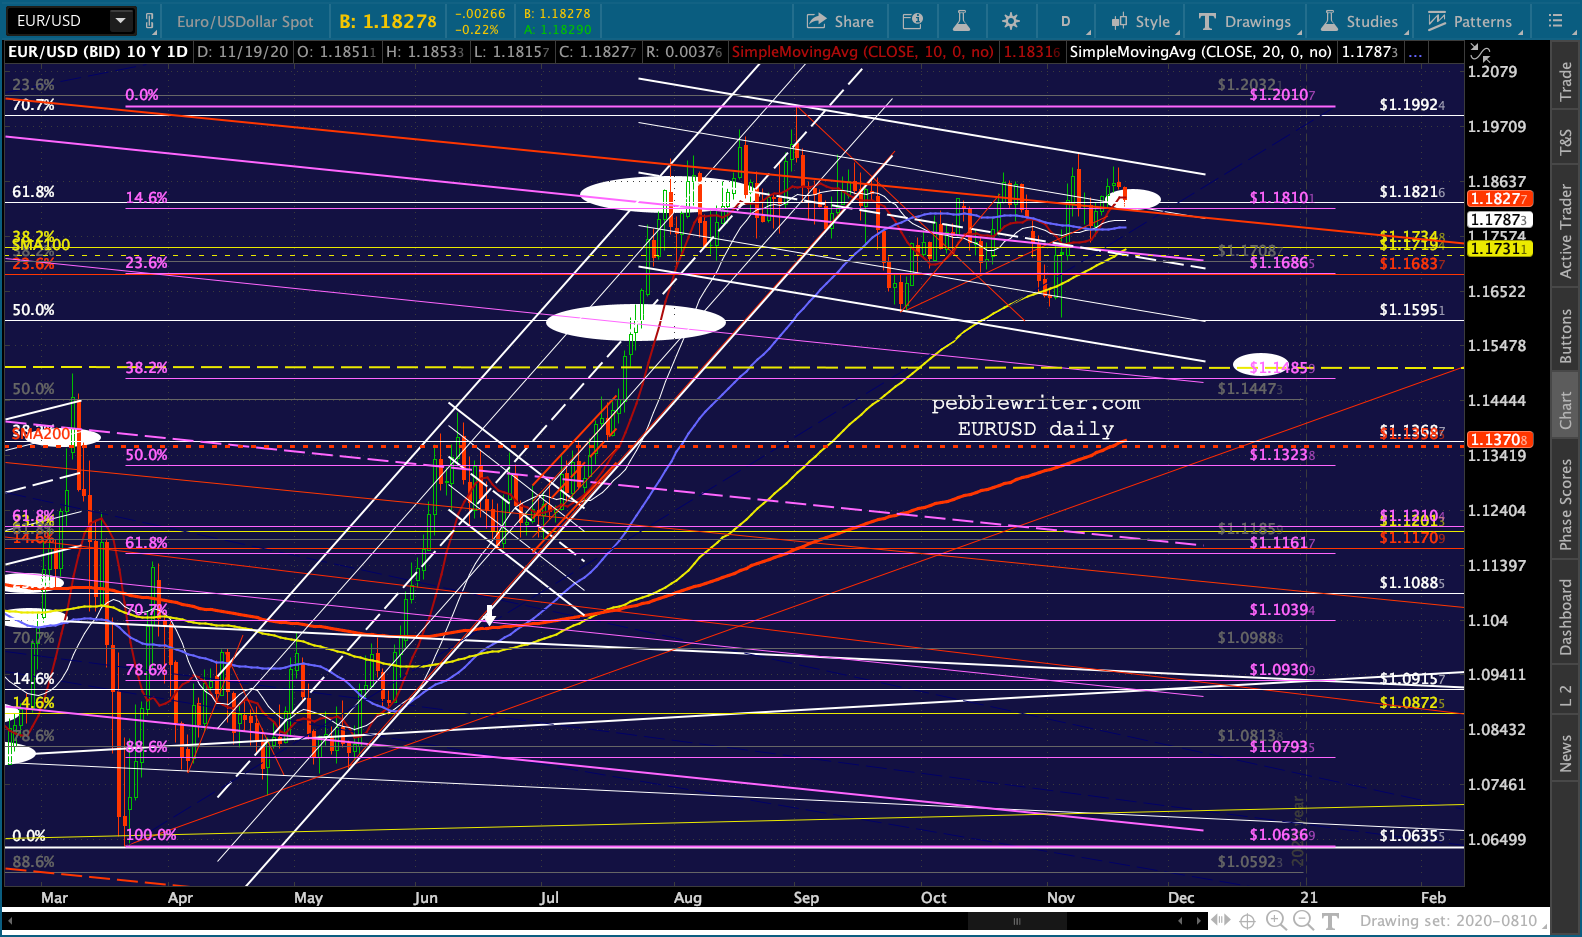
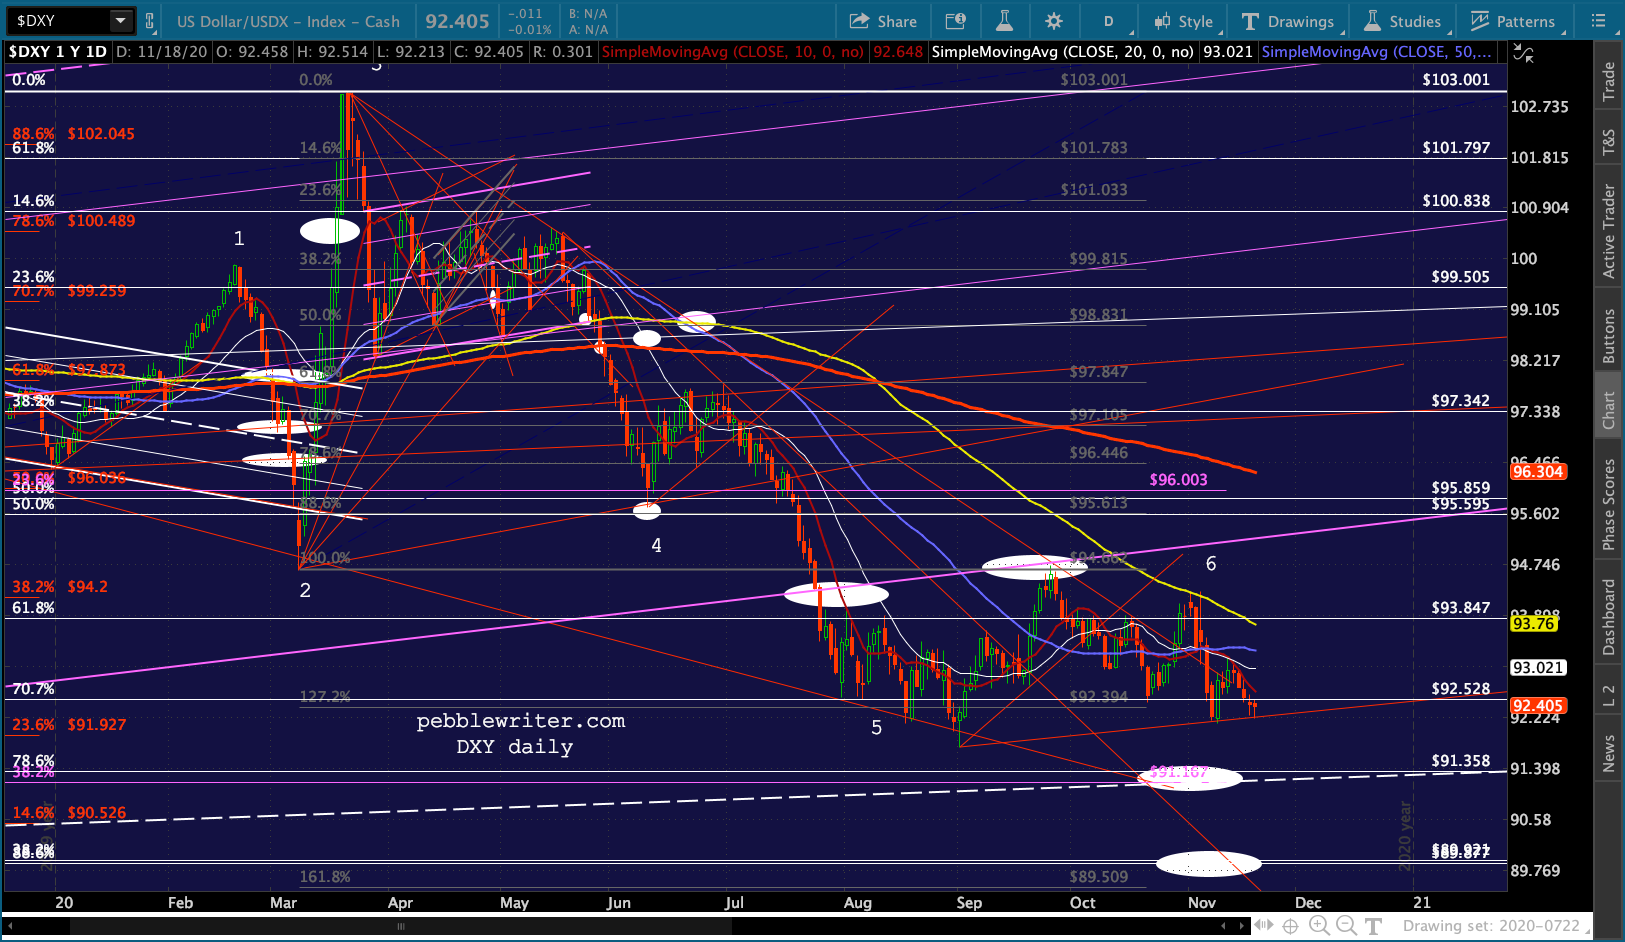 Given EURUSD’s levels, DXY still needs a big plunge by USDJPY.
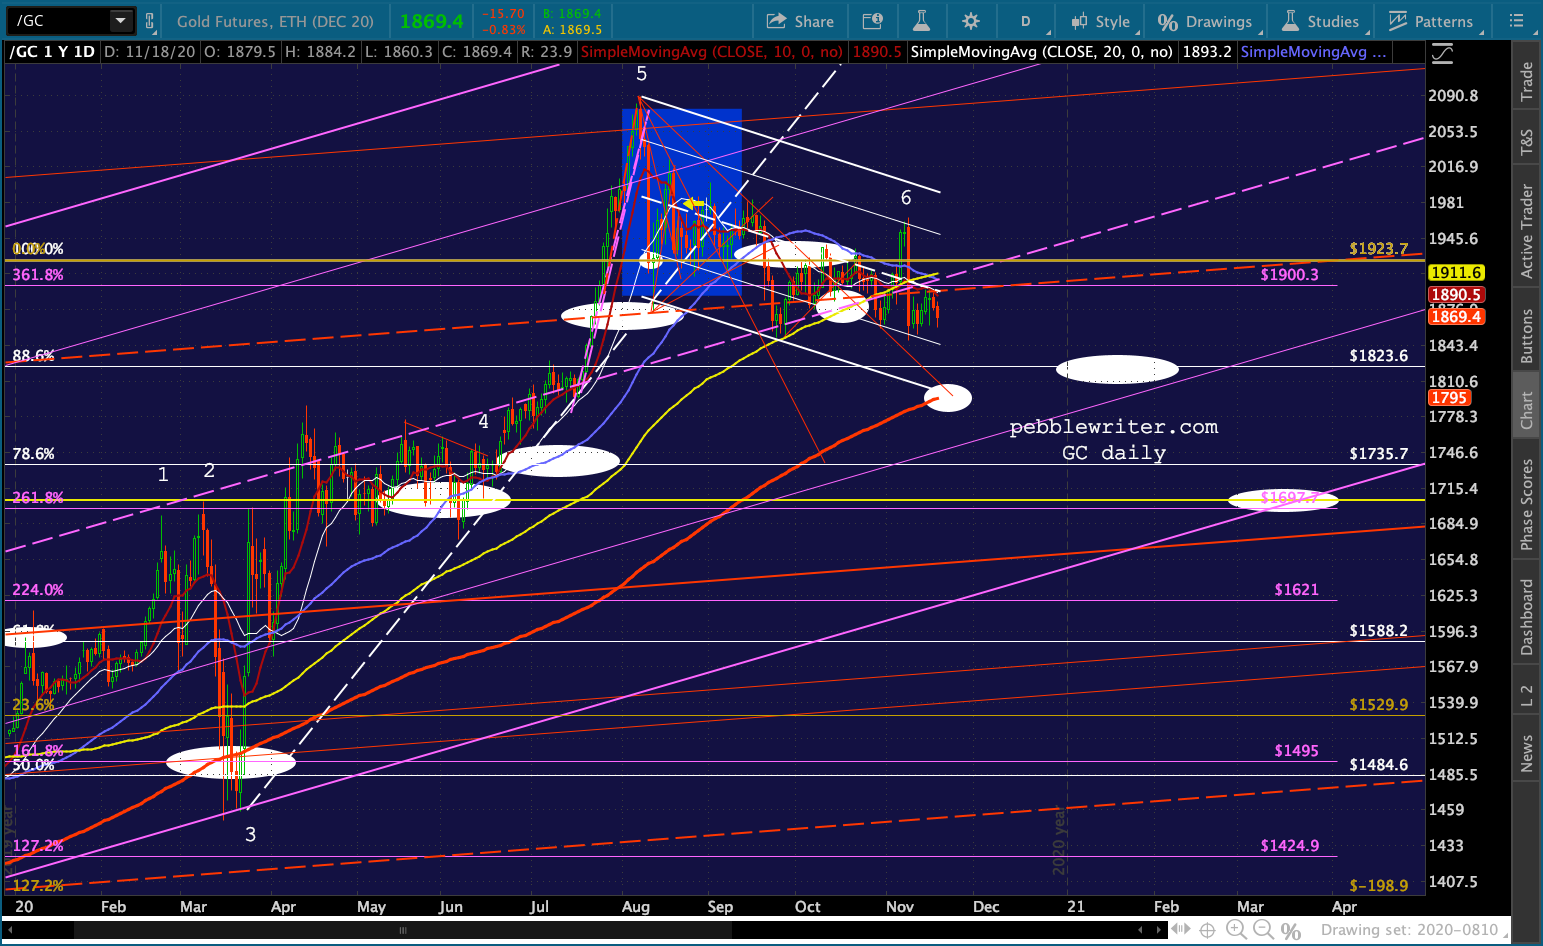
 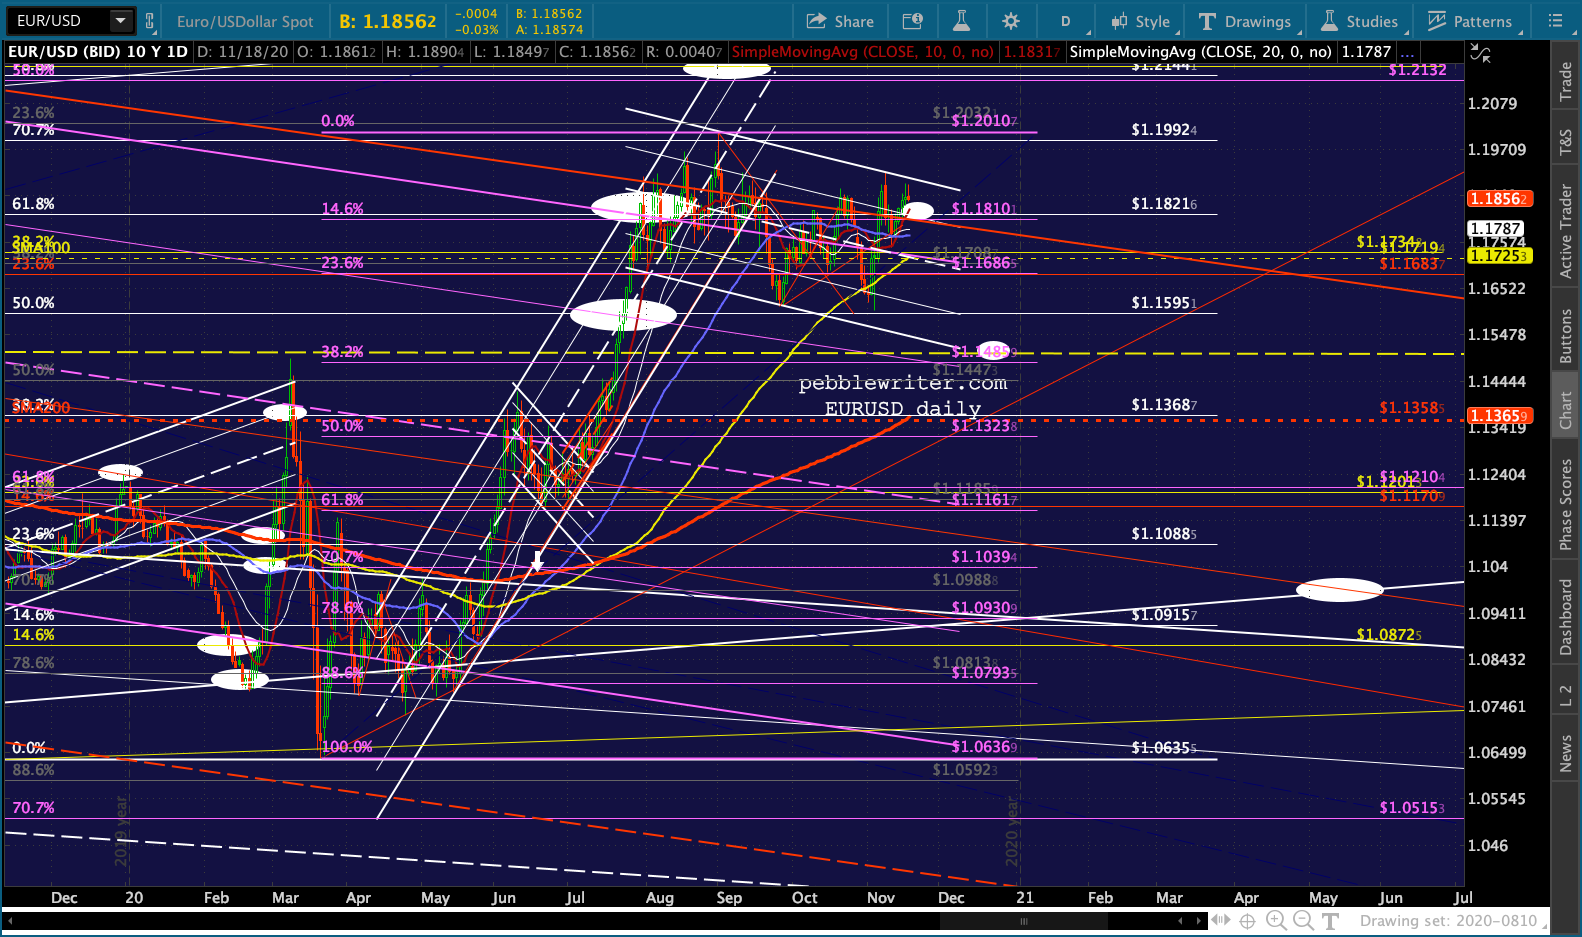 GC continues going sideways, with its SMA200 almost to the falling white channel bottom.
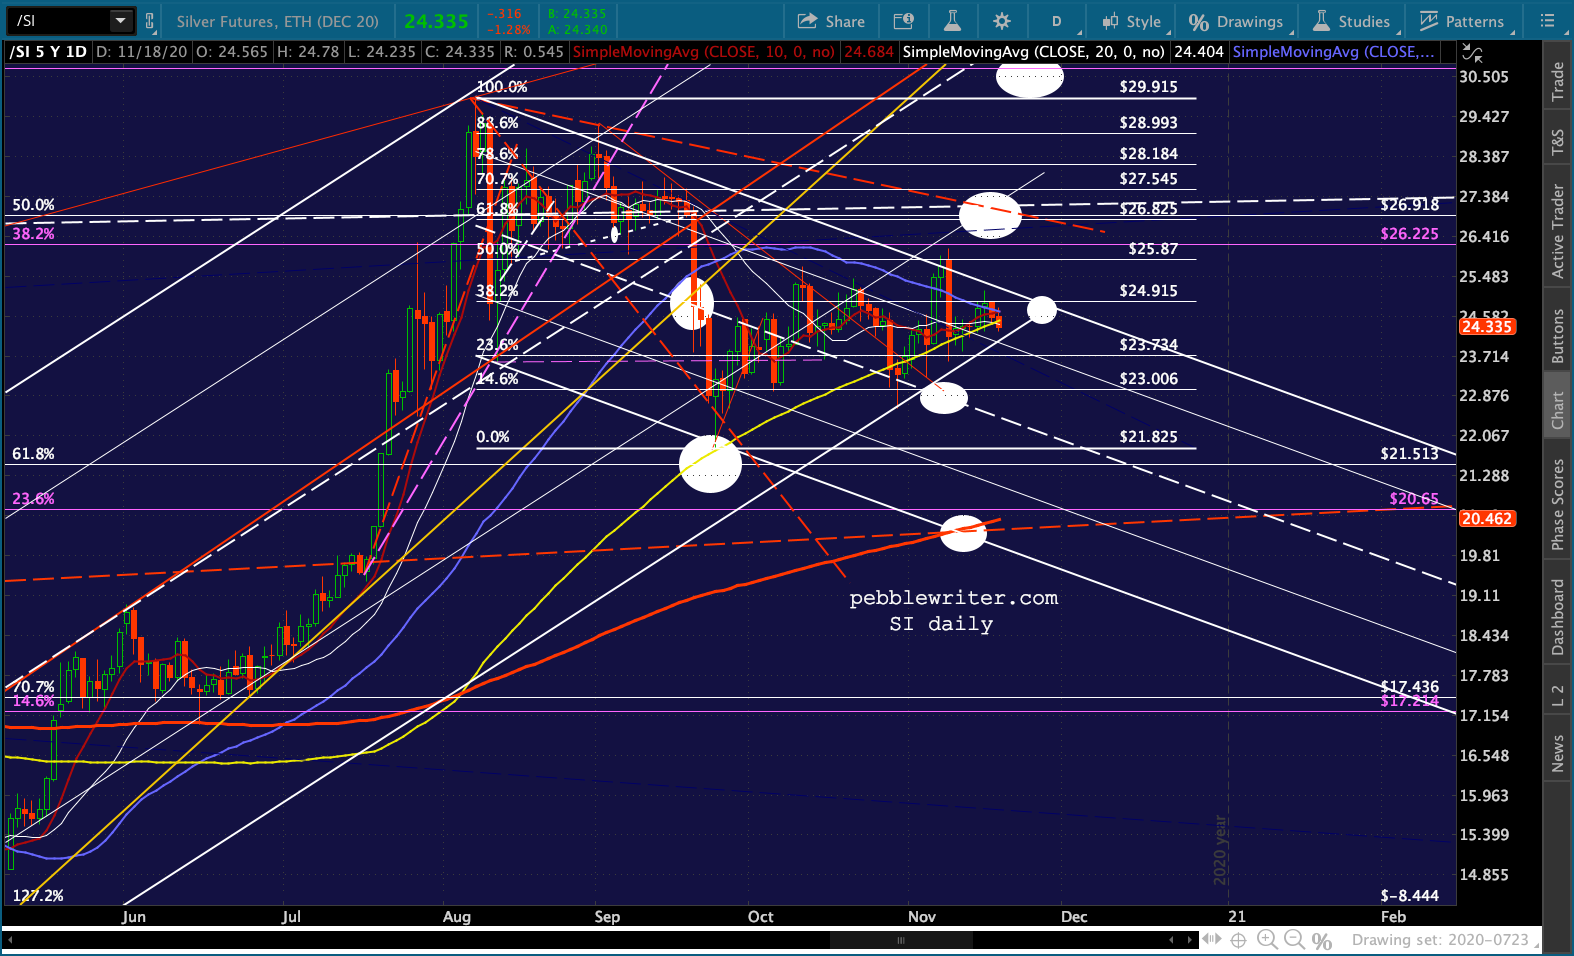
 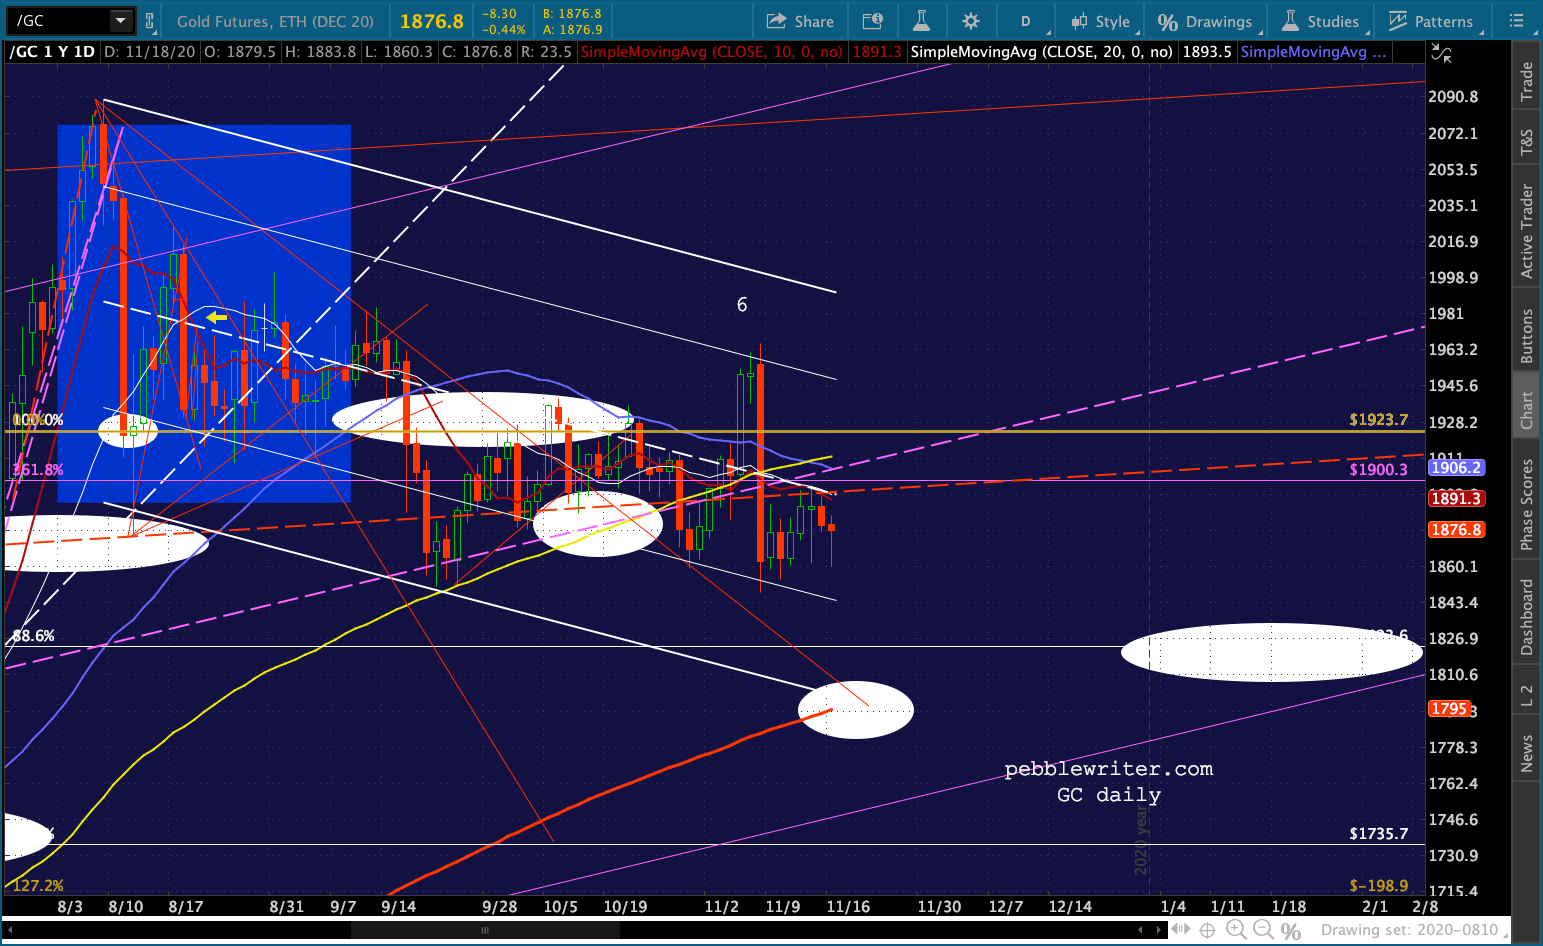 And, SI continues to inch toward its triangle apex.
 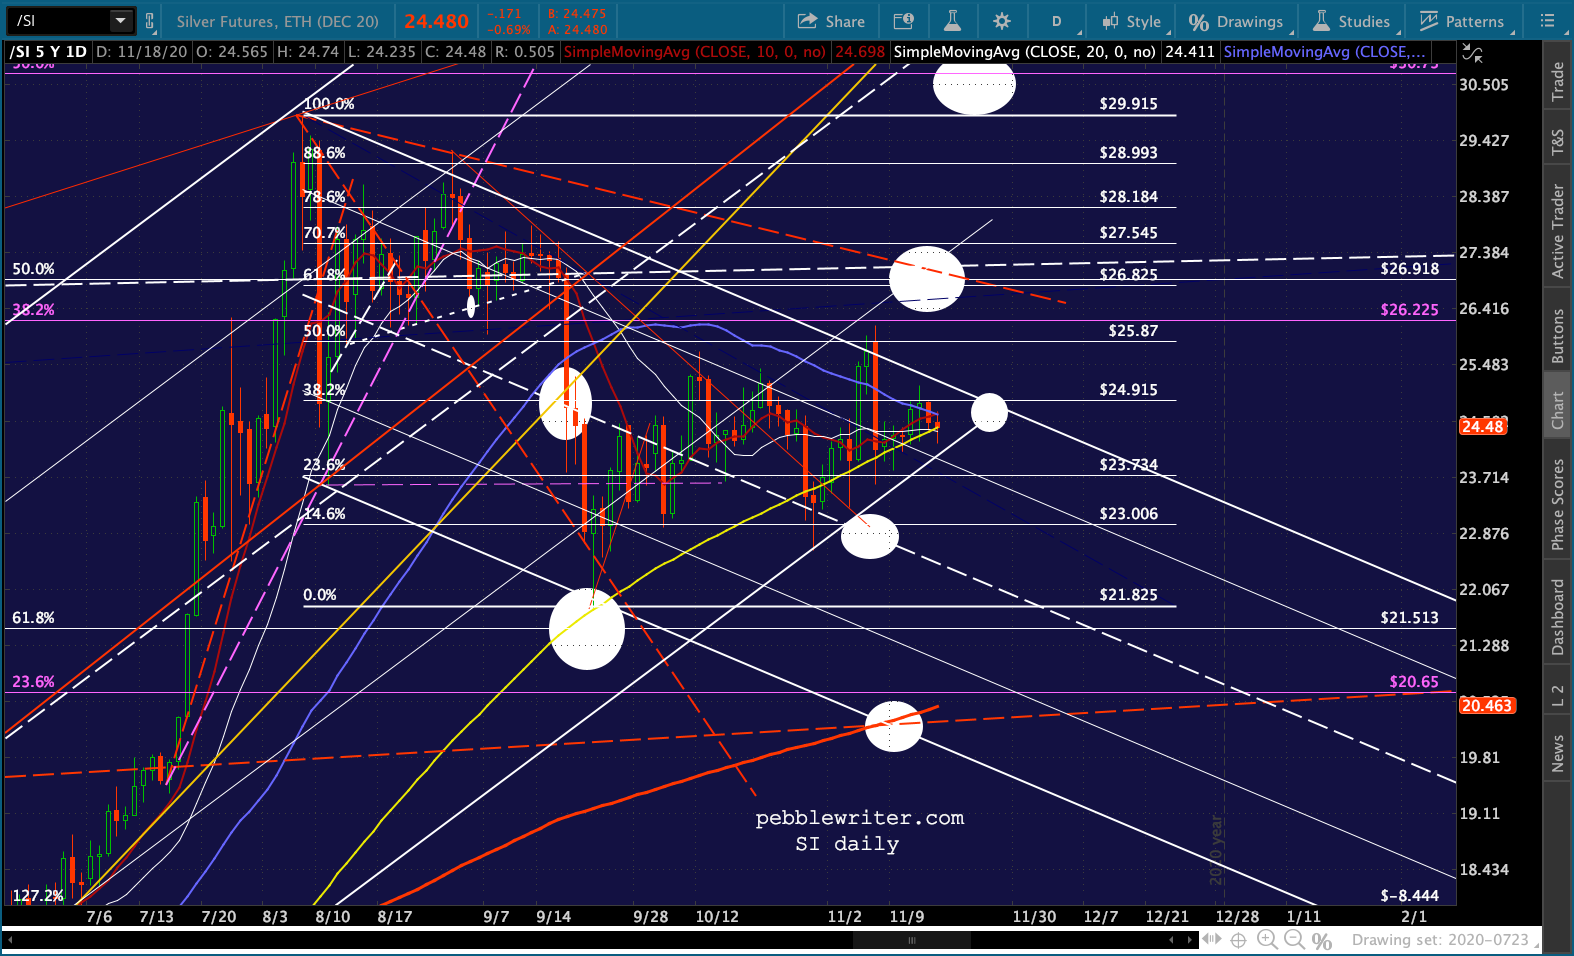 BTC, which we discussed at length yesterday, pushed slightly past its .886 at 17,780 has has settled back down to backtest it. Note that the 60-min RSI chart shows a potential breakdown below support. The daily chart already shows negative divergence. A drop back though 17,780 – which I expect – initially opens up a pink channel backtest at 16,450-16,630.
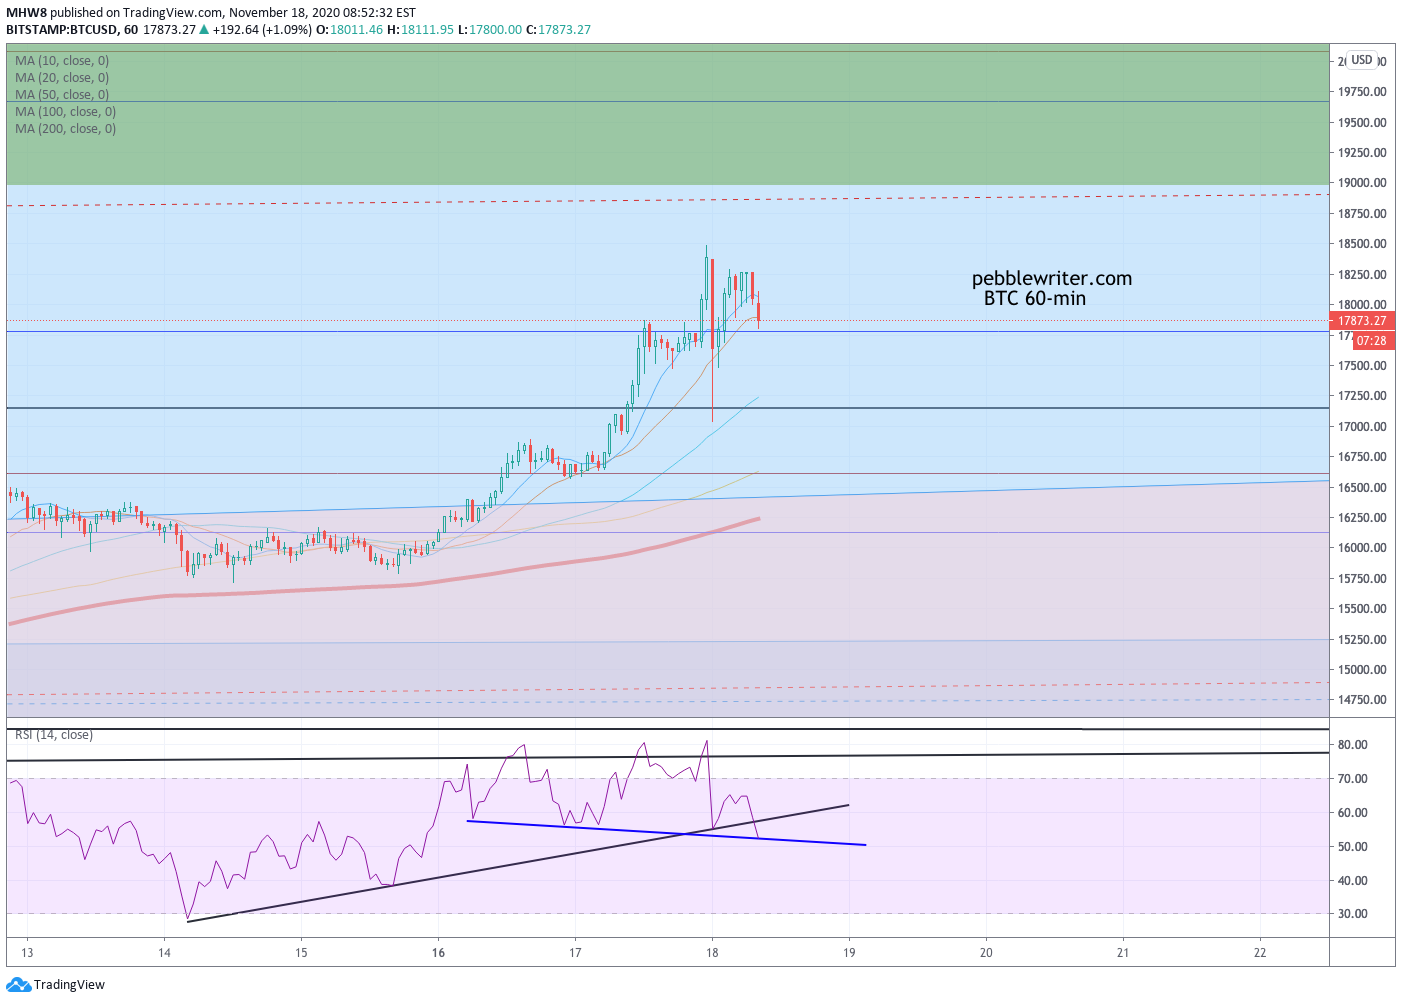 The 2s10s has settled back down to backtest the red TL representing recent horizontal support at 69 bps. Remember, previous breakdowns of horizontal support have ushered in large downturns for equities.
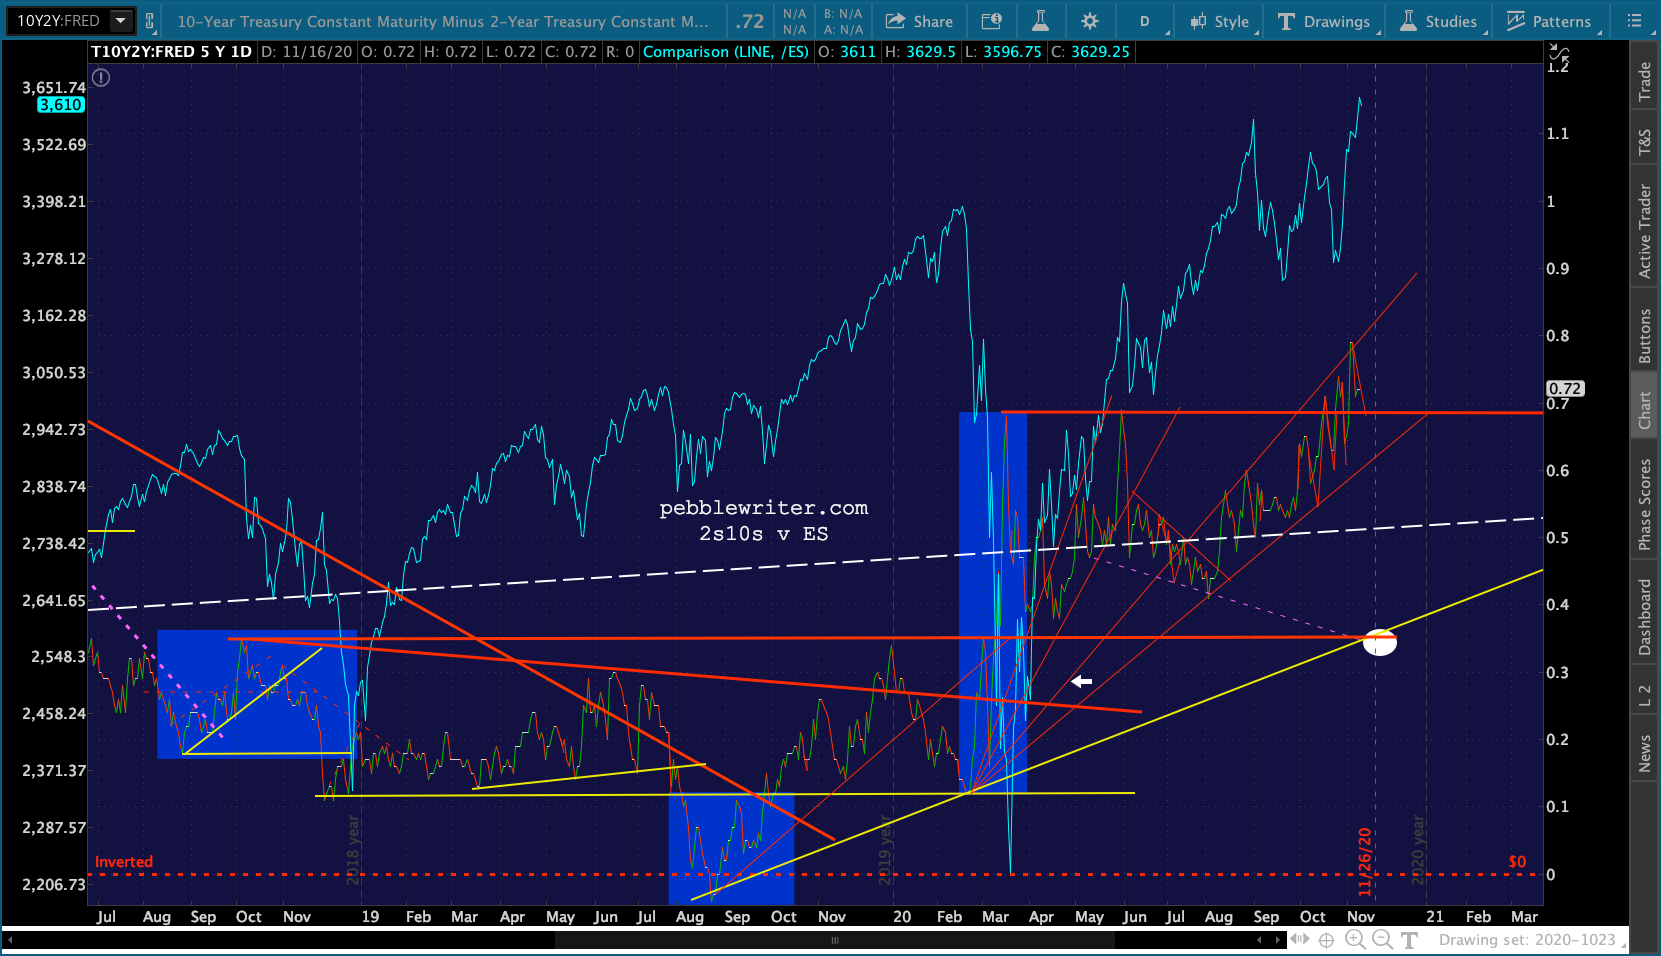
 I have some follow-up appointments for my new shoulder this morning, but will post more after my return.
UPDATE: 4:00 PM
Turns out the coronavirus story is still relevant…