

Friday, USDJPY plunged below the bottom of the rising purple channel it’s been in since Feb 24. Between that and CL’s initial sell-off, it was enough to shave about 20 points off ES’ overnight highs. SPX had been nearing our 1999 target, and it was enough to make us wonder if the tag would be delay a week or more.
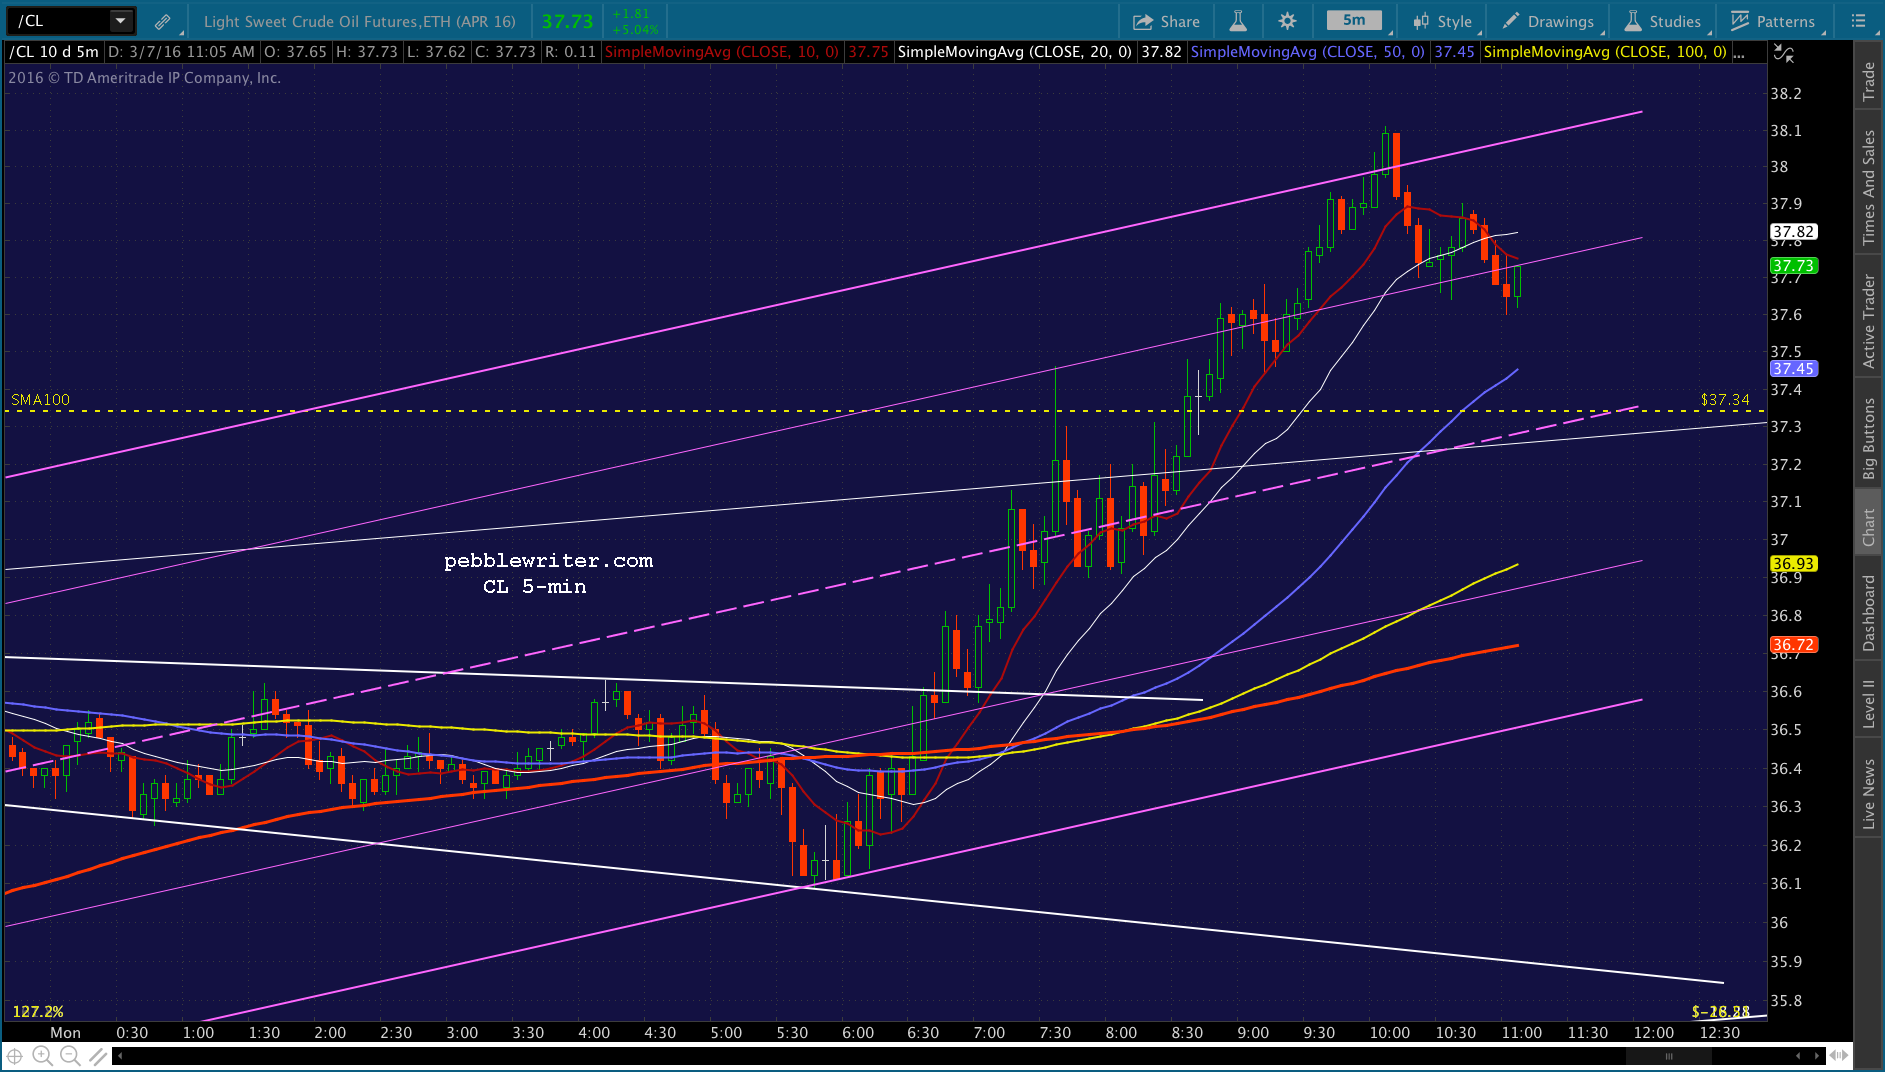
But, the “markets” opened, CL quickly rebounded 6.5%, and USDJPY popped right back above the channel bottom, and SPX gained 24 points from its lows. Ah, the delights of algo-driven trading.
It’s a pattern we’ve seen over and over during the past week, and is reminiscent of pretty much all of 2014. So, what does it mean if USDJPY is doing it all over again this morning? Should we take it seriously this time? continued for members…
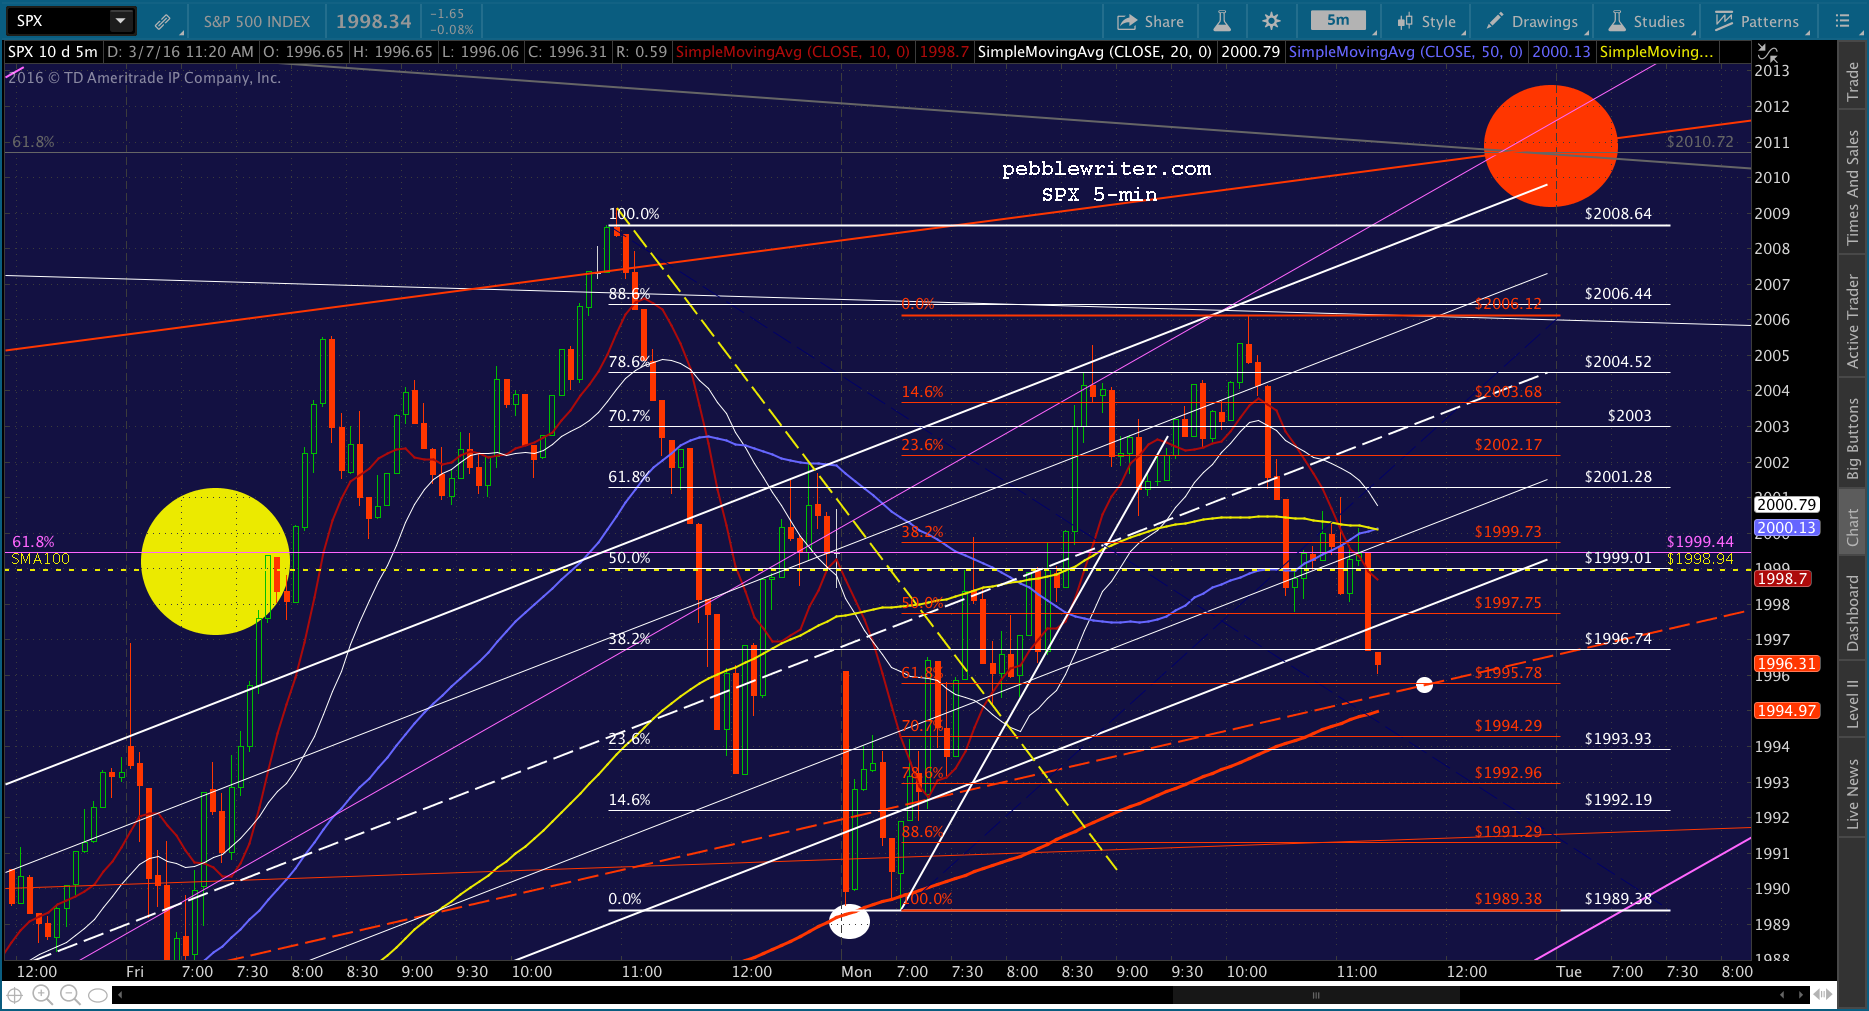
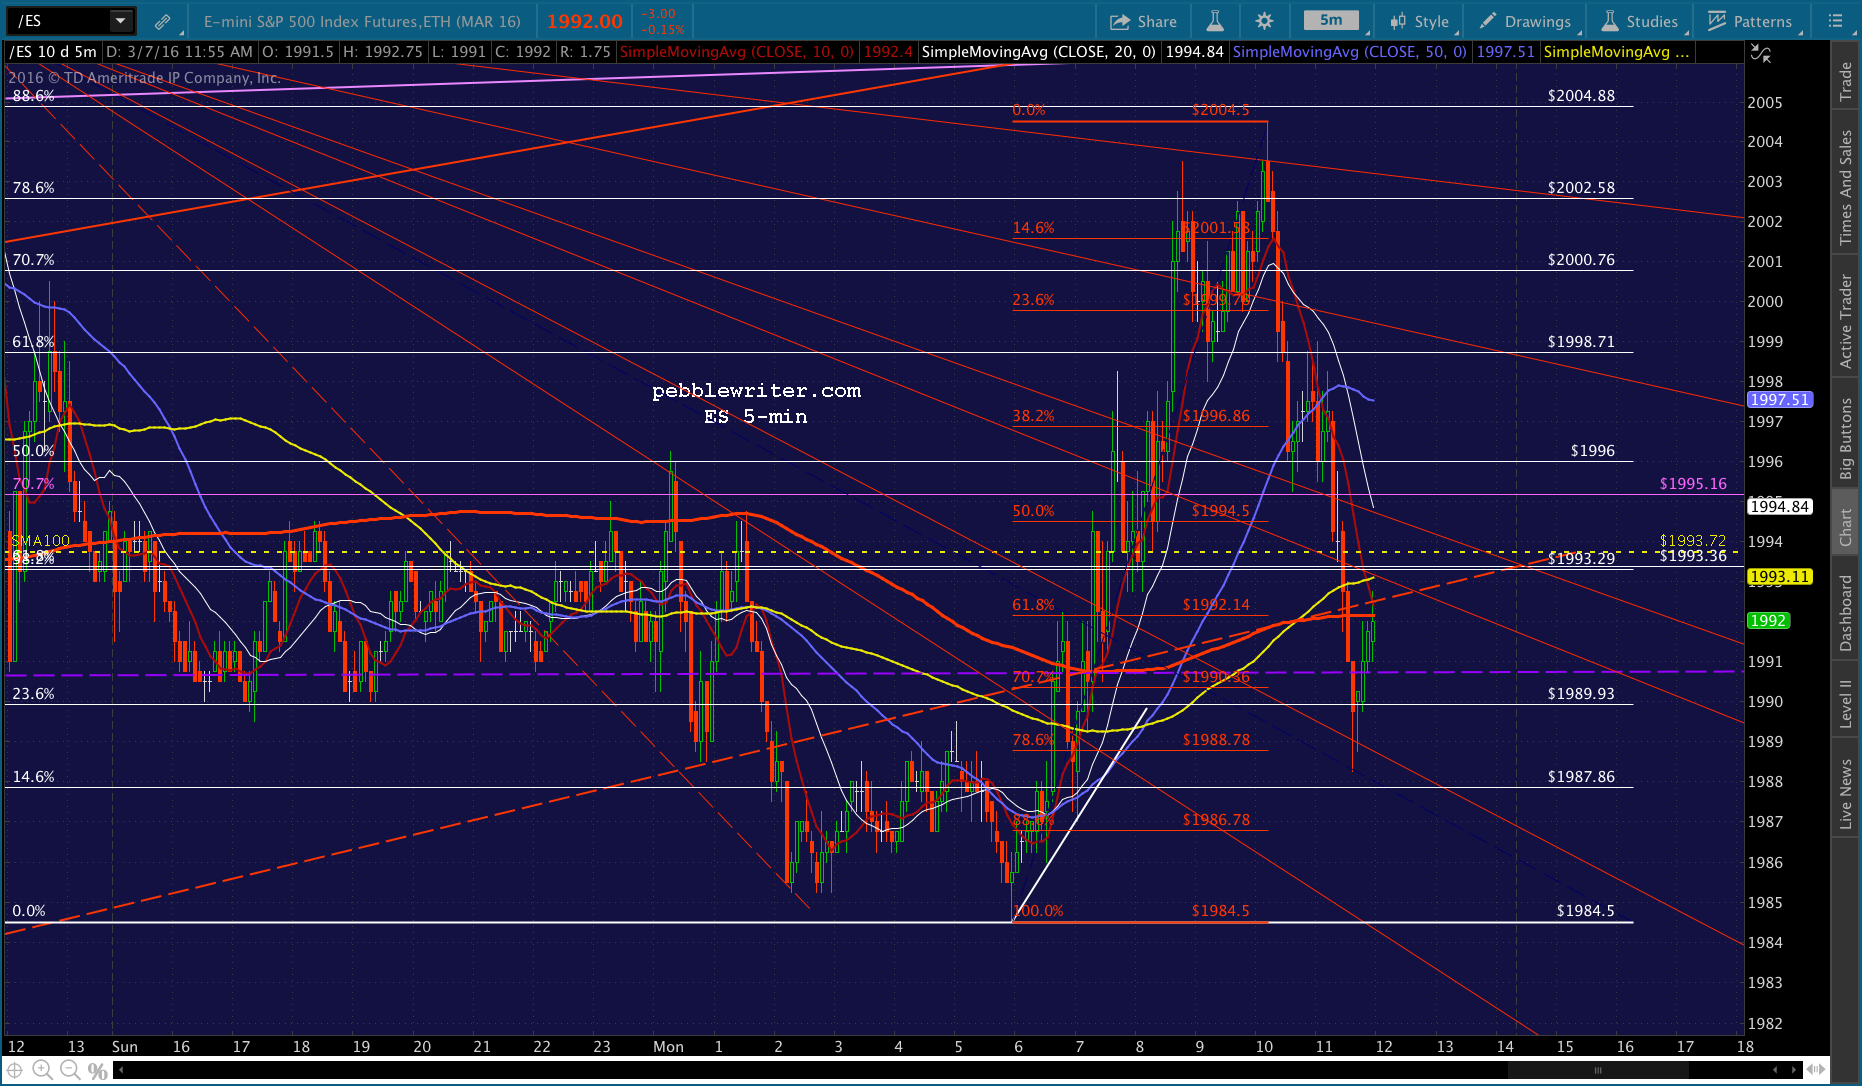
 It should be enough for SPX to test the white channel bottom at 1992. And, if CL doesn’t immediately rebound, maybe even enough to test the SMA5 200 currently at 1989.19.

 There’s a lot more potential downside to SPX. But, we just never know when CL is going to start soaring in order to prevent it. And, so far at least, there seem to be no limits to the CL ramp jobs. It will cause economic hardship to many, but that’s just not as important to policy makers as the damage done to stocks if CL wasn’t rallying like a bat out of hell.
UPDATE: 9:34 AM
SPX just tagged 1989.52, probably close enough. We should get a rebound here as CL is popping. But, I wouldn’t go long unless it can push back above the white channel bottom. Until then, it’s a backtest.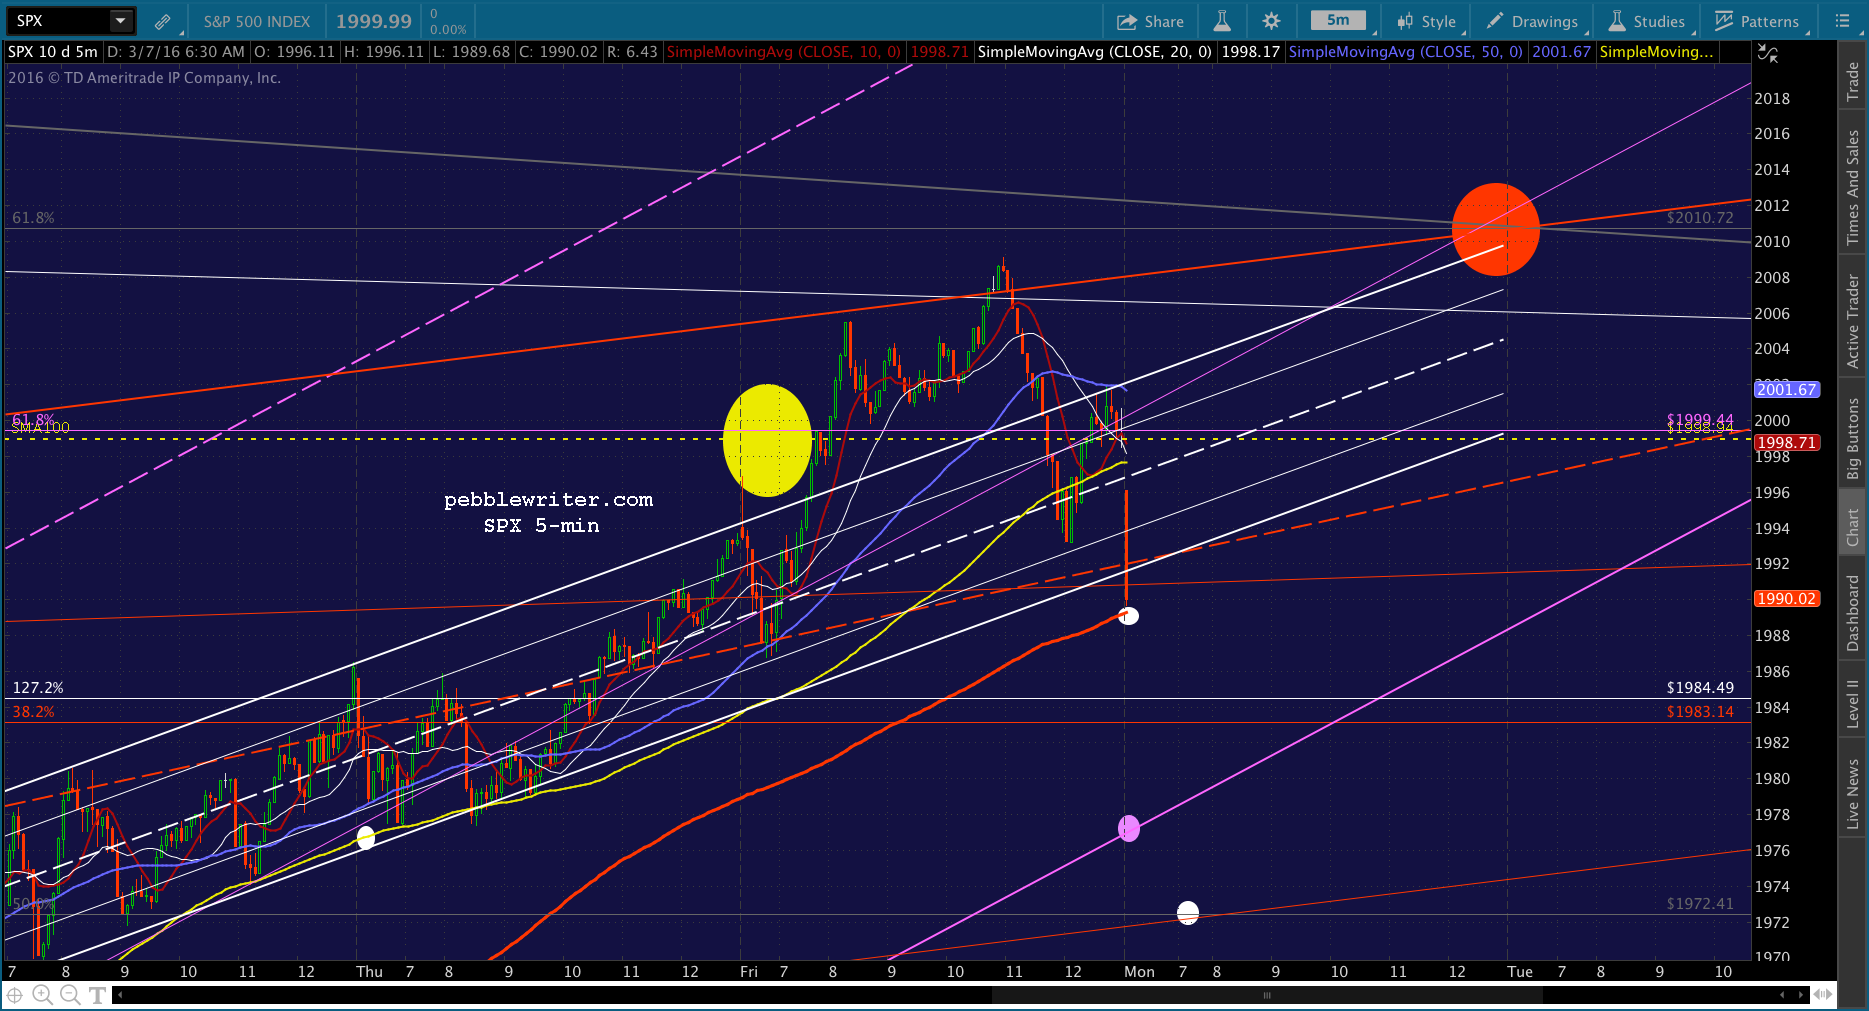 UPDATE: 9:40 AM
I can’t stress enough how dangerous this trading environment has become. ES just reached a very obvious turning point — a backtest of a major channel midline (dating back to 2014), its SMA5 200 and a minor TL. It should have reversed immediately.  But, CL popped above a TL dating all the way back to last night (sarc) and suddenly ES popped right through that resistance.
  Two minutes later, and CL reversed back below its TL and ES has executed a pretty nasty head fake. Then, sixty seconds later, and CL is pushing back above it and ES is back above the resistance.
In other words, it you’re trying to trade based on the things that are moving the indices, those things are moving so wildly and so randomly that it confirms HFT’s (not just the algos) have taken control of CL and are whipsawing it around in order to fleece traders. It’s a very predatory environment.
In the few minutes it took me to write that, we get this… SPX tested and fell back from the SMA100 Friday. It also tested the .618 of the drop from 2116 to 1810. By all rights, it should drop to at least the .500 Fib at 1963 a 33-pt drop from the .618. But, right now, it’s having trouble dropping even 10 points before CL starts freaking out.
UPDATE: 9:58 AM
SPX just dropped enough to reach the (now higher) SMA5 200. CL was gracious enough to backtest the broken white TL — which permitted the tag.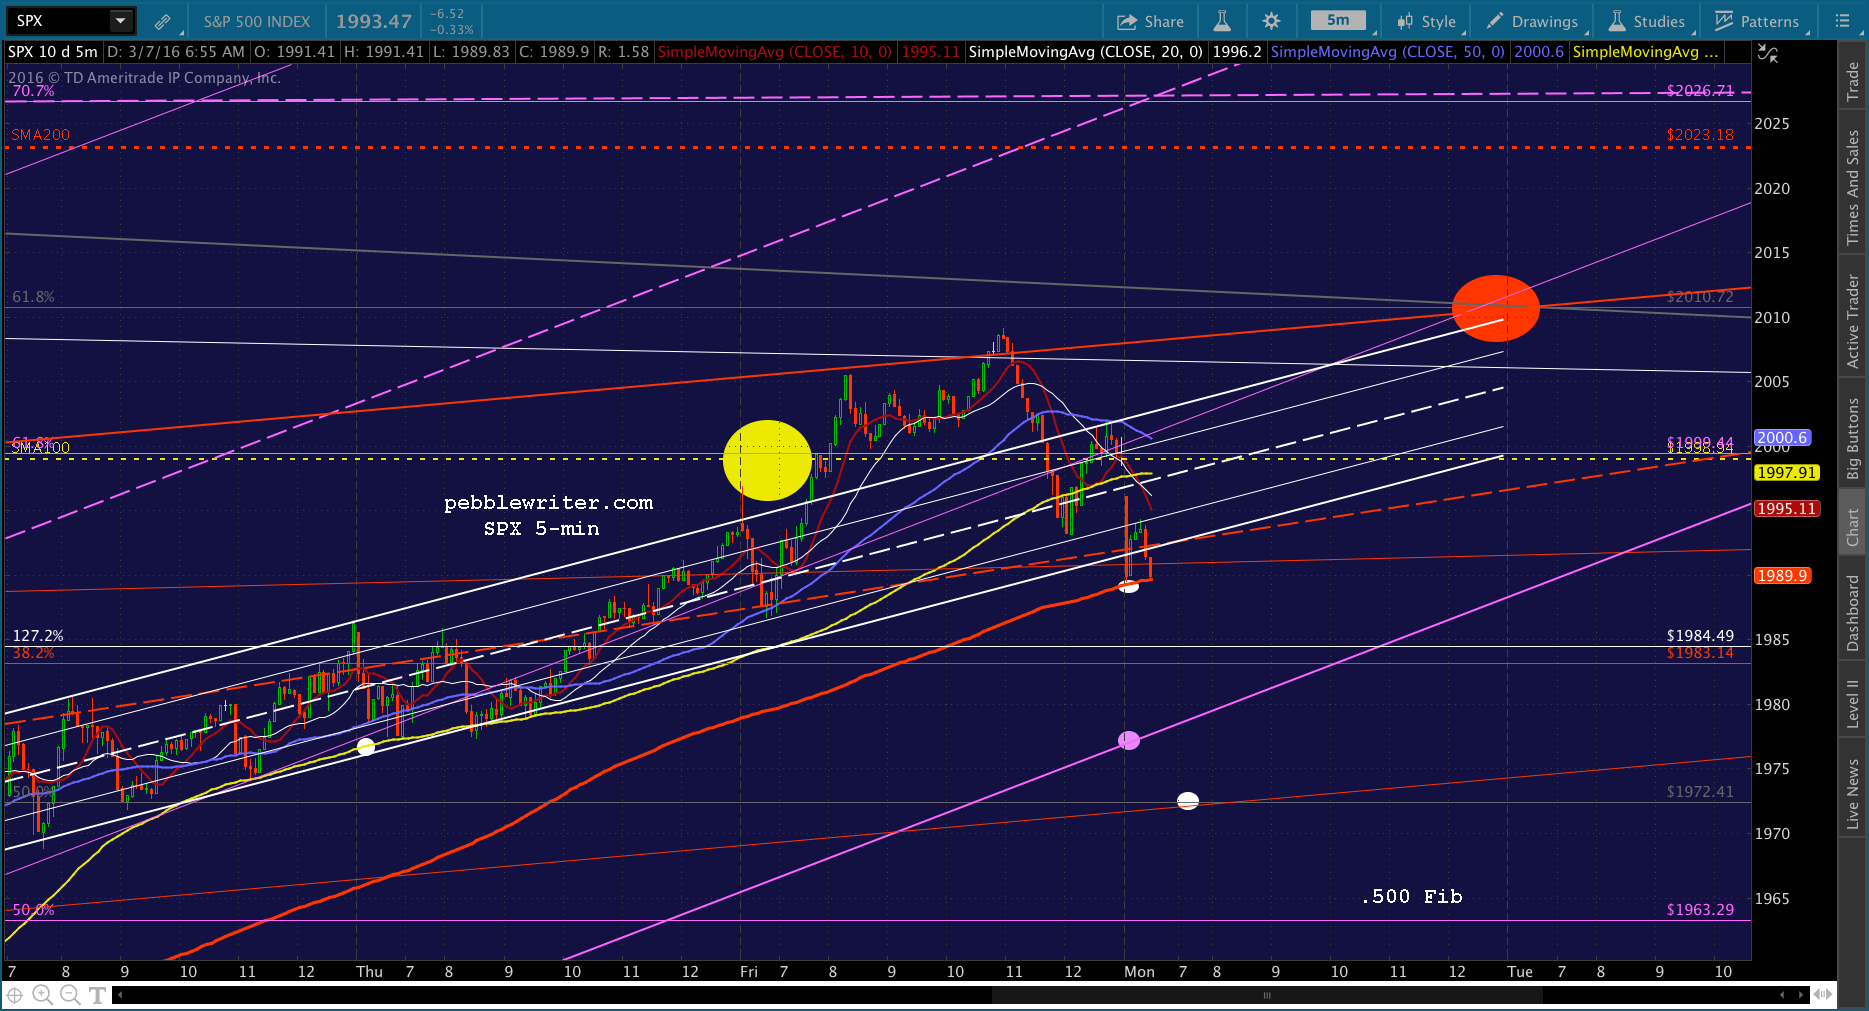 A continued plunge to 1963 would make sense here, but will CL allow it?
 UPDATE: 10:08 AM
If SPX is going any lower, this would be a logical spot. USDJPY and SPX have both reached SMA resistance. But, CL is making new highs — now up 7.2% from Friday’s overnight lows and 2.9% just this morning.

 UPDATE: 10:40 AM
Looking for a good entry here…will try shorting here at the SMA100 with a thought to pick up the SMA5 10 as it emerges from behind the yellow TL around 1995.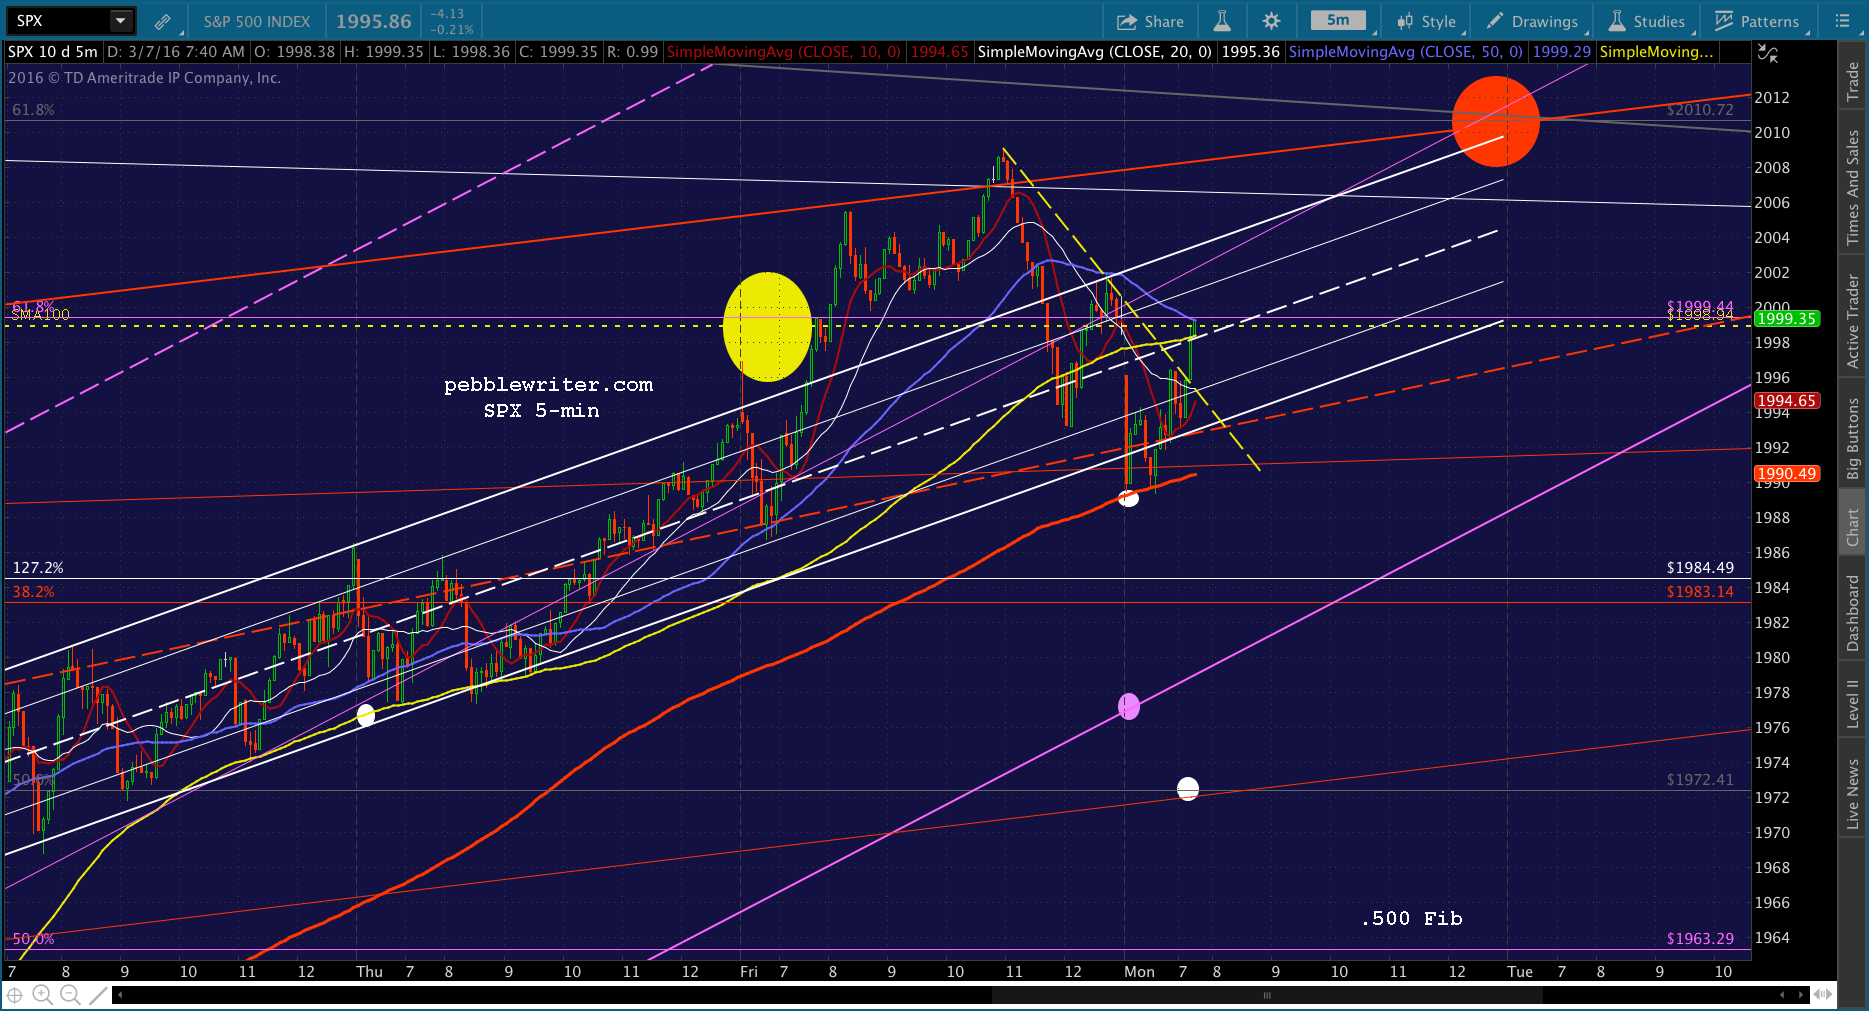 UPDATE: 10:54 AM
There’s the yellow TL and SMA5 10 tag. I’ll switch to long here with a goal of 2006/2010 — if it can get back through the white midline and daily SMA100 at 1999ish. Tight stops are recommended, as every chart other than CL is currently bearish. 

 UPDATE: 11:15 AM
SPX falling back at the SMA100. Back to cash here. It might be just waiting for SMA5 10 to catch up. If so, will go long again for push through SMA100. CL seems willing to allow lower, while NKD is perched at a reversa/breakout point.
 UPDATE: 11:20 AM
Back to cash at SMA5 10. Could resume climb, but CL and USDJPY aren’t showing it just yet. At some point, I’d expect the SMA5 20 to enter the picture as support. But, currently, it would mean giving up the white TL.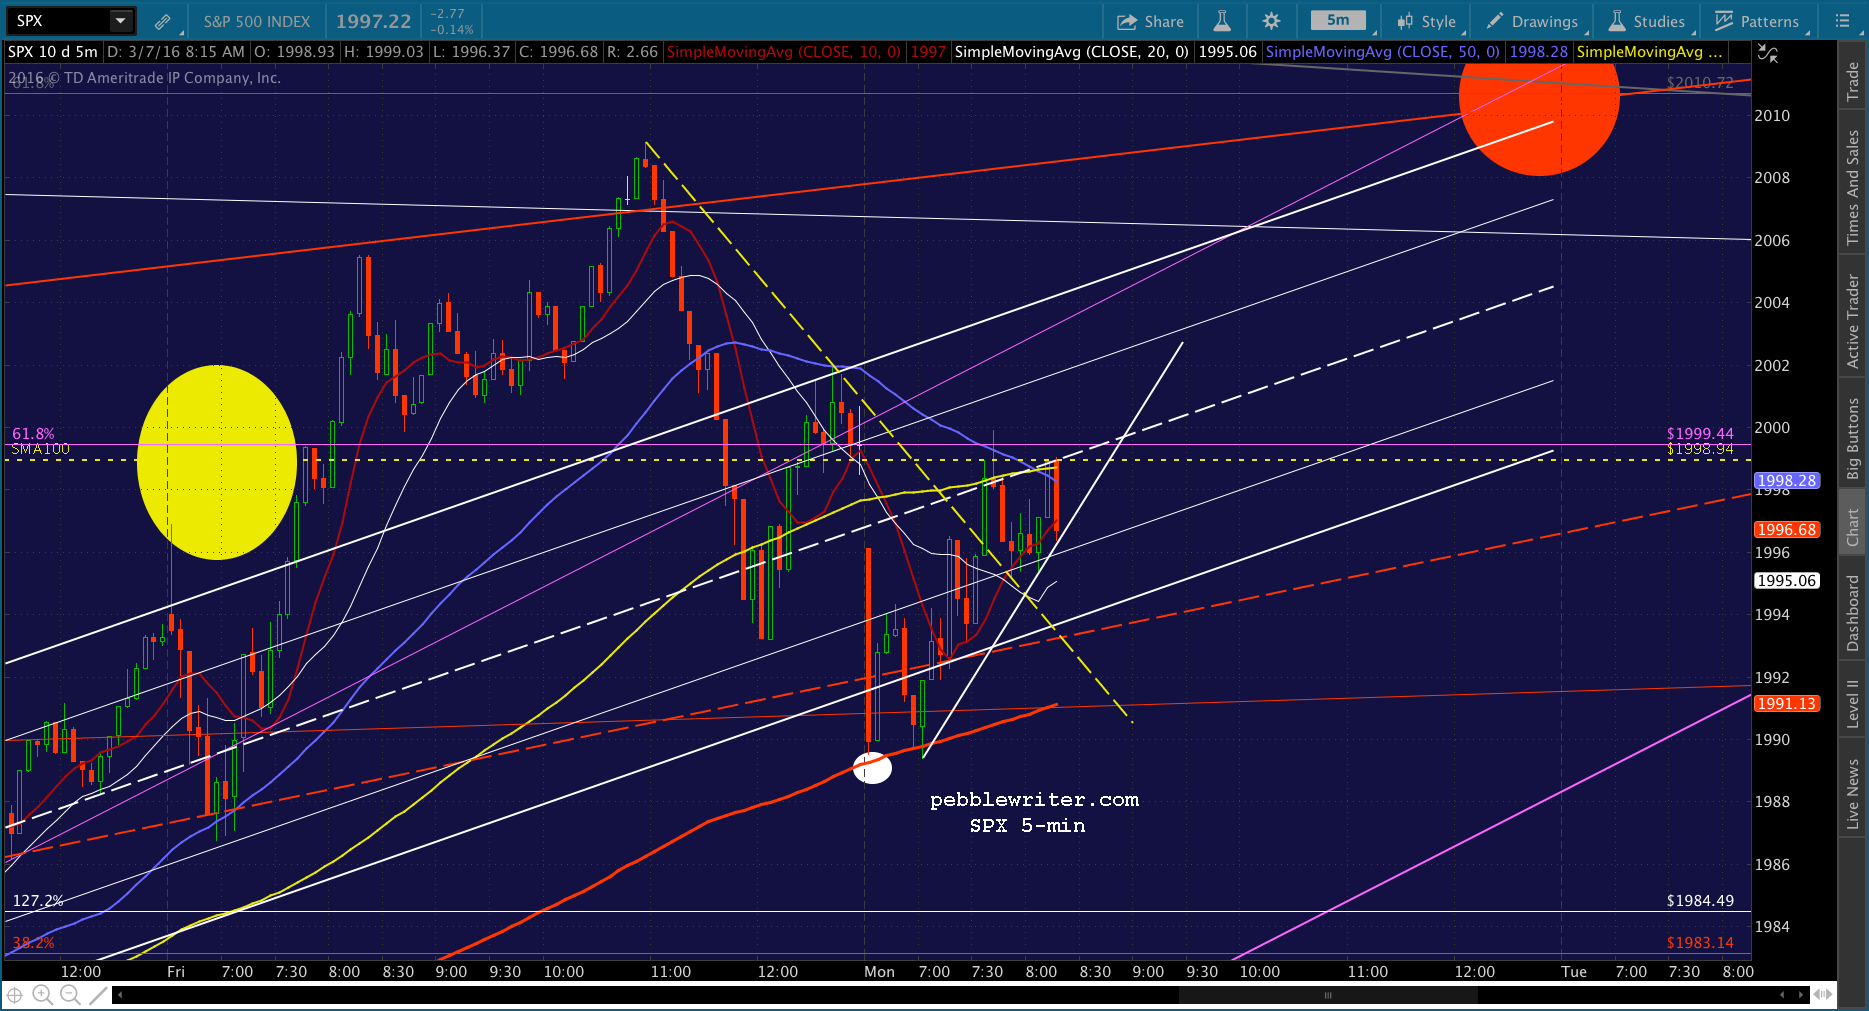 I have to step away for a few. Should be back in 10 minutes…
UPDATE: 11:38 AM
SPX breaking out. Next upside goal is 2006.5, followed by Fib at 2010.72. Could get a backtest of 2000 first. UPDATE: 11:48 AM
We should see SPX settle back here and give the SMA5 10 a chance to catch up. It’s at the purple .236 channel line and the white channel top, which will matter only if CL backs off. But, NKD has more upside potential — probably to its falling SMA5 200. And, CL is making nominal new highs. So, I can’t get excited about shorting at the moment.
 UPDATE: 1:32 PM
SPX just dipped down to backtest the SMA100 USDJPY and CL are losing ground, so it’s likely to go further. I thought it would bounce here, but so far USDJPY and CL are showing additional weakness. Maybe going for ES SMA100 at 1993.72?  UPDATE: 2:03 PM
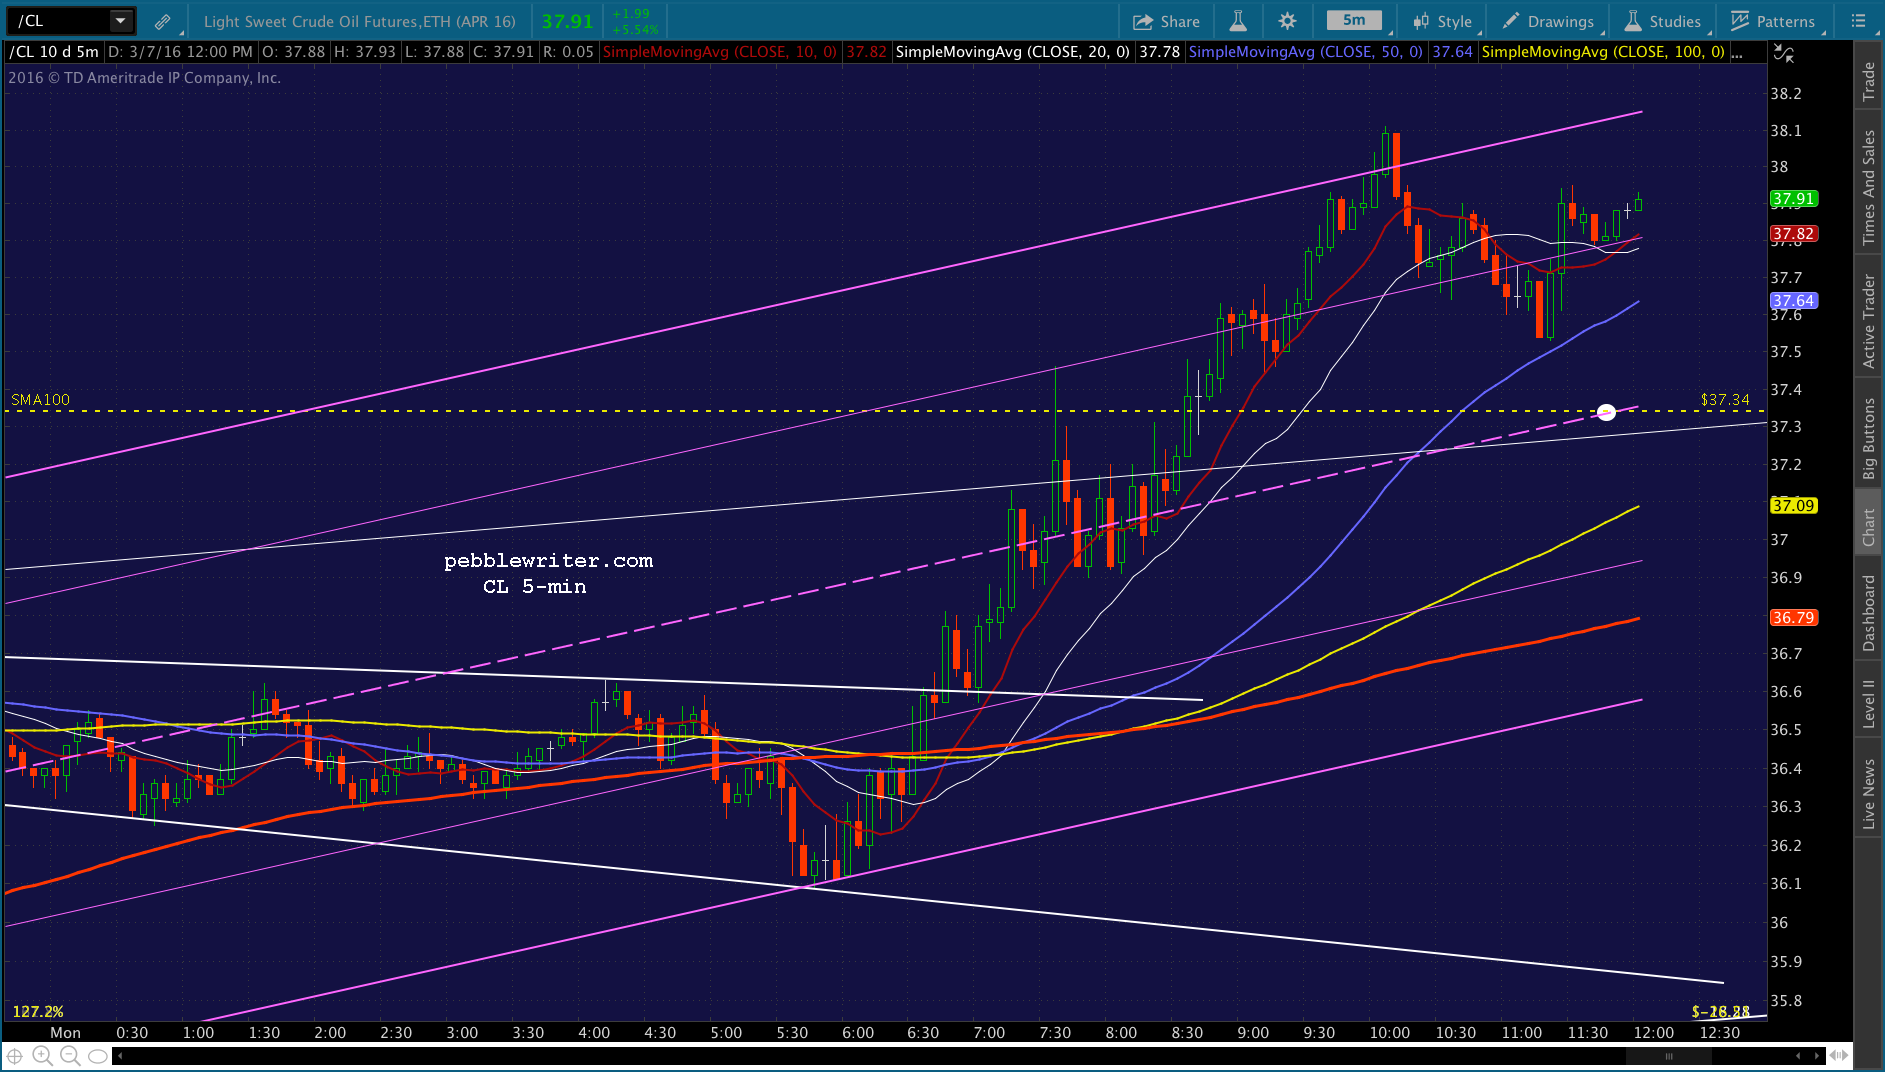
I think CL is backtesting the SMA100, so I’ll try a short position here at the SMA5 100 and see if we can’t get down to the SMA5 200 or even the red .786 or .886 here.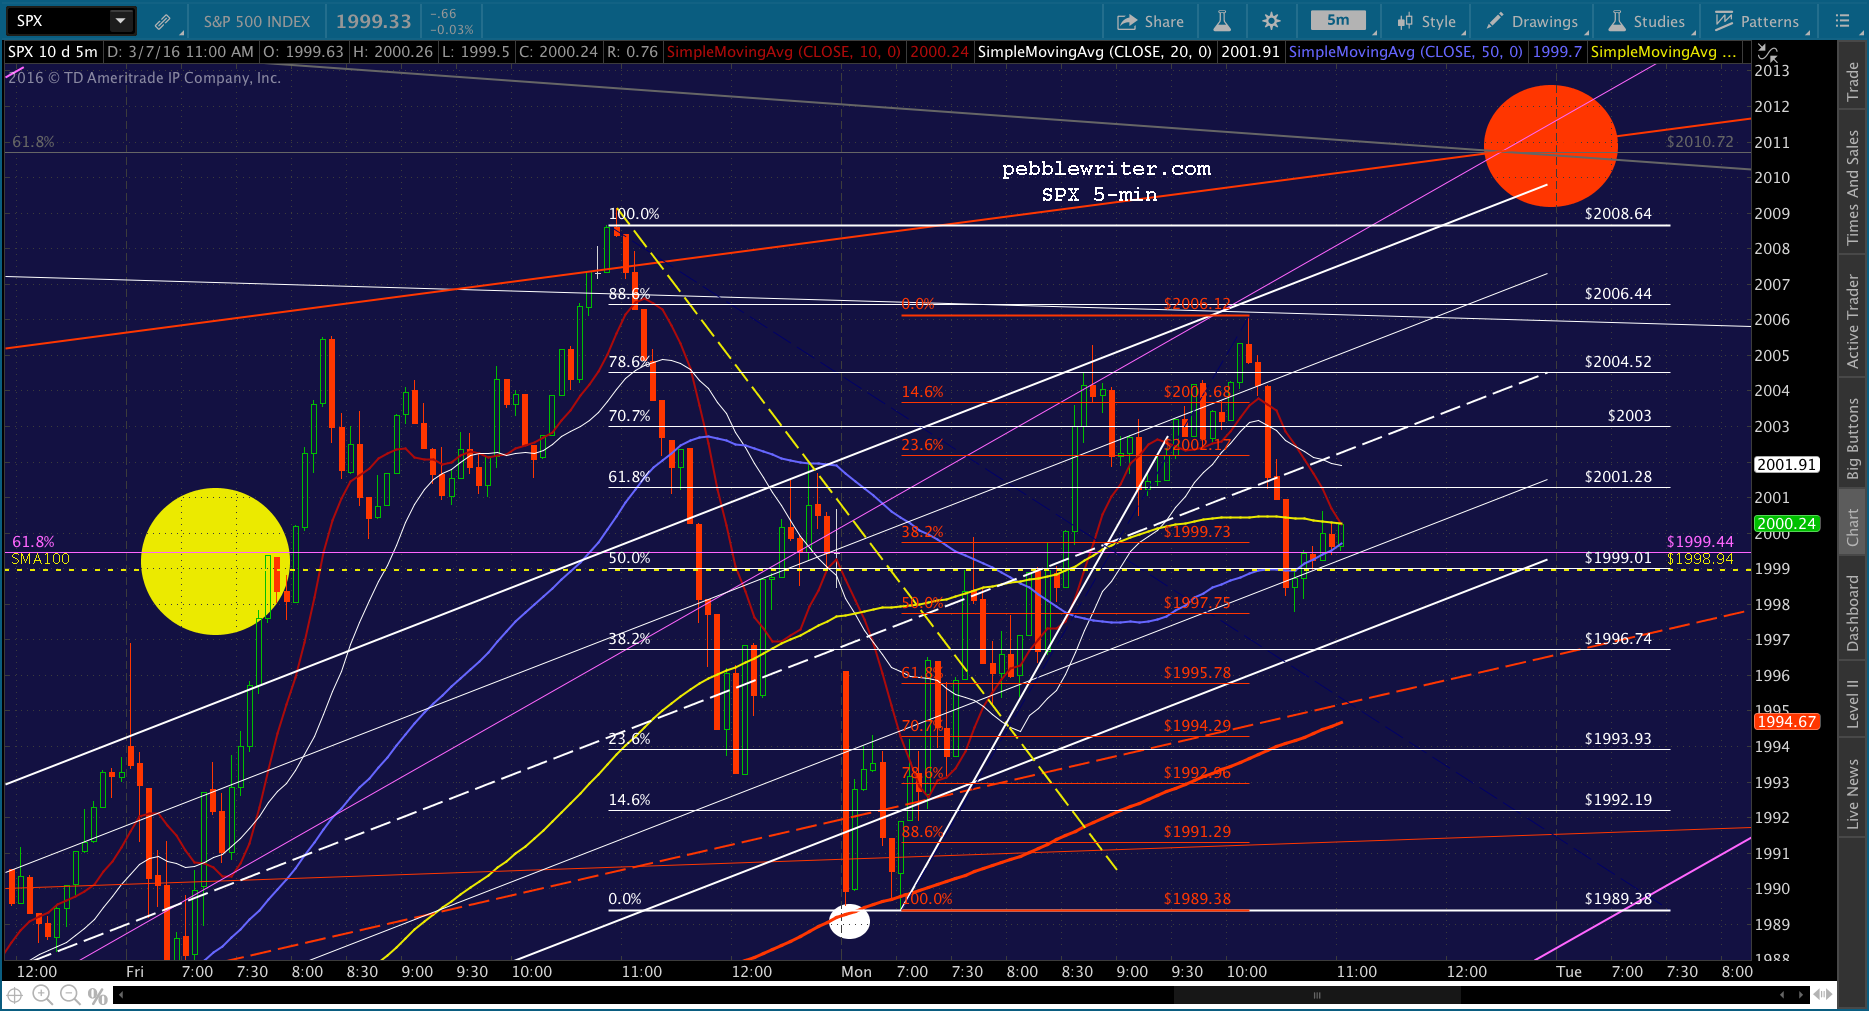
 Looks like 113.35 or 113.24 for USDJPY.
 Maybe shooting for 1993.72 for ES?
 UPDATE: 2:13 PM
Here’s kinda what I had in mind…ideally around 2:45. Could be targeting a little lower, depending on timing. Another SMA5 200 tag on SPX would correspond with one on ES.
 It all depends, of course, on where CL stops. I like the SMA100 at 37.34 for a backtest and bounce into the close.
 UPDATE; 2:21 PM
ES just reached its SMA100 and seems to be reacting. Back to long here, but will watch for signs of it being merely a bounce on the way to 1995.78 or lower.

 USDJPY suggests a bounce here.
 UPDATE: 2:25 PM
Slipping lower, back to short. Obviously, it could turn at the SMA5 200 or red TL, so watch your stops. UPDATE: 2:27 PM
ES and SPX bouncing big. CL is reversing, too. Back to long here.
 UPDATE: 2:33 PM
Stocks not buying the CL ramp this time. Back to short. UPDATE; 2:41 PM
Should get a bounce of some kind here at red .886, but a drop to purple channel bottom would make more sense in big picture. UPDATE: 2:45 PM
I think we’ll get a bounce up to the SMA5 200 now at 1995.54. Back to long with tight stops, as CL isn’t doing much to prop things up and a corrective A-B-C to test the purple channel bottom (1884-1886) would actually be beneficial to the bulls. Note the completed H&S (white neckline.) It targets 1972ish.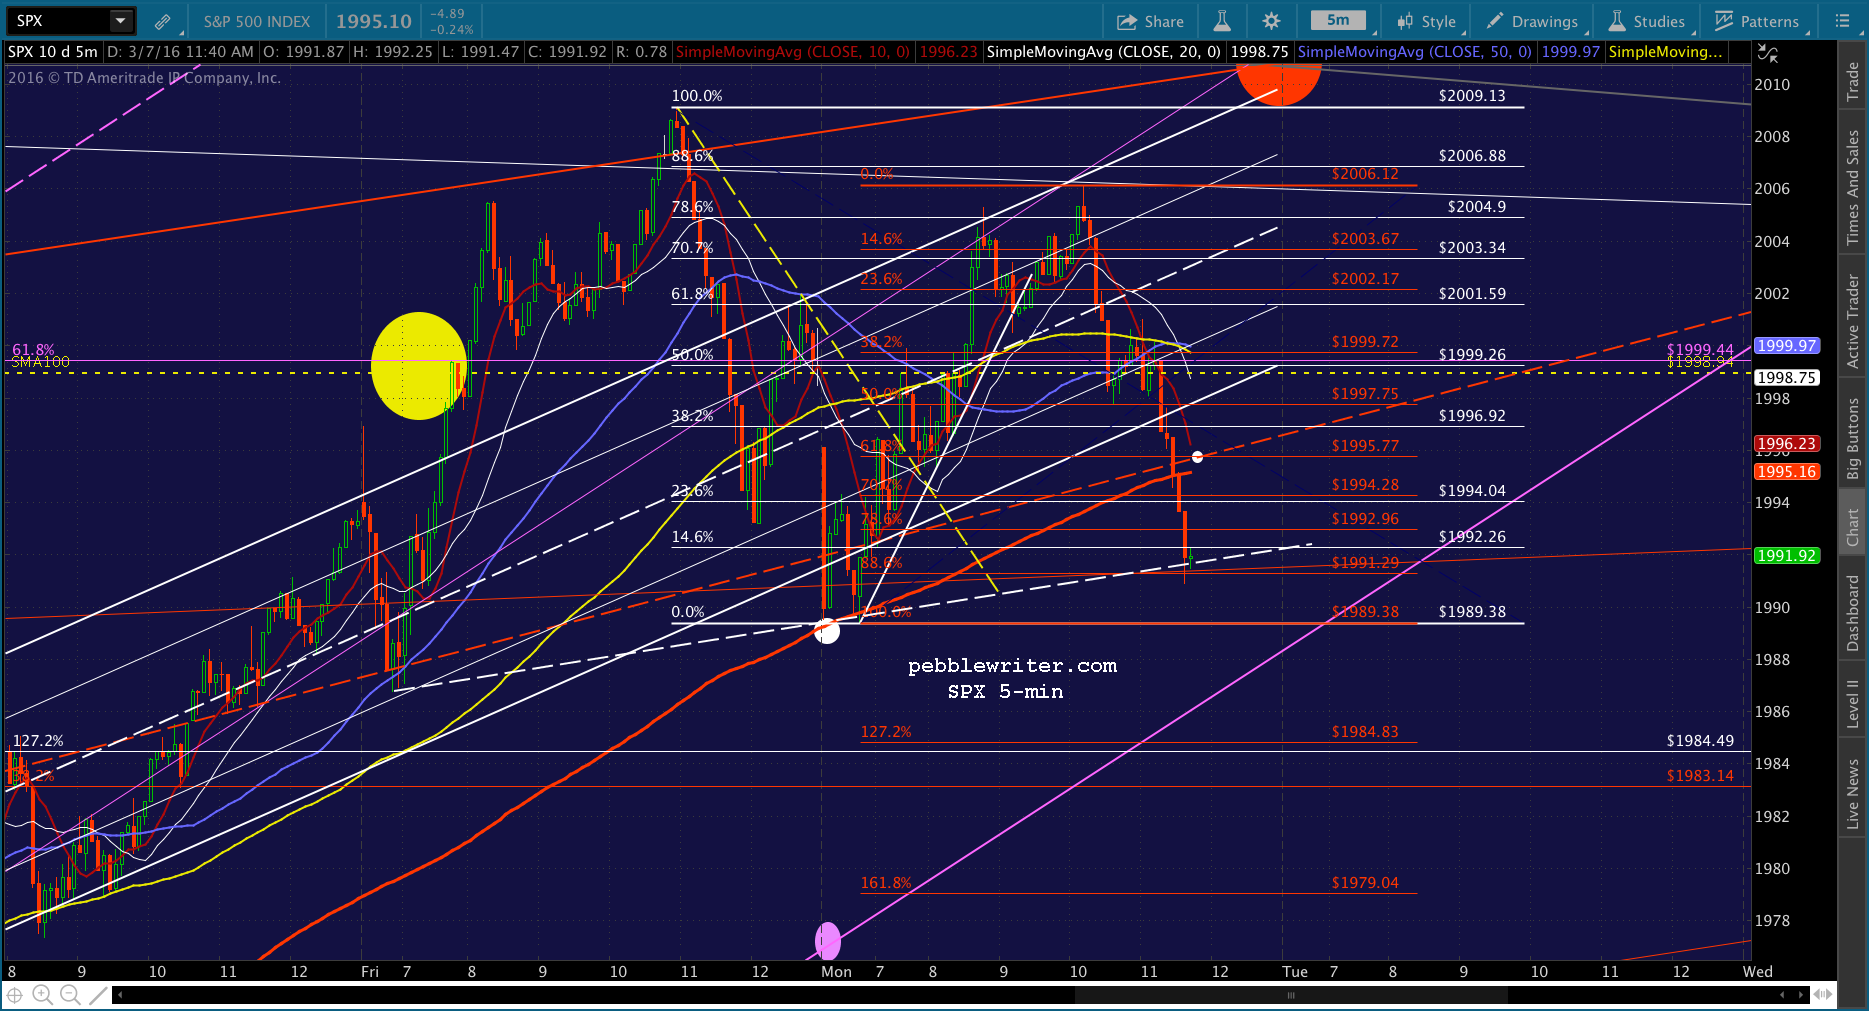 Watch CL, though, as a drop to the SMA100 would undo any bounce real fast. However, they might wait until after the close.
 UPDATE: 3:00 PM
USDJPY dipping below .886, so I’ll revert to short here as SPX reaches its SMA5 10. Just be cautious, as CL is easing (not spiking!) higher.
 UPDATE: 3:07 PM
CL just broke above a little TL and is making trouble for the downside. I’d take profits here and move to the sidelines.
 UPDATE: 3:17 PM
SPX testing the red SMA5 200 and SMA5 20 on USDJPY bounce. Would try shorting again into the close if it reverses here. If it pops though, long would work nicely.
 UPDATE: 3:23 PM
Topped and is backtesting SMA5 20/200. Should move higher, but CL not being much help here. Back to long, and we’ll see if there’s a melt up into the close. Odds are, it’ll get back to the SMA100 and stall. This is one of the uglier charts I’ve seen in the past several weeks.
UPDATE: 3:30 PM
Backtesting SMA100 and the white channel bottom. It can’t seem to make up its mind. If it pushes above, at least we have a solid stop point. One possibility that just occurred to me is a triangle at 2004.50ish. UPDATE: 3:39 PM
The triangle mentioned above… UPDATE: 3:47 PM
Slipping back below the SMA100. Back to cash here. I’d short on any sustained move below the SMA5 10 at 1998ish and revert to long on any push back through the SMA100 at 1998.94.
UPDATE: 4:00 PM
If you look at a 1-min chart for SPX, that’s about 30 tags at or moves through the SMA since Friday morning. I think the triangle is probably the most likely pattern at this point, with a likely reversal up at 2004.50 tomorrow morning, and continuing consolidation through Thursday’s ECB announcement. As I wrote earlier today, these are very difficult charts to trade. If that’s what it is, it hasn’t helped that the bottom tags have requited double tags with very truncated 5ths. It happened twice today, with 1989.52/1989.38 this morning, and 1990.92/1990.84 this afternoon!
The triangle isn’t that big, so a reversal at 2004.50 would produce a move down to only 1992. And, it would continue to oscillate less and less as Thursday approached. We’ll give it a try if it gaps up to 2004.50 in the morning.
I’ll try to post more later.
Comments
5 responses to “Charts I’m Watching: Mar 7, 2016”
Some web sites determine that the recent bounce of CL is caused by short covering. Can this the true reason, or it is only pure manipulation on CL to drive up SPX?
Looks like another close below 2000 and is still a major resistance level for SPX. What are your thoughts on this?
nevermind…
could you please state the prices the sma’s are when they might turn I really get a better grip when I know where the level is instead of trying to decipher the chart to make a quick assessment. This late day trading is tumultuous to say the least. thanks in advance
Pebble, what are possible targets for this leg down (1:28pm)? ..or are we looking at another head fake?