

SPX reached our secondary target at 2110.48 Friday — two sessions ahead of schedule. Per our Mar 17 forecast (members’ section):
Assuming SPX can get past the SMA20, the midline also intersects with the broken purple channel bottom for a backtest Thursday morning at the red .786 (or next Tuesday the 24th at the .886 at 2110.48.)
 We recommended taking profits at this level Friday. In addition to completing the small Bat Pattern, SPX has backtested the broken purple channel. Of course, bulls would love nothing more than to barge right back into it as has been done with many V-shaped “recoveries” over the past year or two.
This morning, USDJPY is nearing the white channel bottom with support around 119.61 (and secondary support at 119.44)… …while CL was eased down overnight to its trend line support.
 The damage done to DX isn’t dinging stocks…
 …thanks to EURUSD’s continuing bounce.

Note that EURUSD is nearing completion of a Gartley Pattern at 1.0949. Regardless of whether it reverses, EURUSD’s strength since bottoming at 1.0462 on the 17th has to leave ECB easing fans wondering — if not worrying.
DAX’s spectacular 28% run (from Jan 5) leveled off on Mar 16, when EURUSD’s slide was interrupted in order to save SPX from declining any further. If the euro resumes falling, however, that task will revert to USDJPY and CL — both of which have managed to boost SPX during the day (sometimes taking turns) while resetting overnight.
Thus, neither is really going anywhere. But, the benefit to SPX is nevertheless positive. It begs the question: “how long can this go on?” The answer, as is often the case, lies in the past.
continued for members…
Regular readers have seen this long-term chart of USDJPY vs SPX many times.
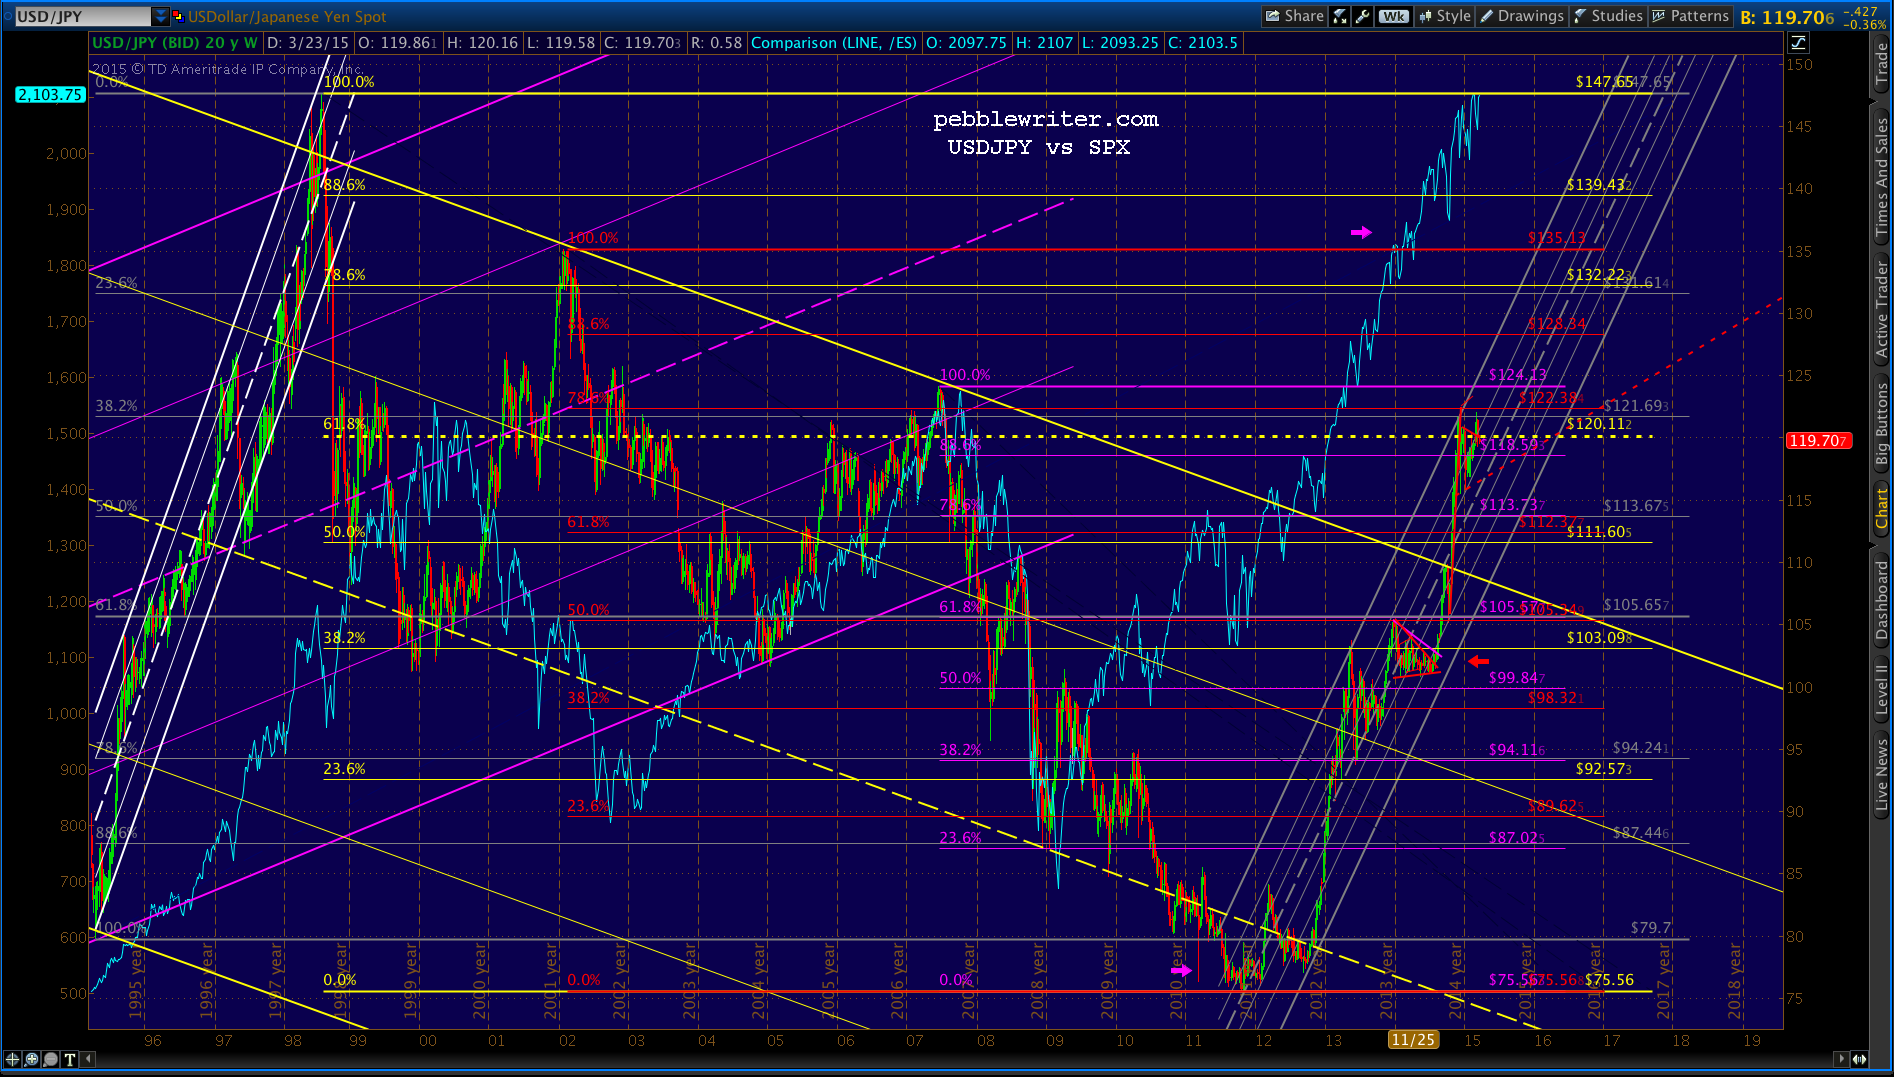 And, most will remember the 2014 triangle (red arrow) in the months after USDJPY single-handedly levered SPX up past the Butterfly Pattern completion at 1823 (purple arrow.)
The close-up below shows SPX’s 110-pt slide following USDJPY’s arrival at a major reversal point. The slide was arrested by USDJPY’s support at 100.74 and the rising channel (in red) that enabled SPX to make a series of higher highs in March, April and May.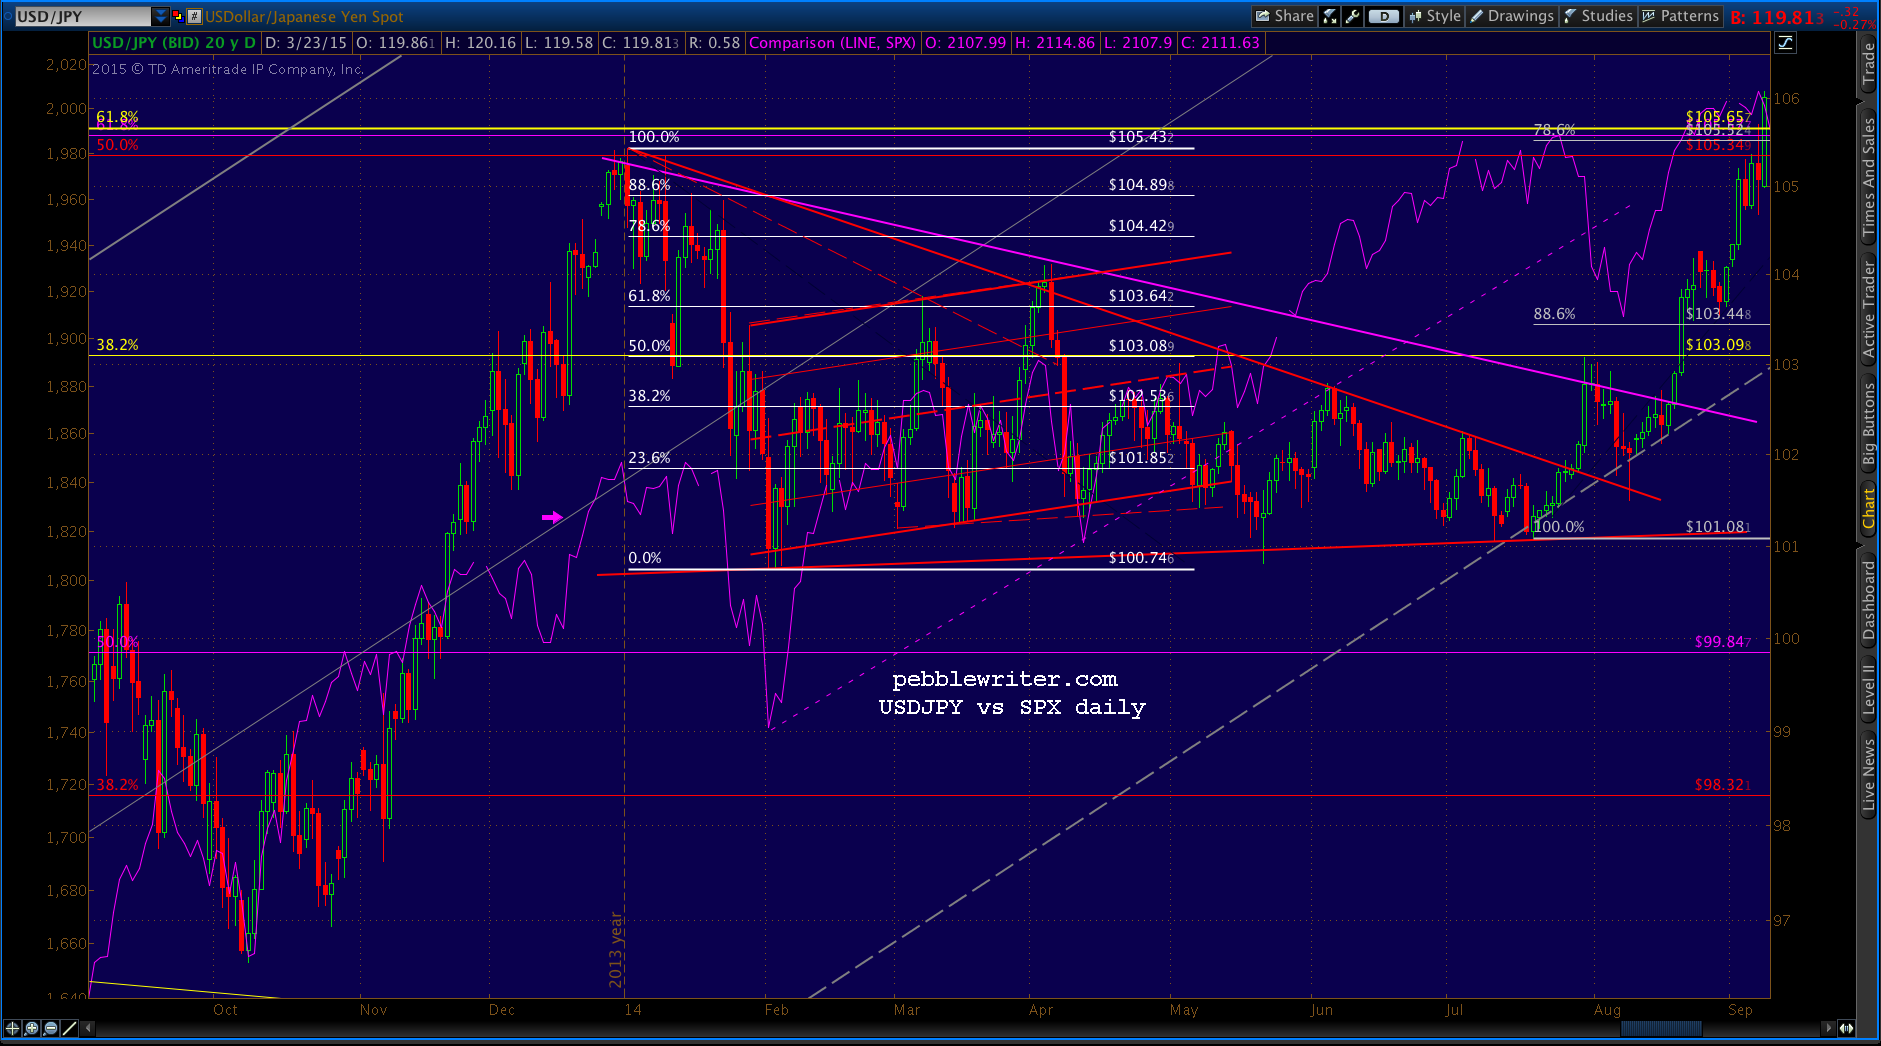 It faltered in late May, but never broke the Feb 4 low. Later, in July, it faltered again but was propped up at a TL off the Feb lows, only to break out a few days later — again, in order to save SPX when it had broken an important trend line (dotted, purple.)
DX’s corresponding breakout has closely paralleled that of SPX. It’s this chart that will likely keep the bulls in charge for a while longer.
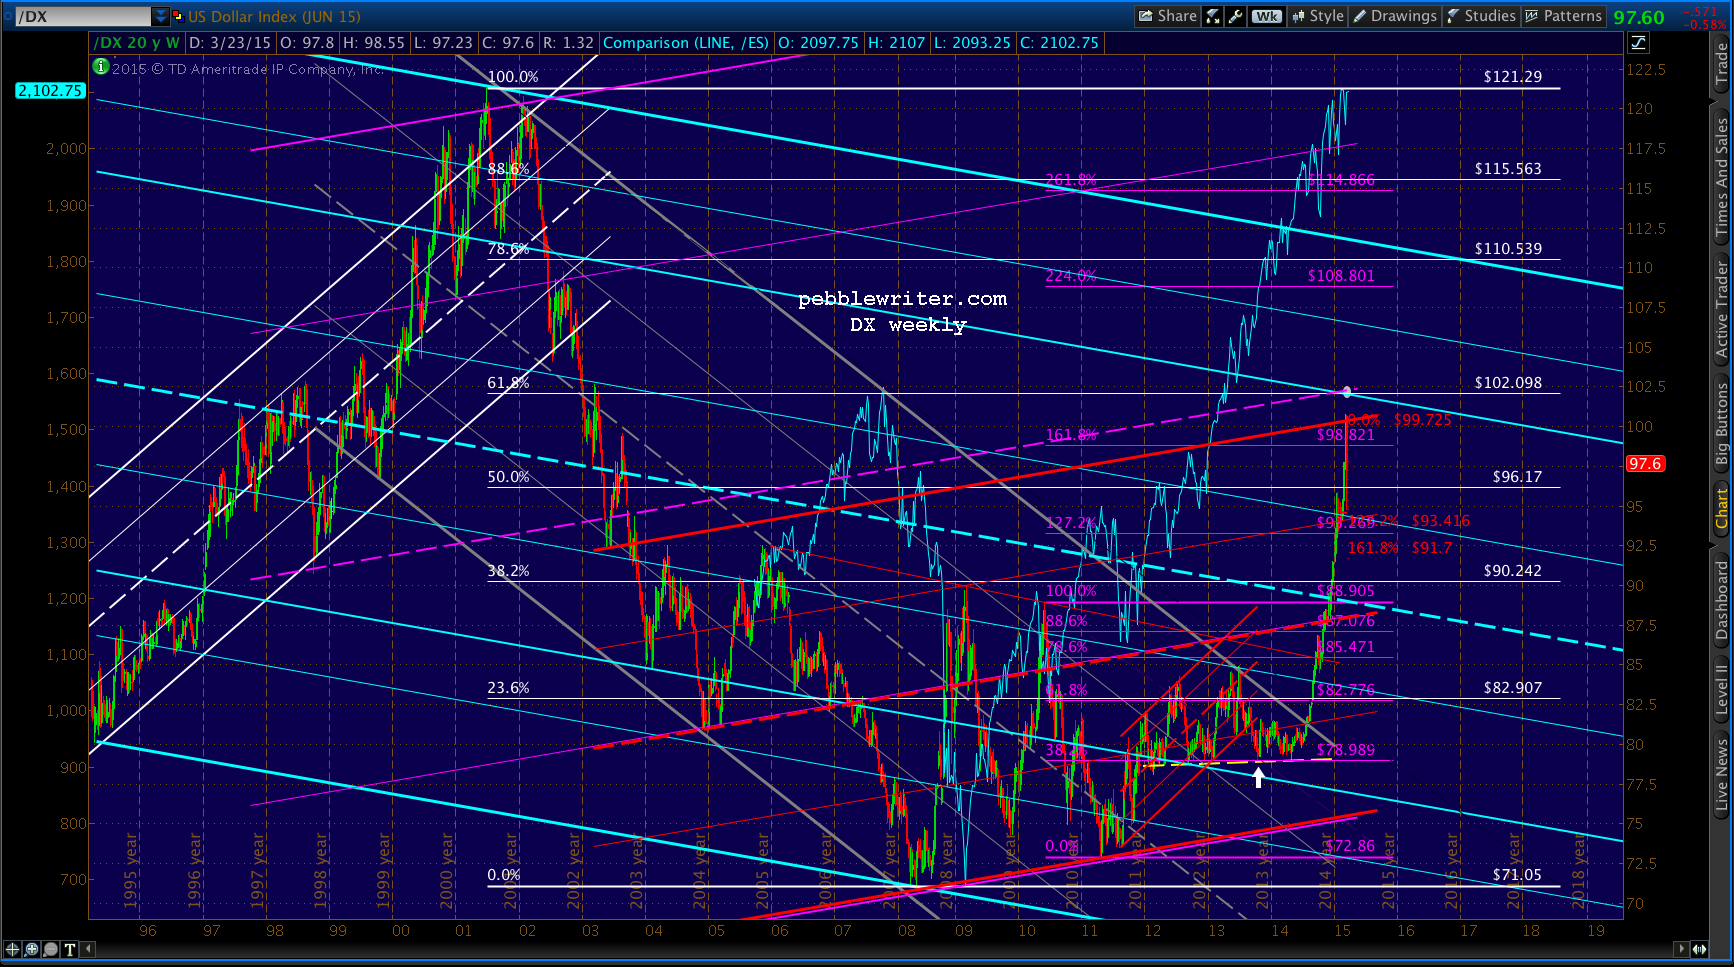 I can make an argument that DX has suffered some technical setbacks over the past week or so. But, the white .618 is still a bit higher at 102.098. The purple midline looks to cross it later this month or early April.
Seen in the context of CL, DX looks almost certain to fall further — probably as CL breaks out (or, at least sideways) from its falling channel.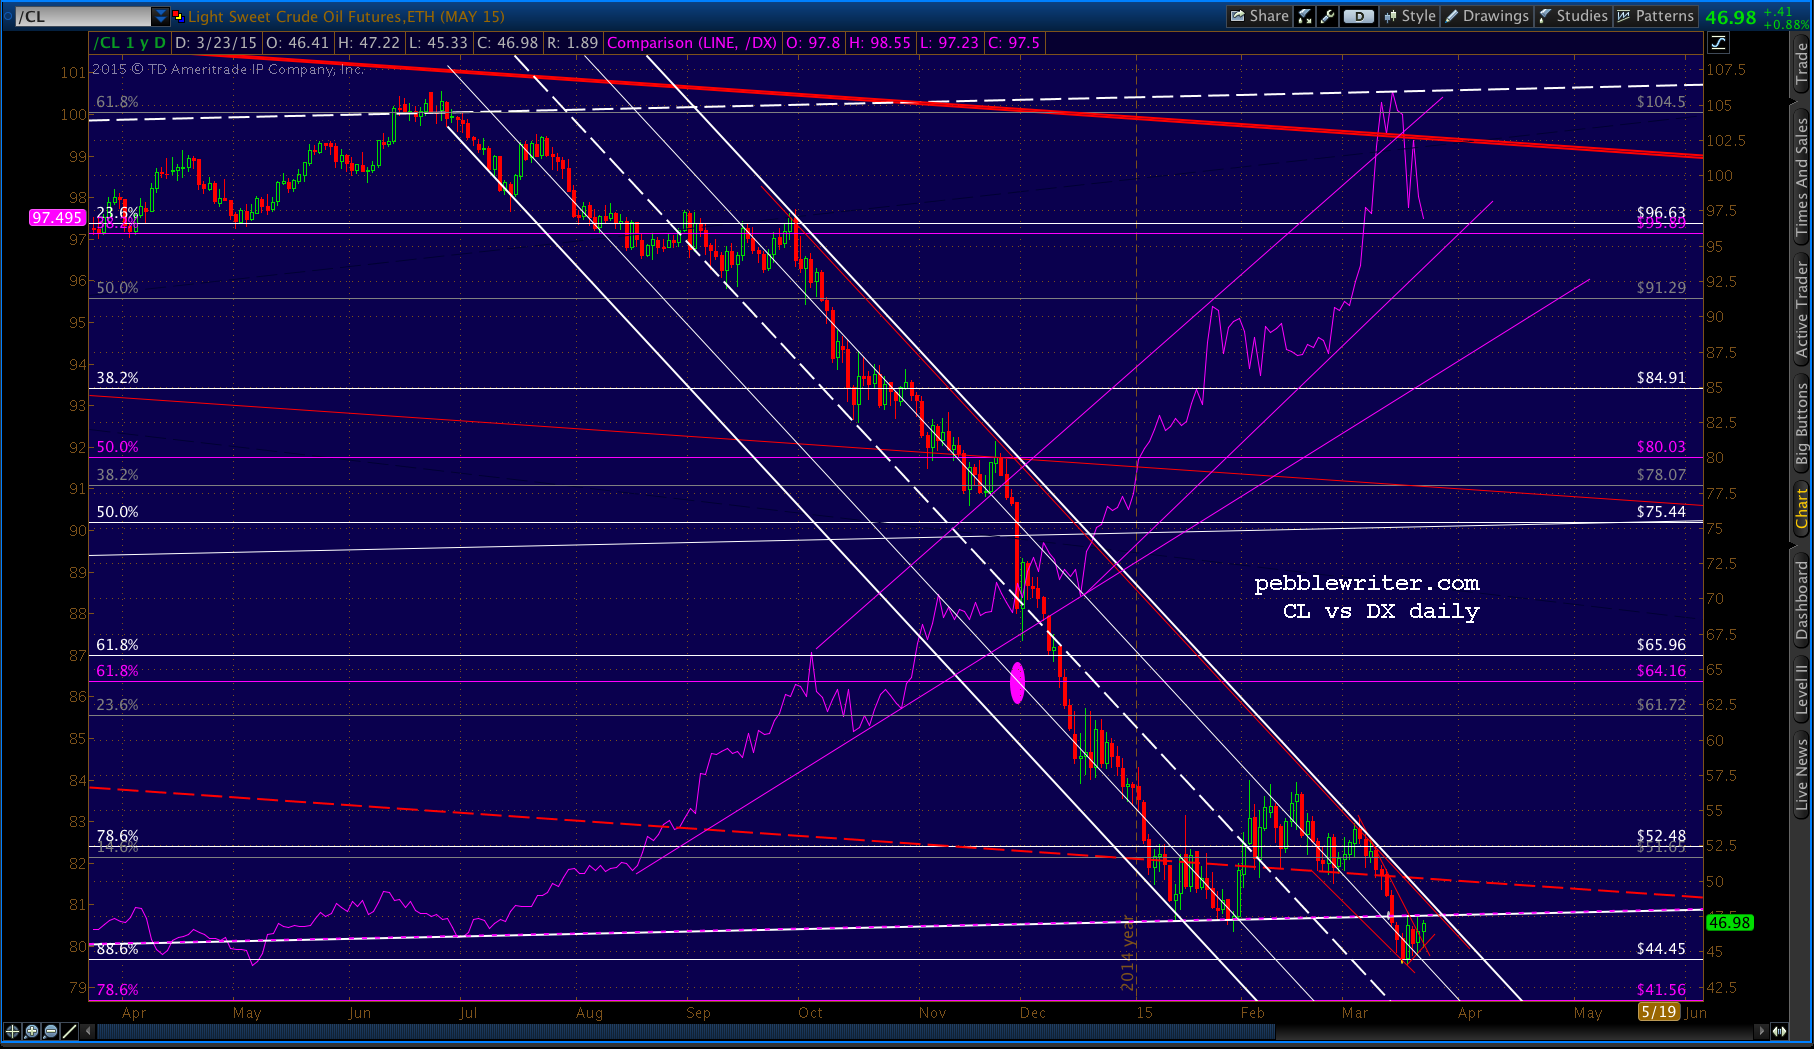 Who knows whether or not DX will reach/reverse at 102.098. But, as long as a major target is lurking out there, just above current levels, it’s hard to imagine the bulls ignoring the opportunity to ramp the “market” a little higher.
I’m not suggesting 2015 is just like 2014. But, there are a number of striking similarities — beginning with SPX’s 110-pt decline at the end of the year. And, note USDJPY’s sudden breakout on Mar 6 when SPX had declined a whopping (sarc) 3.5%.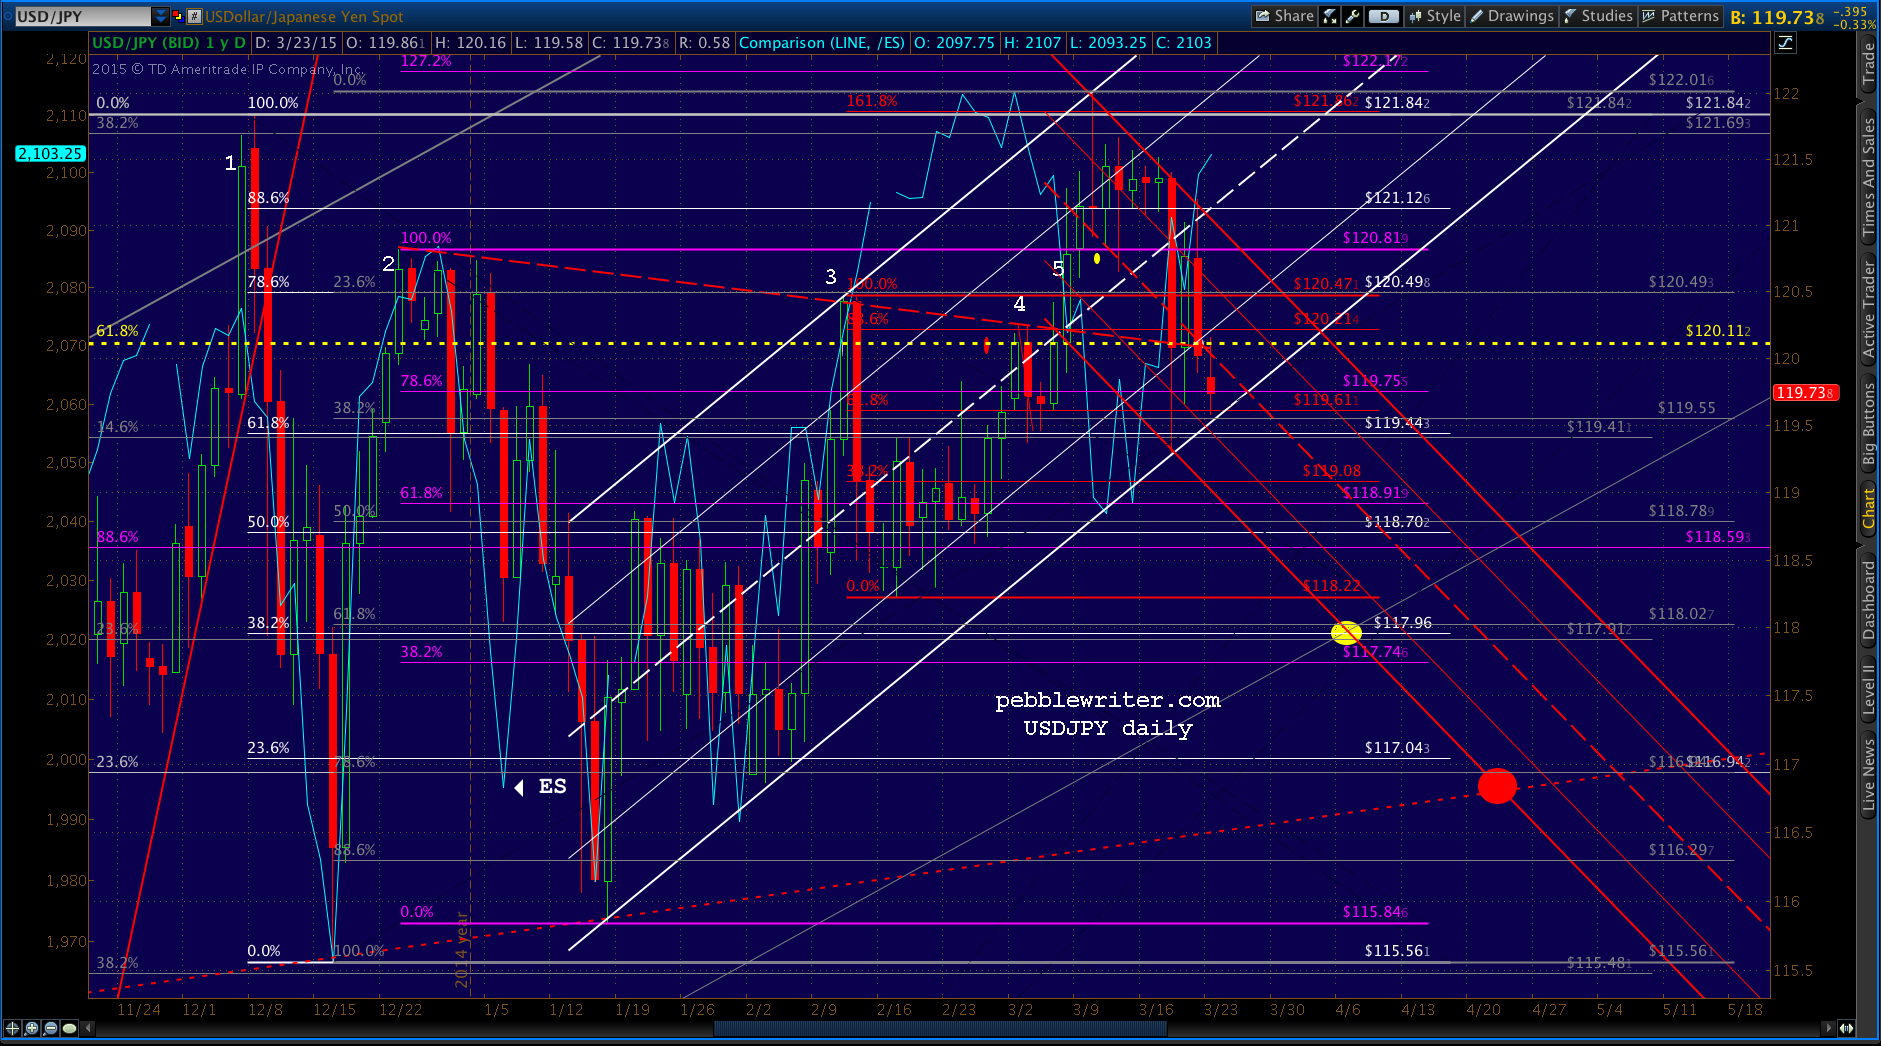
USDJPY is back below the important .618 Fib line at 120.11. And, it’s back below the TL from Dec 23 (point #2.) The well-defined rising white channel is being tested for the 6th time since mid-December.
Should it fail in the next day or two and follow the red channel lower, look for stocks to sell off. Euro-trashing doesn’t seem up to the task of driving stocks higher. So, it’ll fall to oil, VIX and bond market manipulation to keep the correction to a minimum.
If, on the other hand, it gets a nice bounce here at support and retakes the above-mentioned Fib and TL, then look for SPX continue inching toward our 2138 target.
As far as the immediate forecast for SPX, there are times when the picture is quite clear… and, other times when it’s muddled. This one is as muddled as they come. When prices don’t reverse at an .886, you have to decide whether: (1) bulls simply got a little overexcited (the normal state of affairs on OPEX) and a reversal was merely delayed; (2) whether TPTB intend to run prices right up through the previous high; or, (3) we’ll get instead a double top.
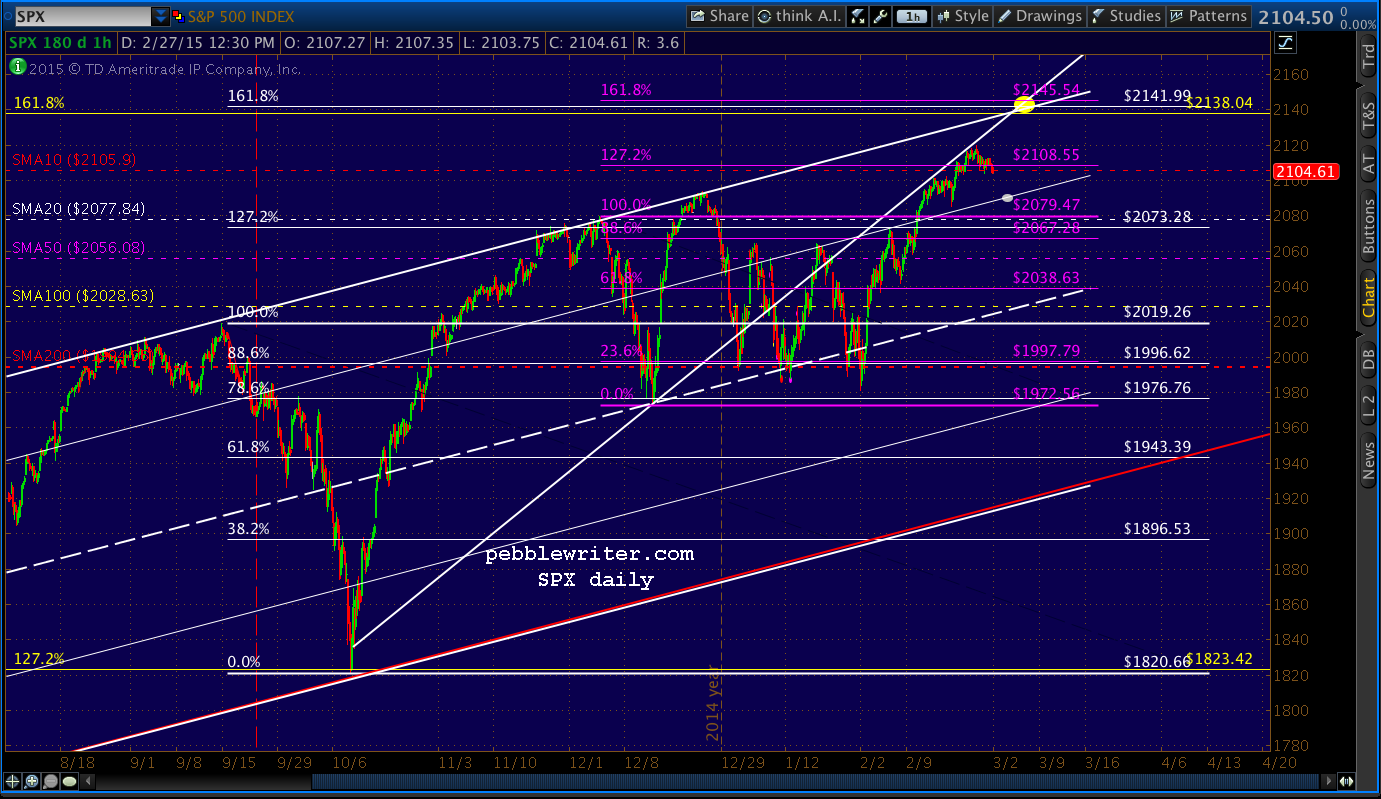
Since TPTB managed to get SPX very close to, but not quite over 2138, I made the assumption several weeks ago that we’d see a gut-wrenching sideways motion until early April. From the Mar 2 Charts I’m Watching:
We’ve examined the timing of breaching important resistance many times over the years. If the past is any indication, SPX isn’t quite ready to make its next major move.
The easiest point for TPTB to push past major resistance is during a low-volume session such as the Christmas holidays, 4th of July, etc.
The Easter holidays are a good month away (April 3.) As such, I think it’s likely we’ll see some sideways action for a while before the storming of the gates.
The key will continue to be USDJPY (of course) and CL – which, as mentioned before, really ought to test the .786 or .886 before trying for higher.
l’m looking for SPX to move lower before moving higher, with the likely target being a test of the SMA20 — if CL continues to slide. If the prop job continues, then the downside will be limited while the moving averages continue to rise. And, the bears will continue to suffer death by a thousand cuts.
The Mar 2 60-min chart is shown below.
The next day, SPX commenced an 80-pt drop that looked pretty convincing until several sharp reversals and a fake breakout in USDJPY (and, CL’s subsequent bottoming out) prevented it from reaching even a .618 retrace (red grid below.)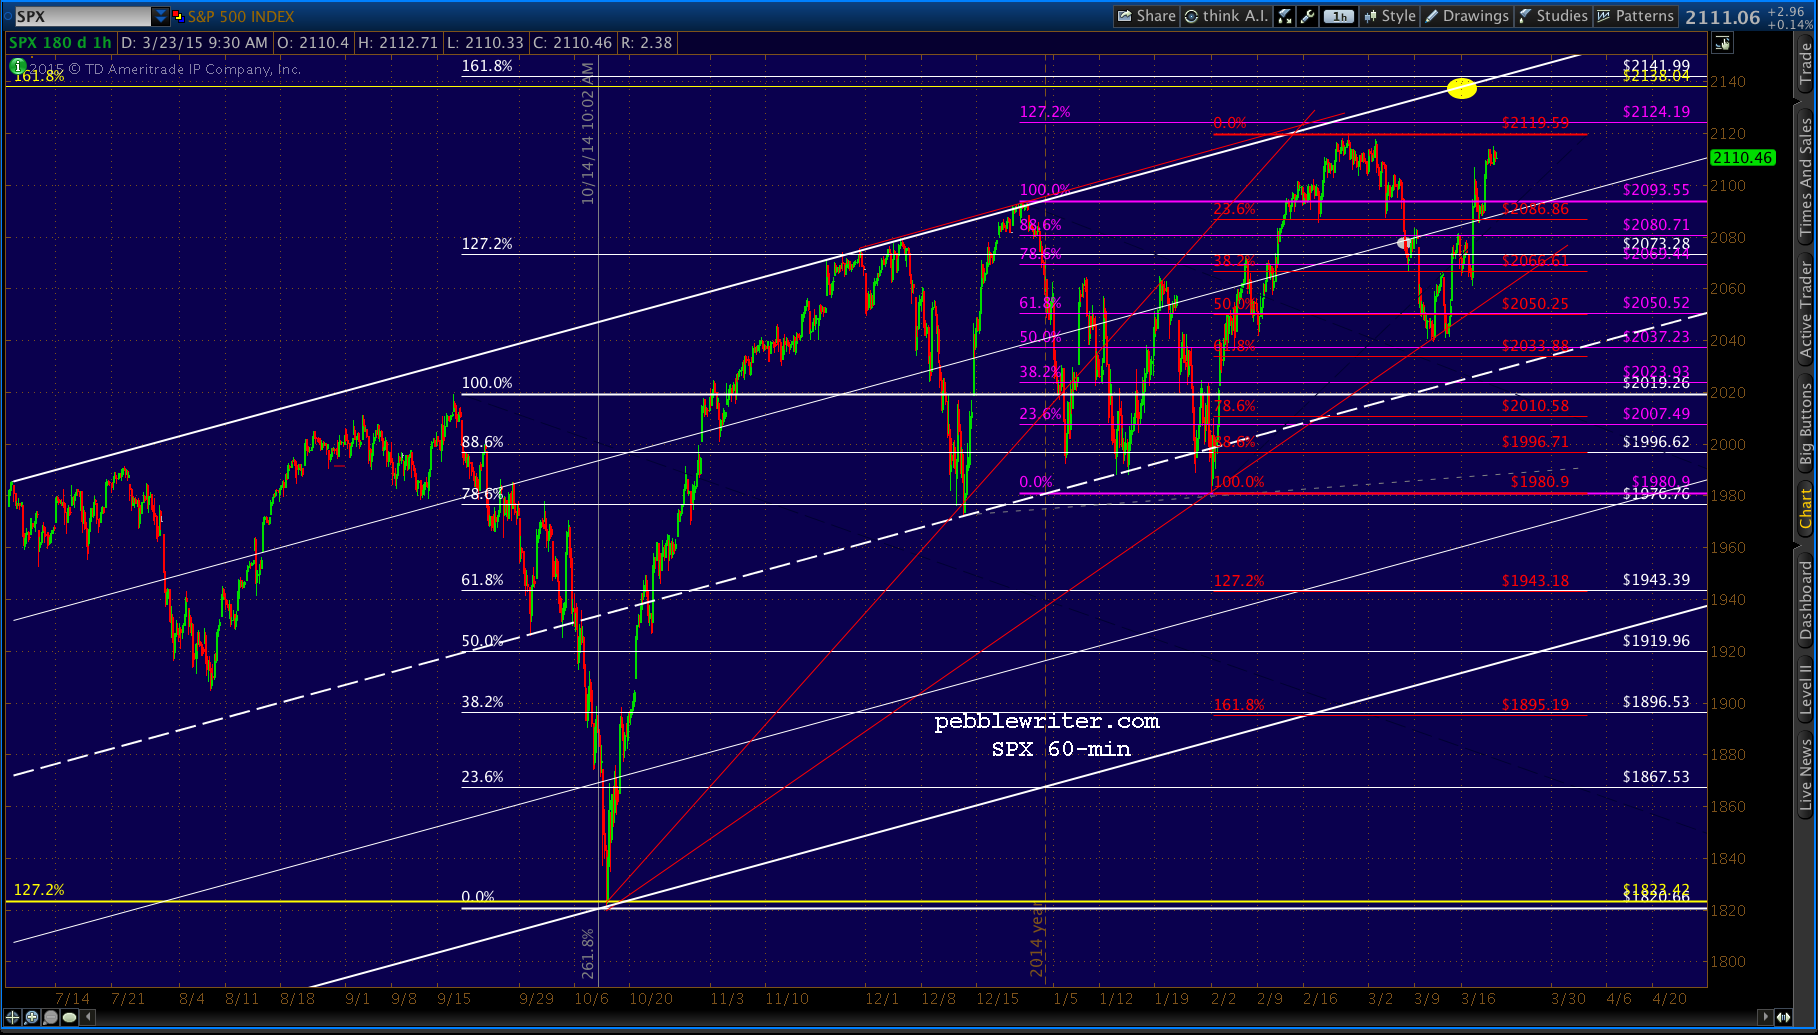 Since mid-September, there have been multiple new highs that were head-fakes, where no follow-through occurred, and significant drops ensued instead. We had a series of lower lows in January-Feb that couldn’t even produce a .618 retracement of the ridiculous Oct-Dec rally. And, we’ve seen the major determinant of stocks prices (USDJPY) act just as squirrely.
Clearly, when SPX was only 19 points away from 2138, they could have ramped it on up there overnight. Alternatively, they could have held the line on Mar 6 when it broke down through the white channel .786 line.
I strongly believe the hesitation was exactly what we discussed several weeks ago: there will be selling pressure at 2138.
If they can send SPX spiking right through it rather than just nudging it up a little at a time, it is much more likely to hold — just like December 2013 when a gap higher in USDJPY took SPX right through the Butterfly Pattern target of 1823.
One of the most painful lessons I’ve learned in trading is that you don’t always have to have a trade on. When things are as muddled as they currently are, it might be best to wait and let TPTB show their hand.
Comments
3 responses to “Charts I’m Watching: Mar 23, 2015”
Thanks, the update is much clearer as it currently stands.
Hi Pebblewriter,
I appreciate the effort you’ve put into these charts, and the broader point you are making about manipulation and correlation between various asset and currency markets. I also respect your instinct about market movements. (Anyone can overlay Fibonacci retraces, but you have an excellent instinct for figuring out which ones are likely to affect the market). However, it’s sometimes difficult to condense your updates into actionable, tradable recommendations.
I understand the market doesn’t always tip its hand, and there may be times when you just don’t have an outlook that is firm enough to be worth trading. Perhaps it would be best to state that explicitly at those times.
But, when possible, it would be very useful to have a clear, tradable forecast – for example, something like “SPX is likely to correct briefly here before continuing to its target of 2136. The first downside support would come at Thursday’s low of 2085”. As of today, anyone who followed your recommendation is flat from roughly 2110 and awaiting further instructions, with no clear short-term outlook.
Just providing my feedback – thanks again!
Thanks for the feedback, James. I’m still of the belief, as posted back on Mar 2, that we’re in a period of deliberate delay that will ultimately be used to drive SPX past some serious resistance. I’ve updated the “current forecast” page as a reminder of the big picture. For more, please see today’s member section.