

We’ve noted over the past several weeks that only a decline in EURUSD would permit both CL and USDJPY (and hence equities) to sell off at the same time. So yesterday’s failure of EURUSD’s rising purple channel is potentially significant.
 To recap, USDJPY’s rallies almost always drive stocks higher — whether or not they last, and despite the fact that they are entirely and openly manipulated by the BoJ and other central banks — not to mention large HFT traders/hedge funds.
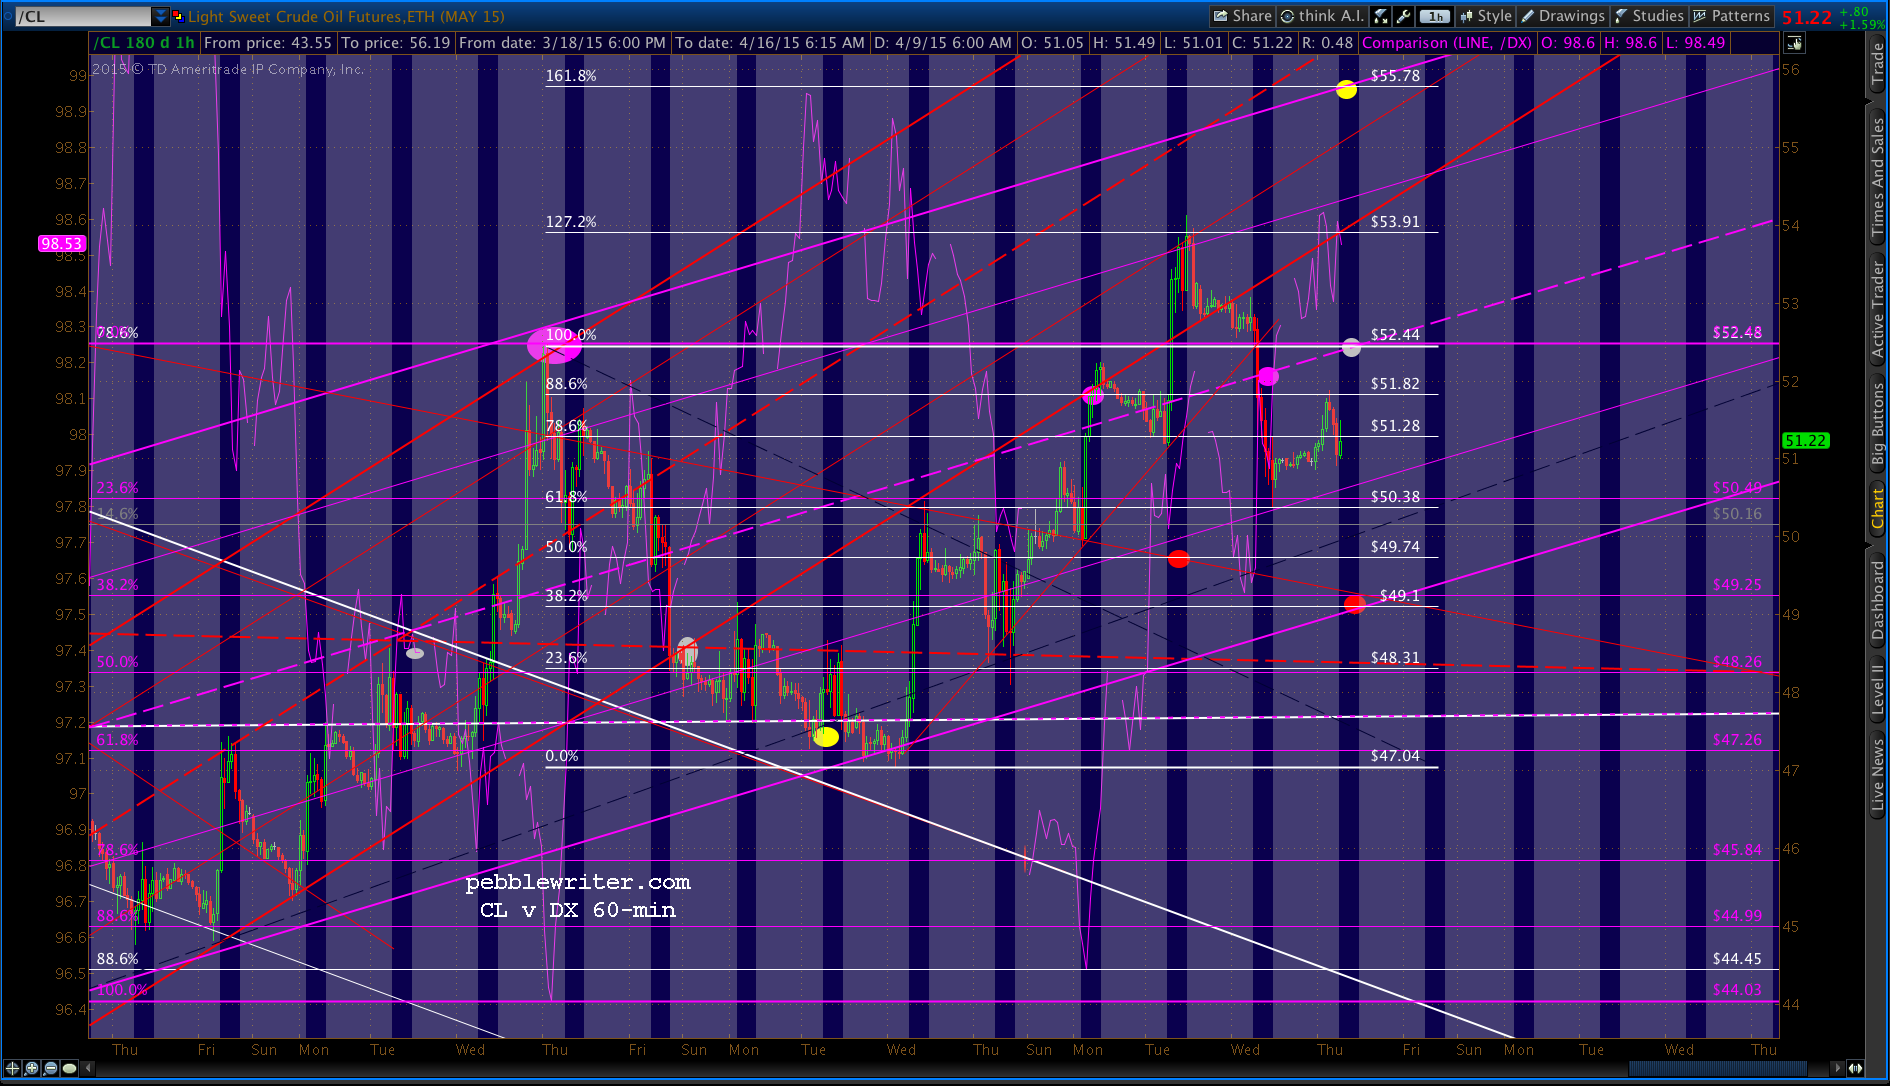
CL has joined the algo game over the past several weeks — also driving stocks higher when it rallies. But, it is very highly negatively correlated with the USD dollar.
So, a rally in CL drives DX lower which, everything else being equal, should drive USDJPY lower — unless it’s propped up, which it usually is. Result: rising stock prices.
A decline in CL drives DX higher, which — all else equal — drives USDJPY higher. Result: higher stock prices.
When EURUSD declines, however, DX can strengthen even while the yen strengthens (USDJPY falls.) This sets the stage for CL and USDJPY to fall at the same time, and take ES/SPX with them.
continued for members…
Today, we see CL falling off…
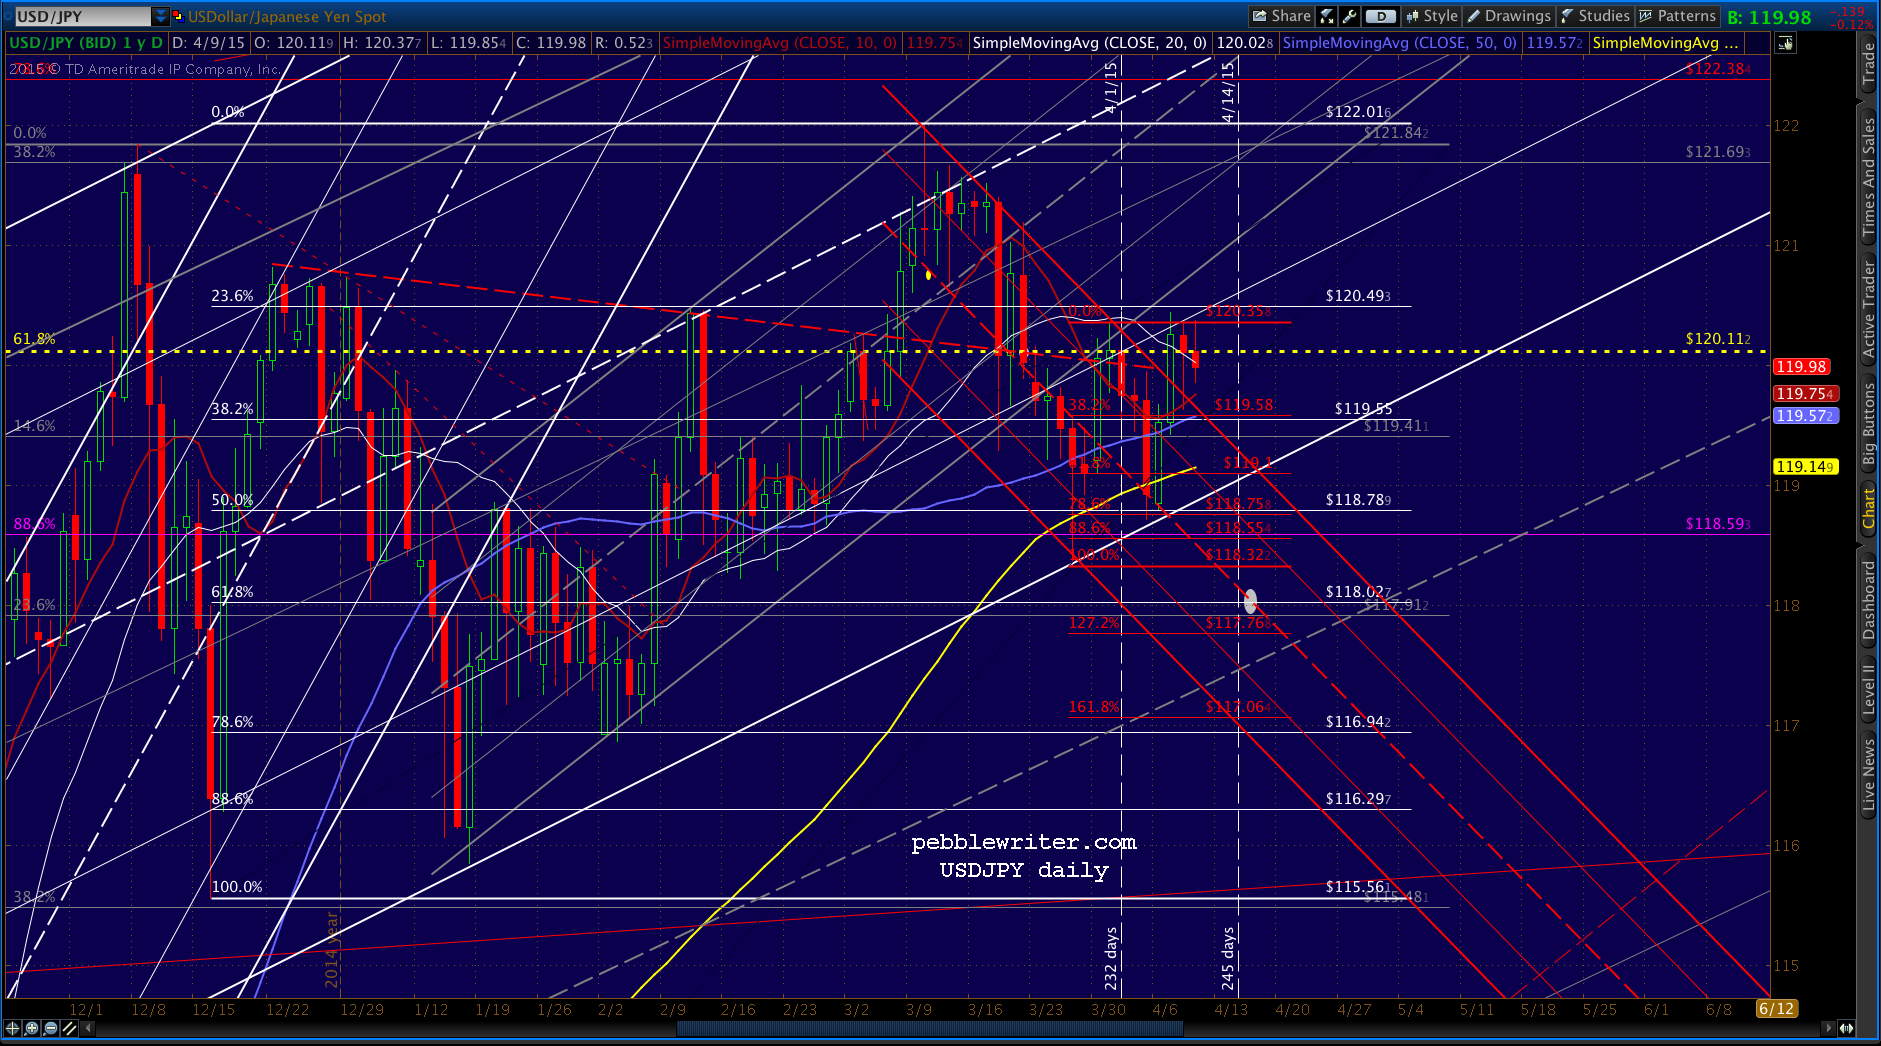
 …USDJPY retreating from the .618 Fib line…
 …and, DX breaking out.
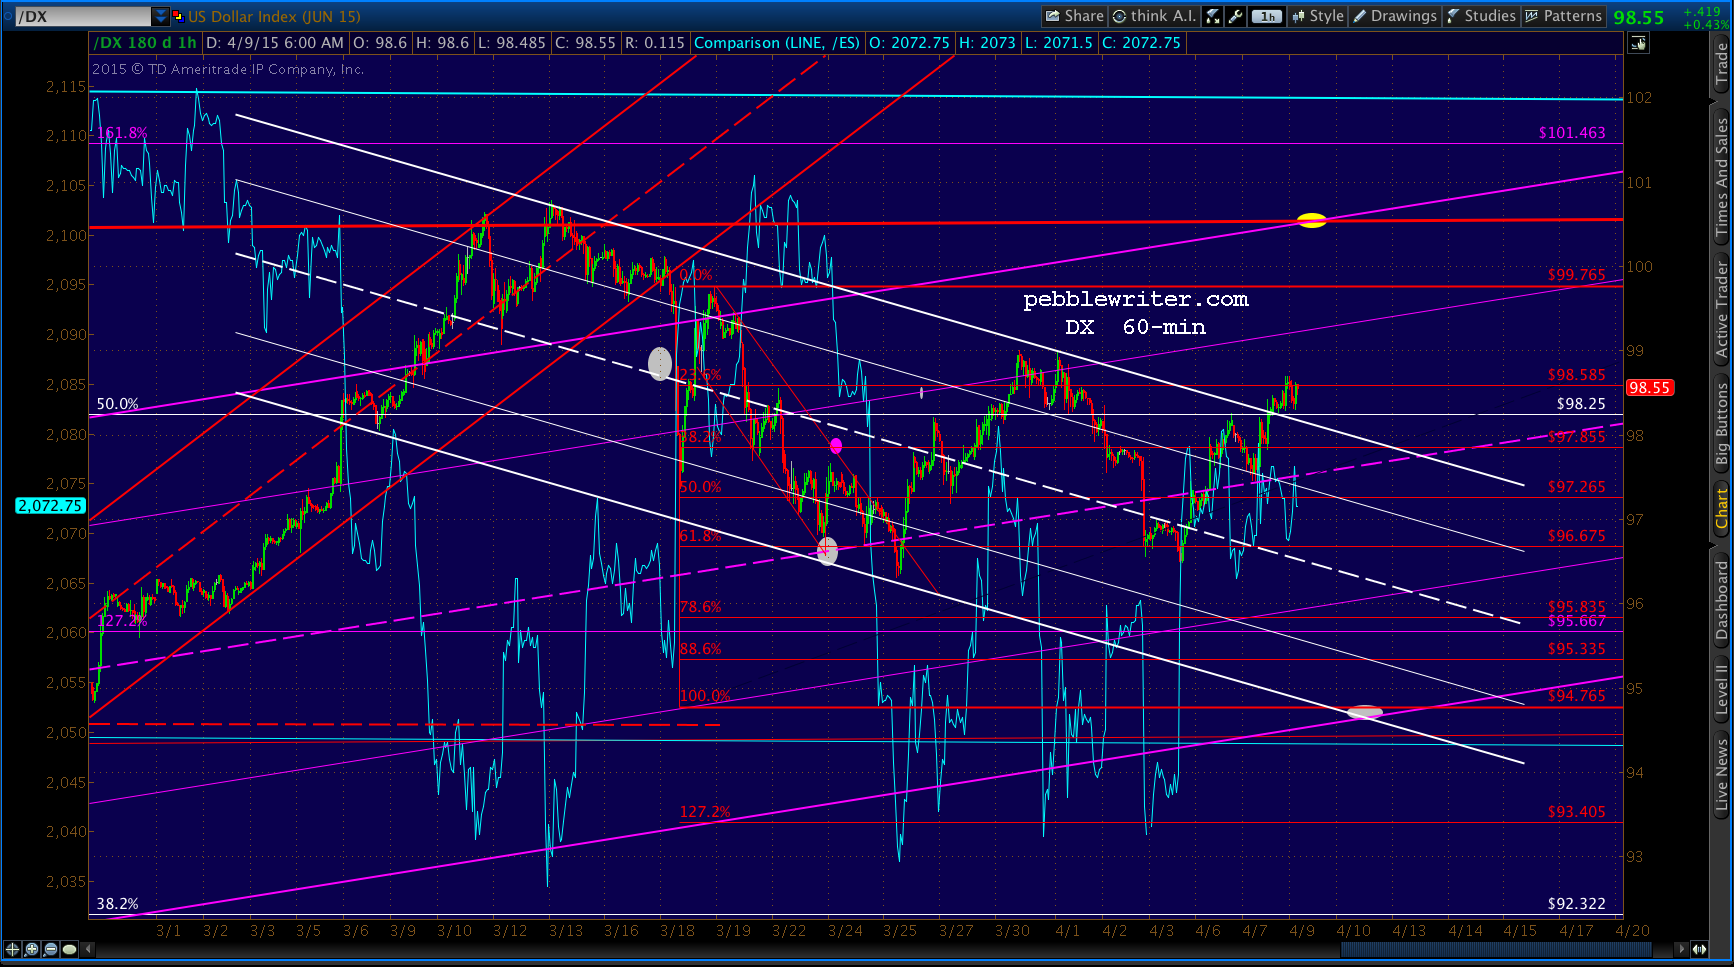 Whether each of those conditions will continue to hold is questionable. Any meaningful decline in SPX has continually prompted USDJPY to scurry back to the 120.11 level like a scalded cat.
Our analog calls for that to continue happening, with the exception that as USDJPY’s SMA200 approaches, the pair will be allowed to slip down to greet it and get a reassuring bounce.
As the SMA200 draws closer, we’re left with the question of when/where the tag will occur — the previous low of 115.56? The white .618 at 118.02?
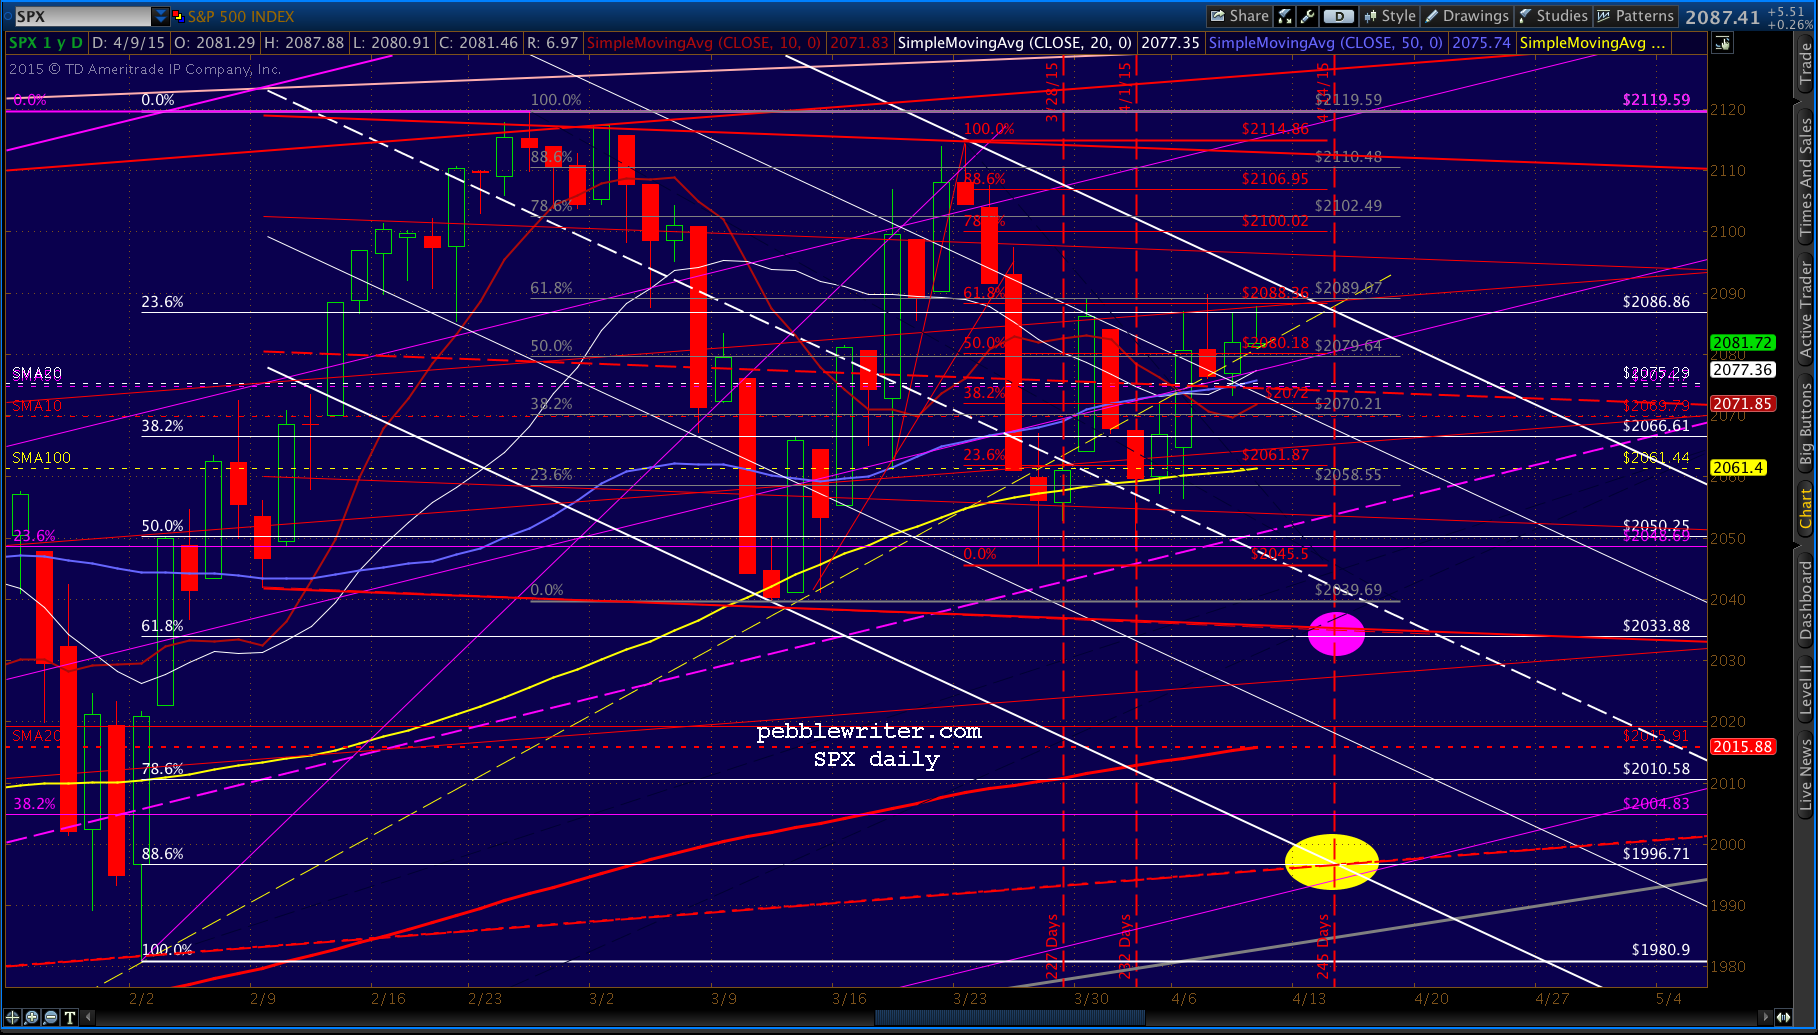
 And, how will SPX react? It clings to the TL from Oct 2014 like a lifeline — ignoring bad economic news with its usual vigor.
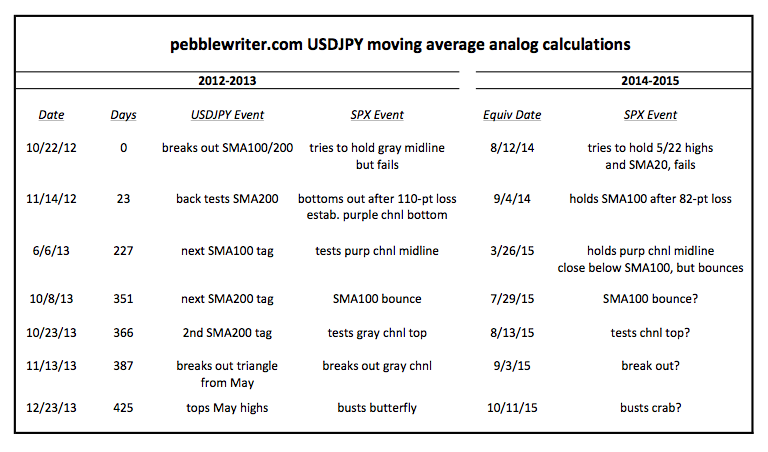
 We’ll recap what happened when past versions of this story played out and try to draw some parallels. First, the relevant dates and events:
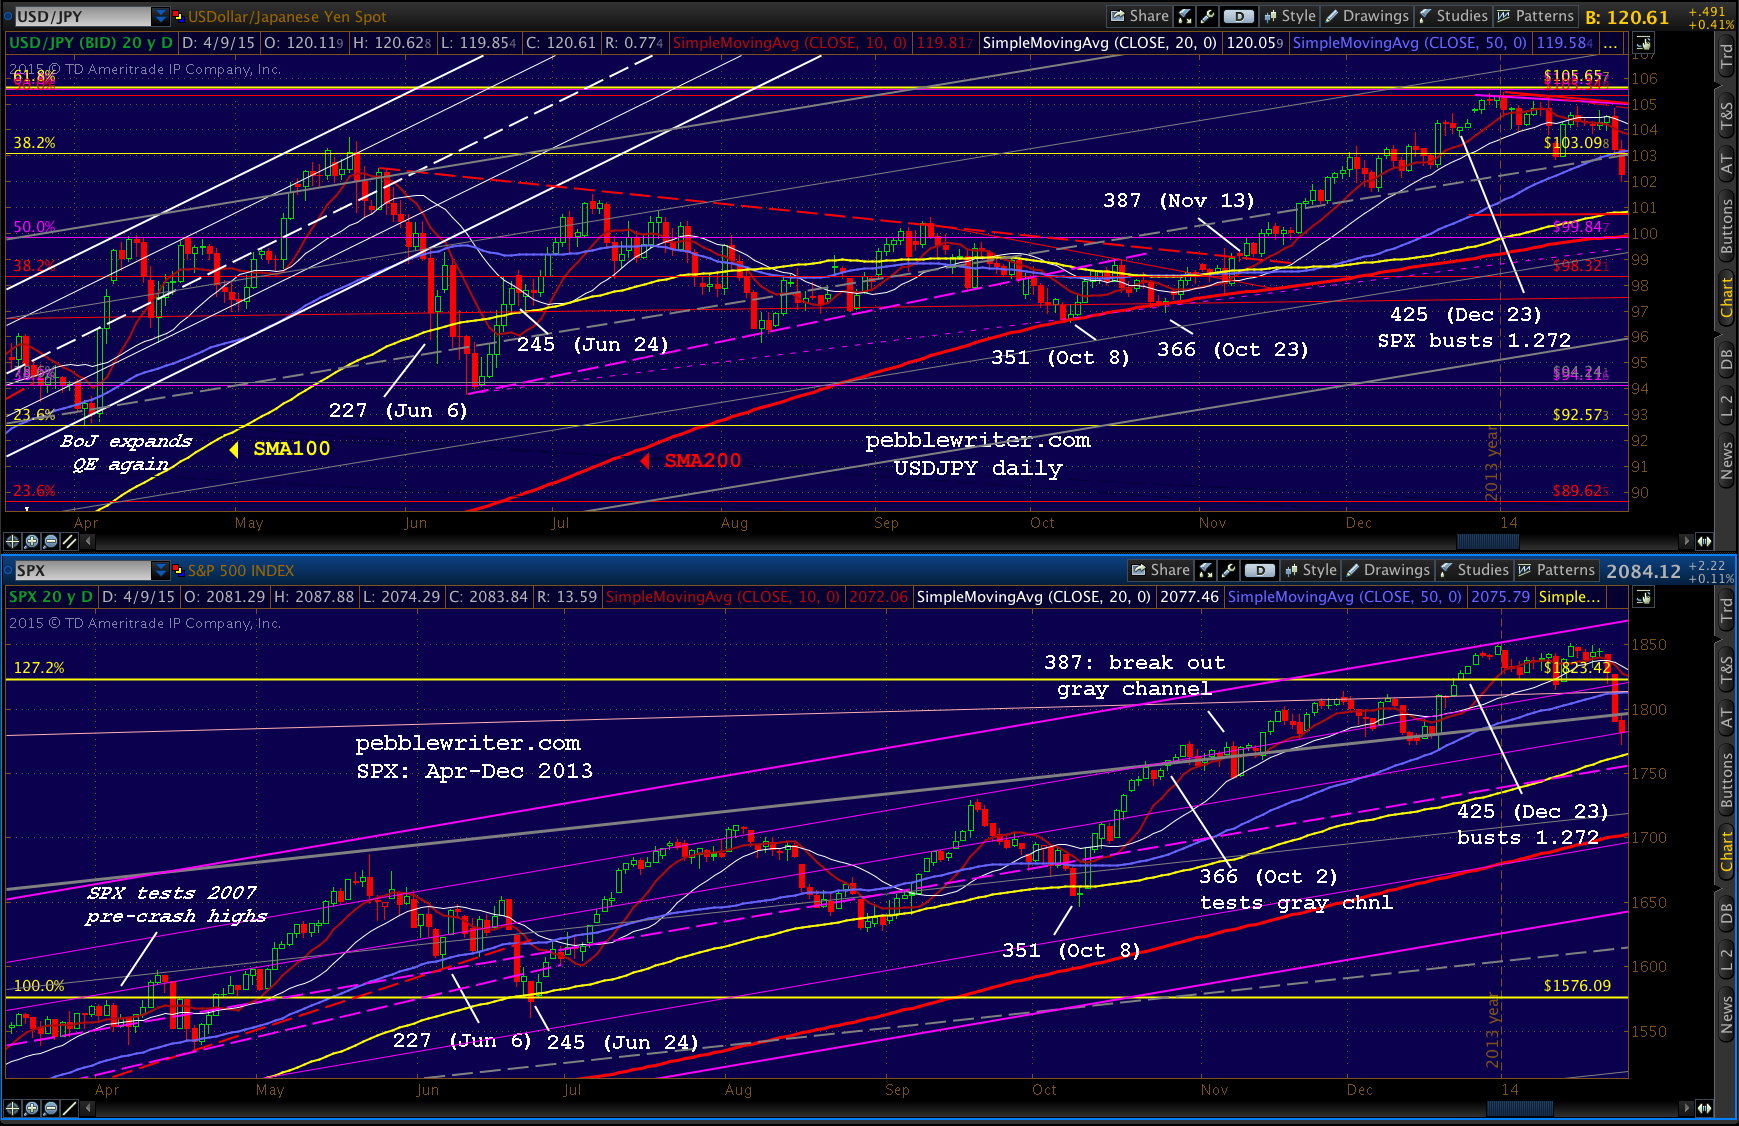
 And, a chart of USDJPY versus SPX during the initial 2013-2014 period, showing how key reversals and breakouts in USDJPY enabled SPX to overcome very significant resistance at the 2007 high at 1576, the gray channel top, and the butterfly pattern completion at 1823.
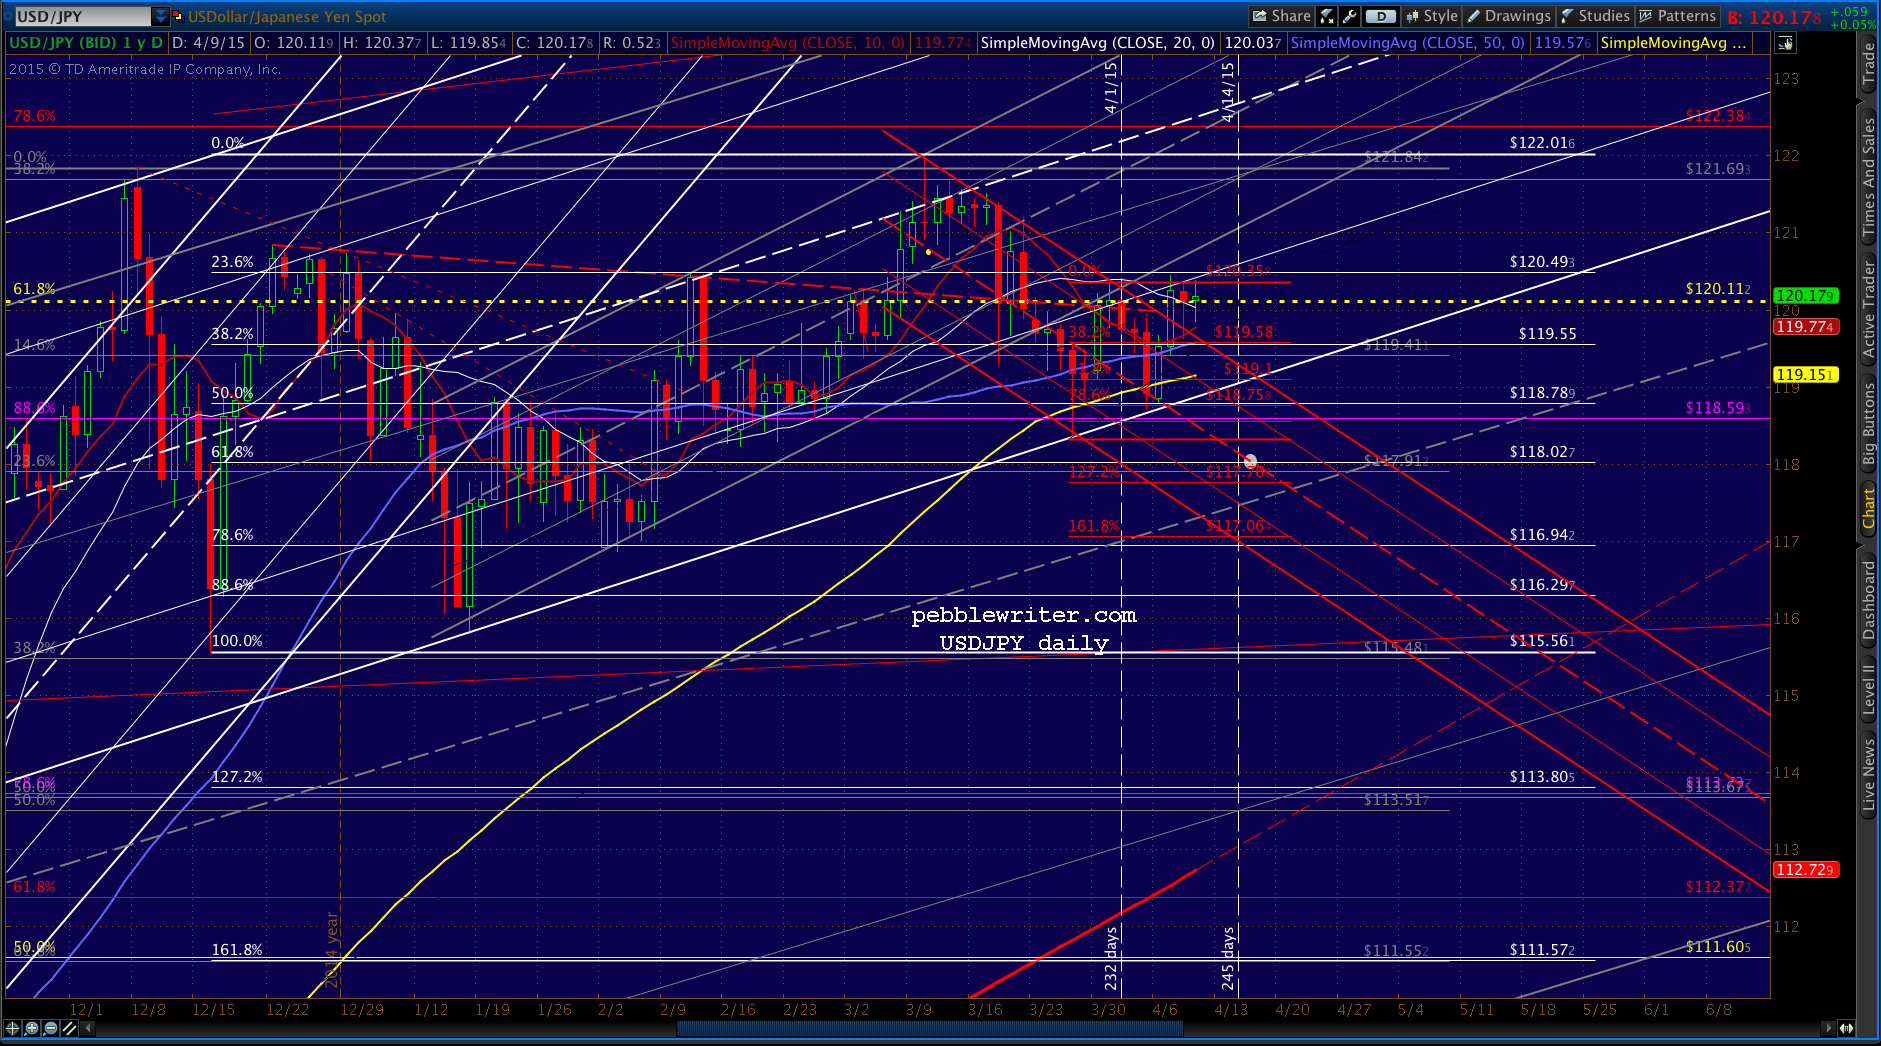
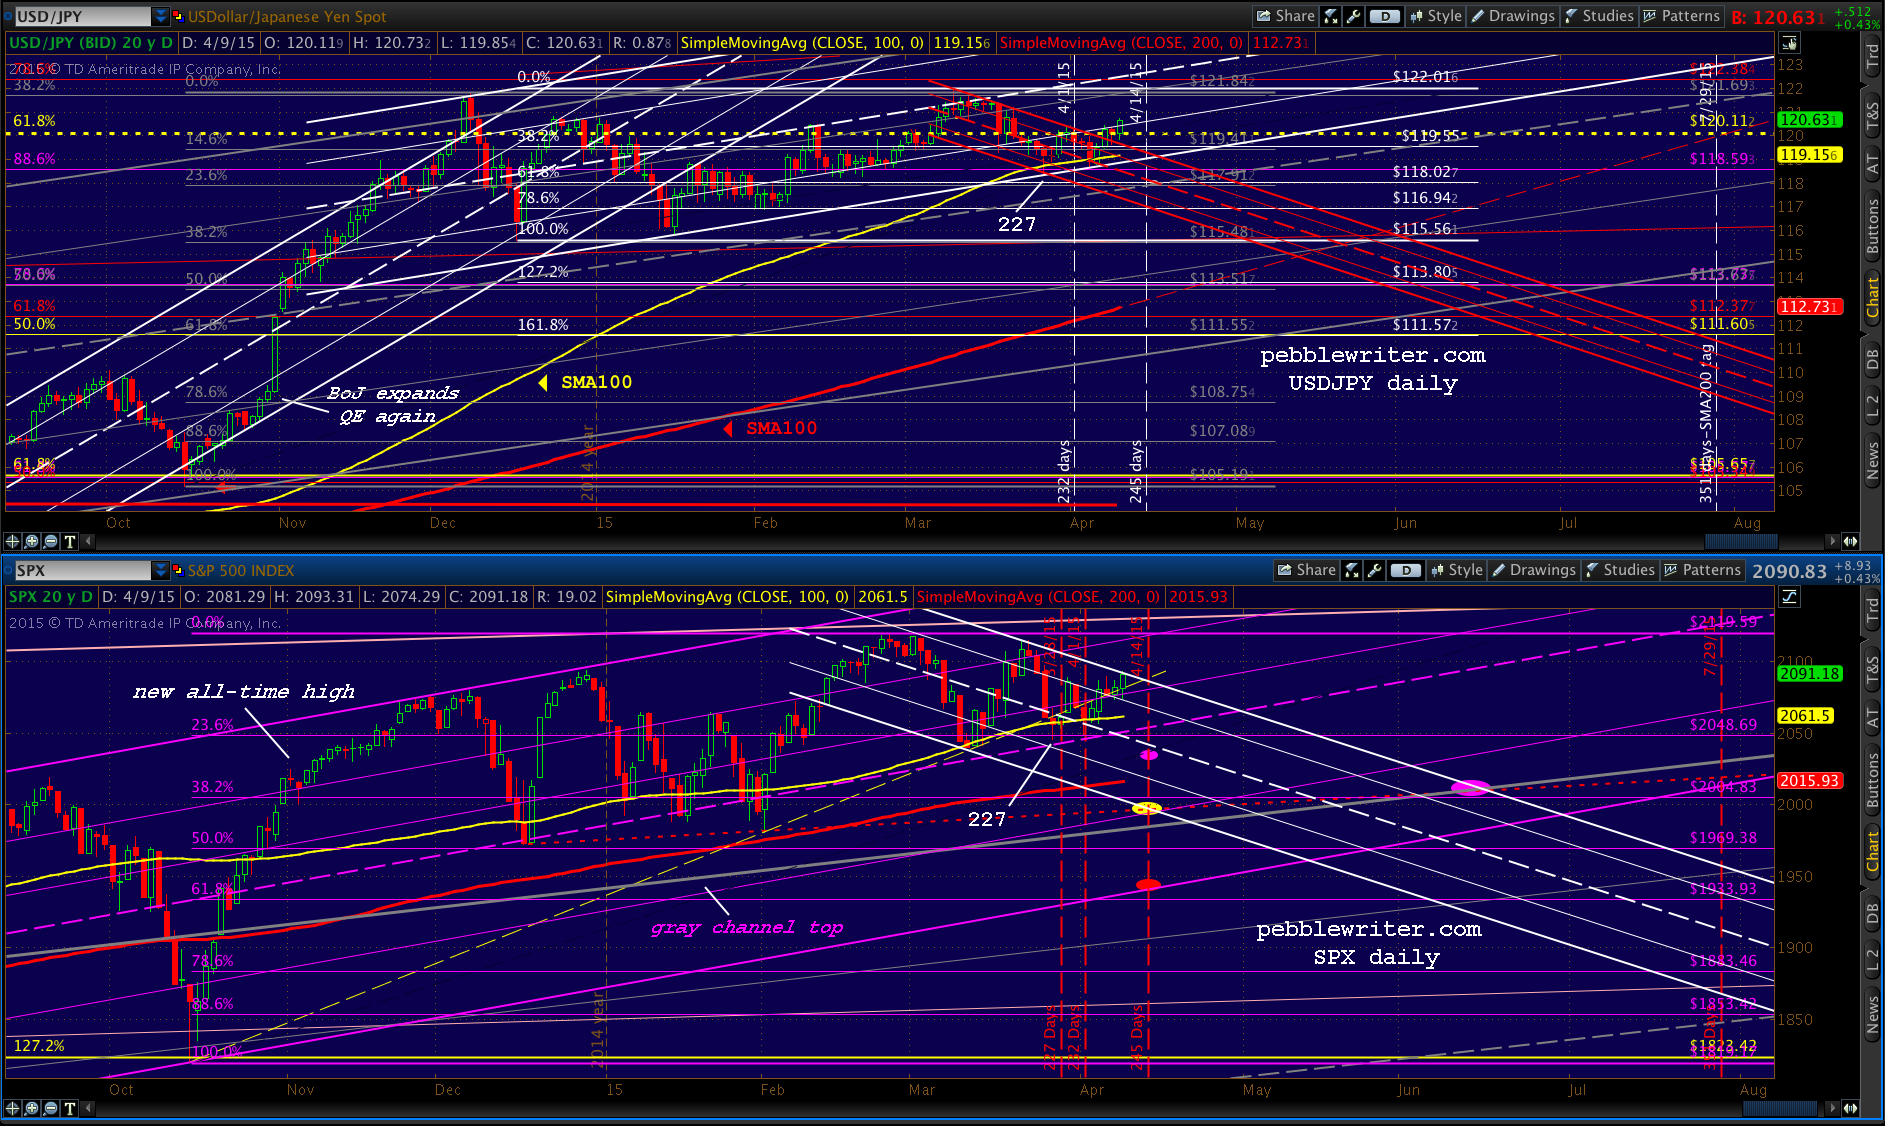
 Here are the equivalent dates in 2015, with SMA100 and SMA200 charted in. As things stand now, USDJPY’s SMA200 should arrive at the Dec 2014 lows (115.56) around May 22.
More interestingly, it appears that USDJPY’s SMA200 will intersect the yellow .618 (120.11) somewhere around July 29. This would be day 351 — which, not so coincidentally, is the day when the USDJPY first tagged its SMA200 after a long, long rally in 2013.
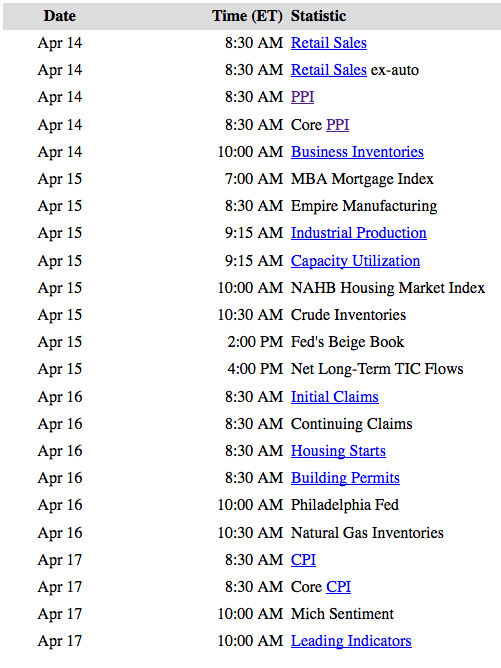
 I’ll study and update the model more over the coming days. But, we’ll continue to look for an Apr 14 interim low — either at a key channel line or moving average — and strong bounce back. Next week’s economic calendar is full of potentially important data points.
 GLTA.
GLTA.