

CL closed yesterday atop the purple midline for support, then slipped down overnight to tag the .786 Fib and is backtesting the midline as resistance this morning. This would be a good opportunity for CL to flesh out the rising purple channel with a dip to the .618, but that would likely put a ding in the “every day is better than the last” meme of this “market.”
USDJPY is masking CL’s weakness in order to maintain green shoots in the futures overnight. As expected, it didn’t make it through the SMA50 yeaterday. But, it remains inside the rising white channel and within striking distance of 120.11 — which is enough.
 Perhaps the most telling chart of the whole farce is VIX. Channel tops and bottoms are made for bouncing. Yet, VIX has been clinging to the bottom of the rising purple channel for a full two weeks.
 In an unrigged market, one might say it represented “coiling” — gathering momentum for a strong surge higher. In this “market” it represents keeping the index at a level from which it can easily be monkey-hammered lower in order to prop up stock prices.
And, it is on this note that I must diverge. No doubt many have seen the news regarding one Navinder Sarao, alleged flash-crasher extraordinaire. Zerohedge has done a good job summarizing the ins and outs of his arrest in Britain and the ongoing US extradition effort.
In short, Sarao is being charged with masterminding the May 2010 flash crash via spoofing, a means of manipulating securities prices by submitting hundreds or even thousands of market-moving orders and quickly (within nanoseconds) withdrawing them before there is a chance of them being executed.
Spoofing has been practiced by countless high frequency trading firms within and outside of the US for years. It is the scourge of the industry, and it is easy to see it in action on practically any given trading day. Furthermore, it is practiced by major central banks themselves both directly and via their proxies — but, always in an effort to increase stock prices.
Now, Sarao might indeed be guilty as sin of contributing to the flash crash. But, he most certainly was not the only player. Nor, was he likely the largest. FINRA and the CME could very easily put a stop to spoofing any time they like. But it’s one of the primary tools for keeping stock prices rising, and it generates enormous trading revenues for CME.
So, don’t look for any meaningful changes as a result of Sarao’s arrest. He is a scapegoat who will likely divert attention from the very real and very dangerous practices at work in the “markets” every day — practices that will inevitably lead to more flash crashes down the line.
Coming up, a look at SPX and the progress of our analog.
continued for members…First, a fresh look at the last (base) period. First the key dates: And, the chart from the previous period:
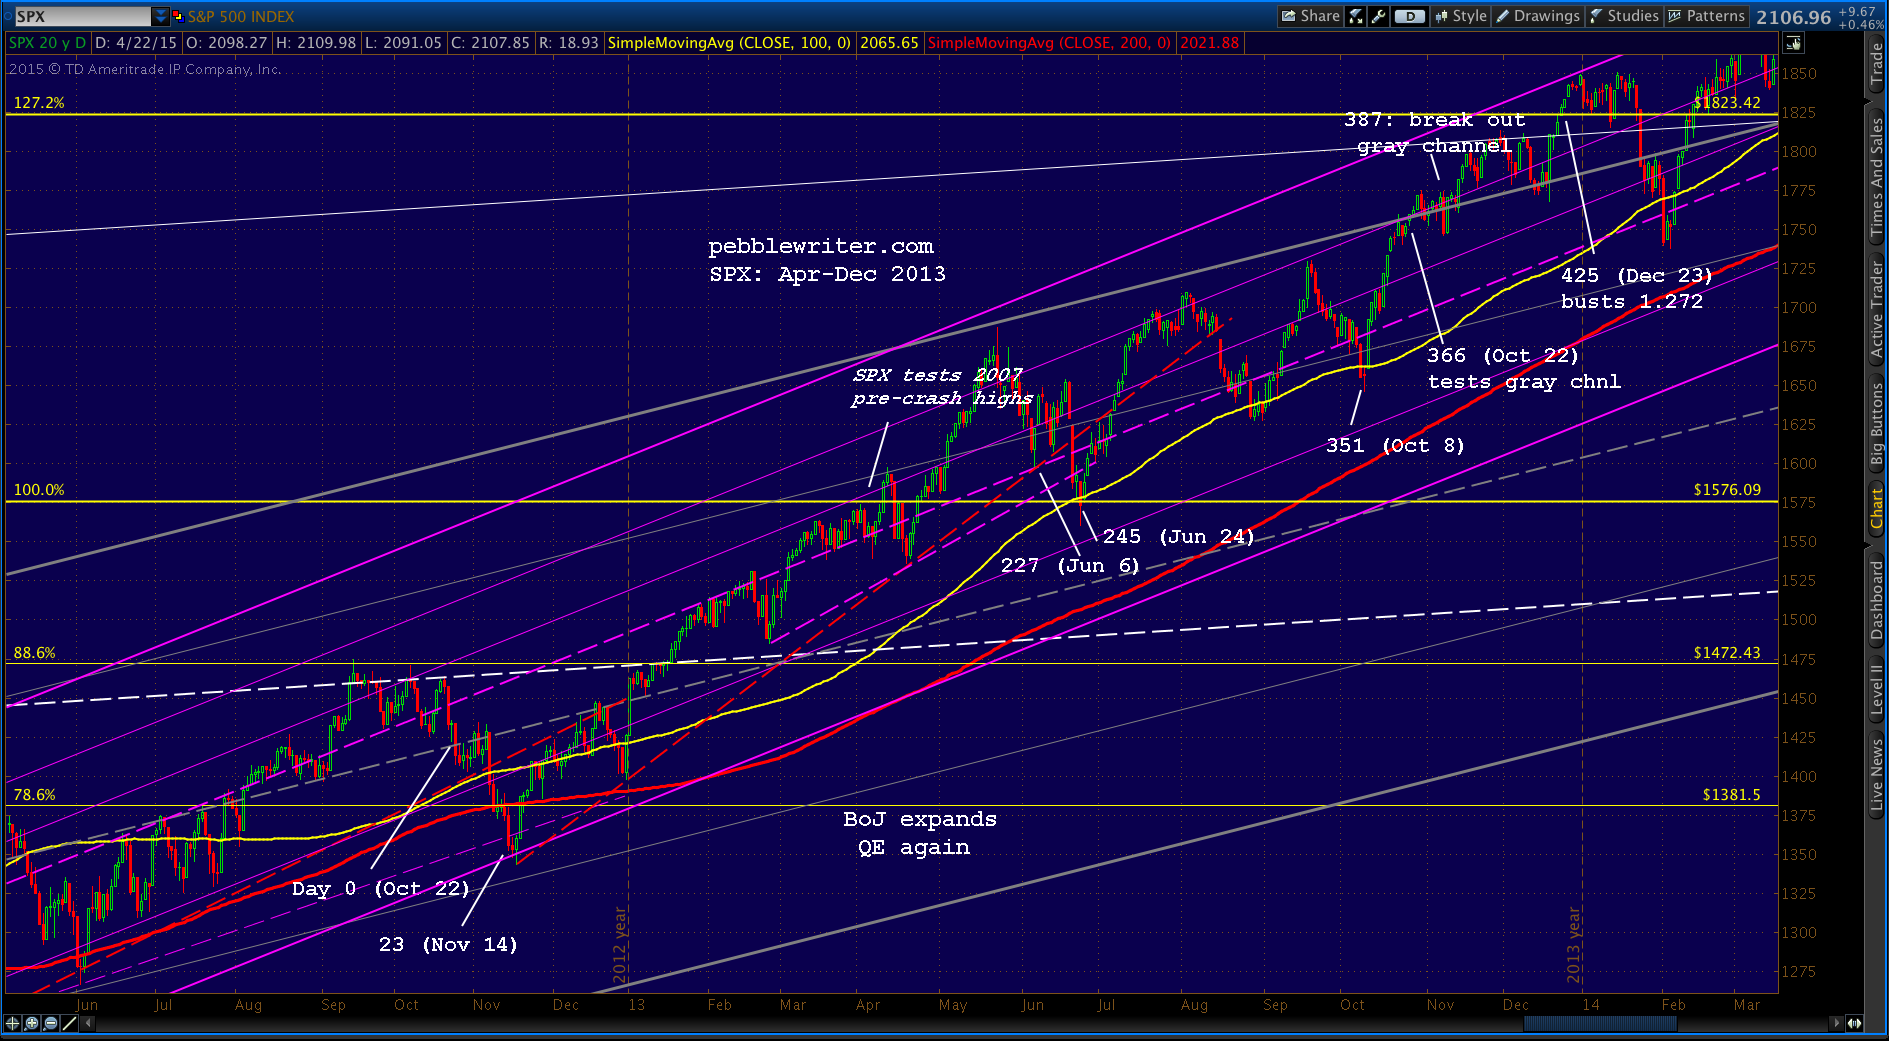 Note that SPX’s chart in the current period bears little resemblance to that of the earlier period. There was a significant dip 23 days after the initial Day 0, but in the most recent period it came on Day 60.
More significant was: (1) the amount of churn in the following days; (2) steadily higher highs and higher lows; and, (3) a refusal to dip below the SMA100, even when the SMA200 was only slightly lower (it went 23 months between tags.)
 Remember, the point of this historical rerun is to push past significant resistance. In the previous period, it was to establish a new, steeper channel which transcended the gray one and bust the Butterfly Pattern.
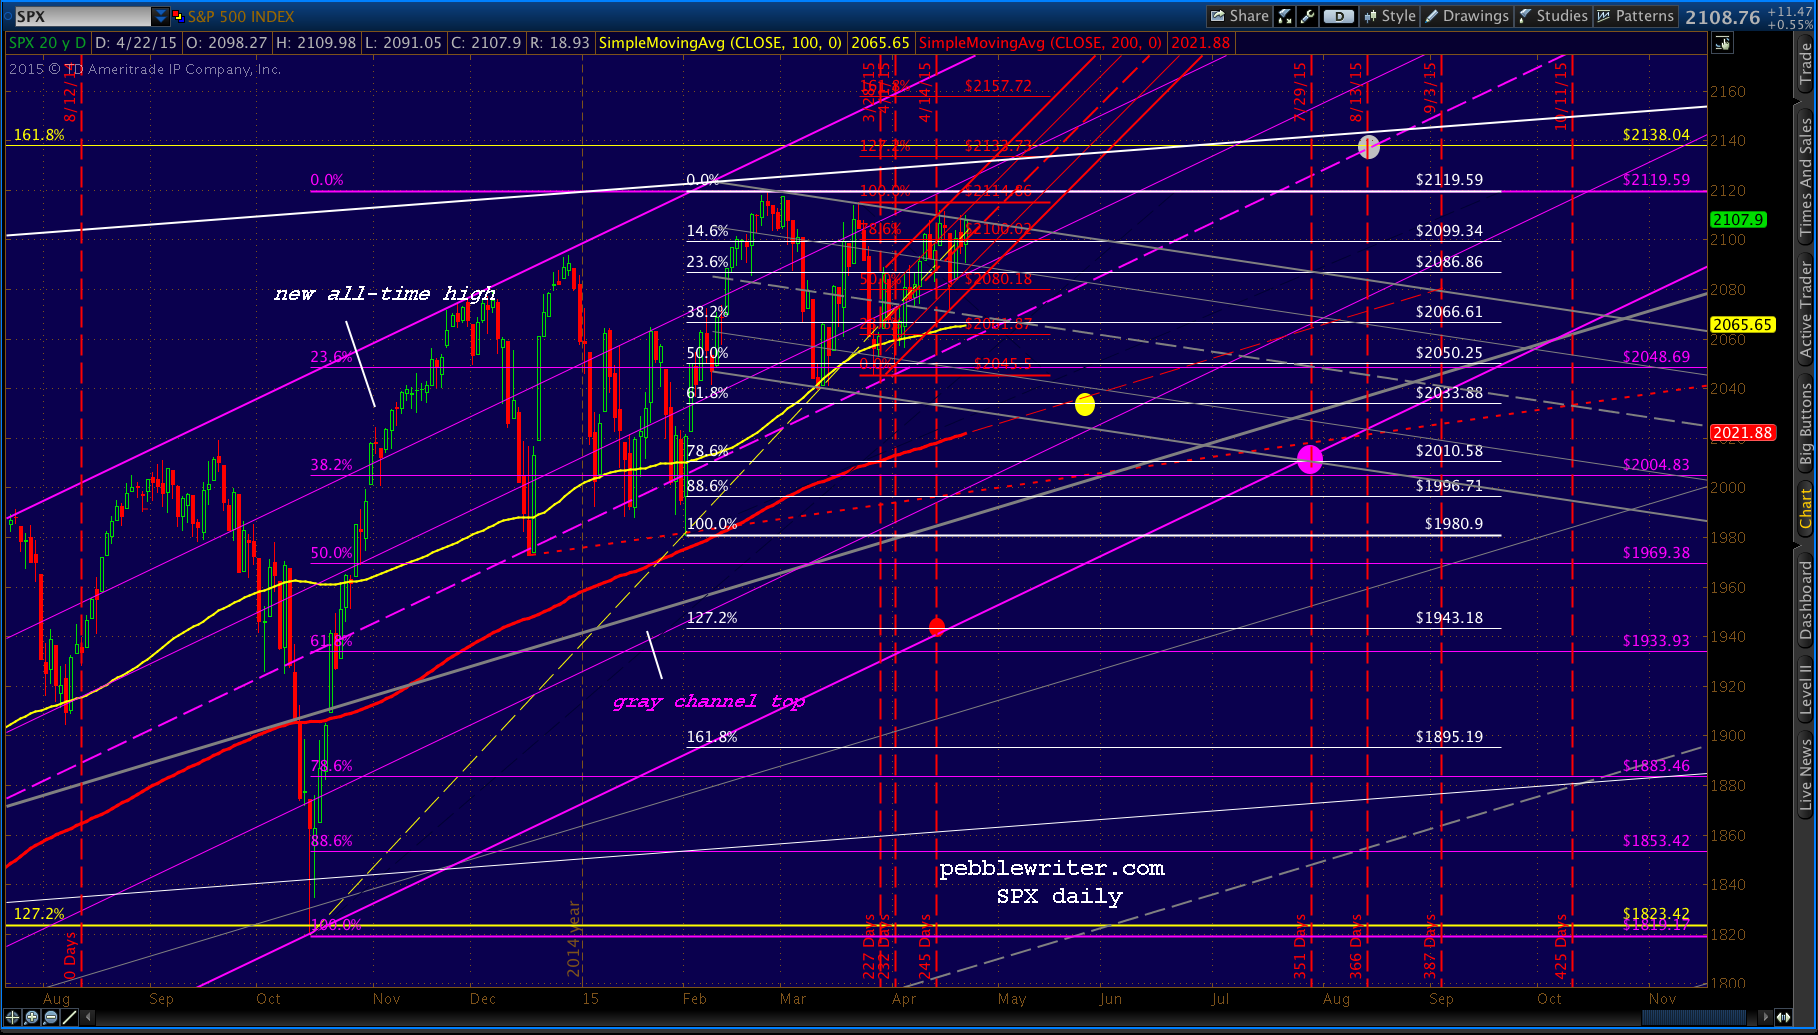
So, it stands to reason that the current period’s goal is similar: to bust a significant Fib pattern (the Crab Pattern 1.618 at 2138 gets my vote.)
As for a steeper channel, I’m not sure it’s necessary. The gray channel has been broken out of (Oct 2013) and backtested (multiple times in 2013 and 2014 with powerful thrusts higher each time.)
The top of the purple channel already broke through 2138 back in early March, and the bottom won’t break through until early 2016. In other words, there’s plenty of time for an assault to be executed.
Back to breaking 2138…SPX has clearly been basing just shy of 2138 for a while. The current purple channel midline crosses the current high of 2119.59 in late July. It crosses 2138 around Aug 15, which is day 366 — the day in the previous period when USDJPY tagged the SMA200 for a second time.
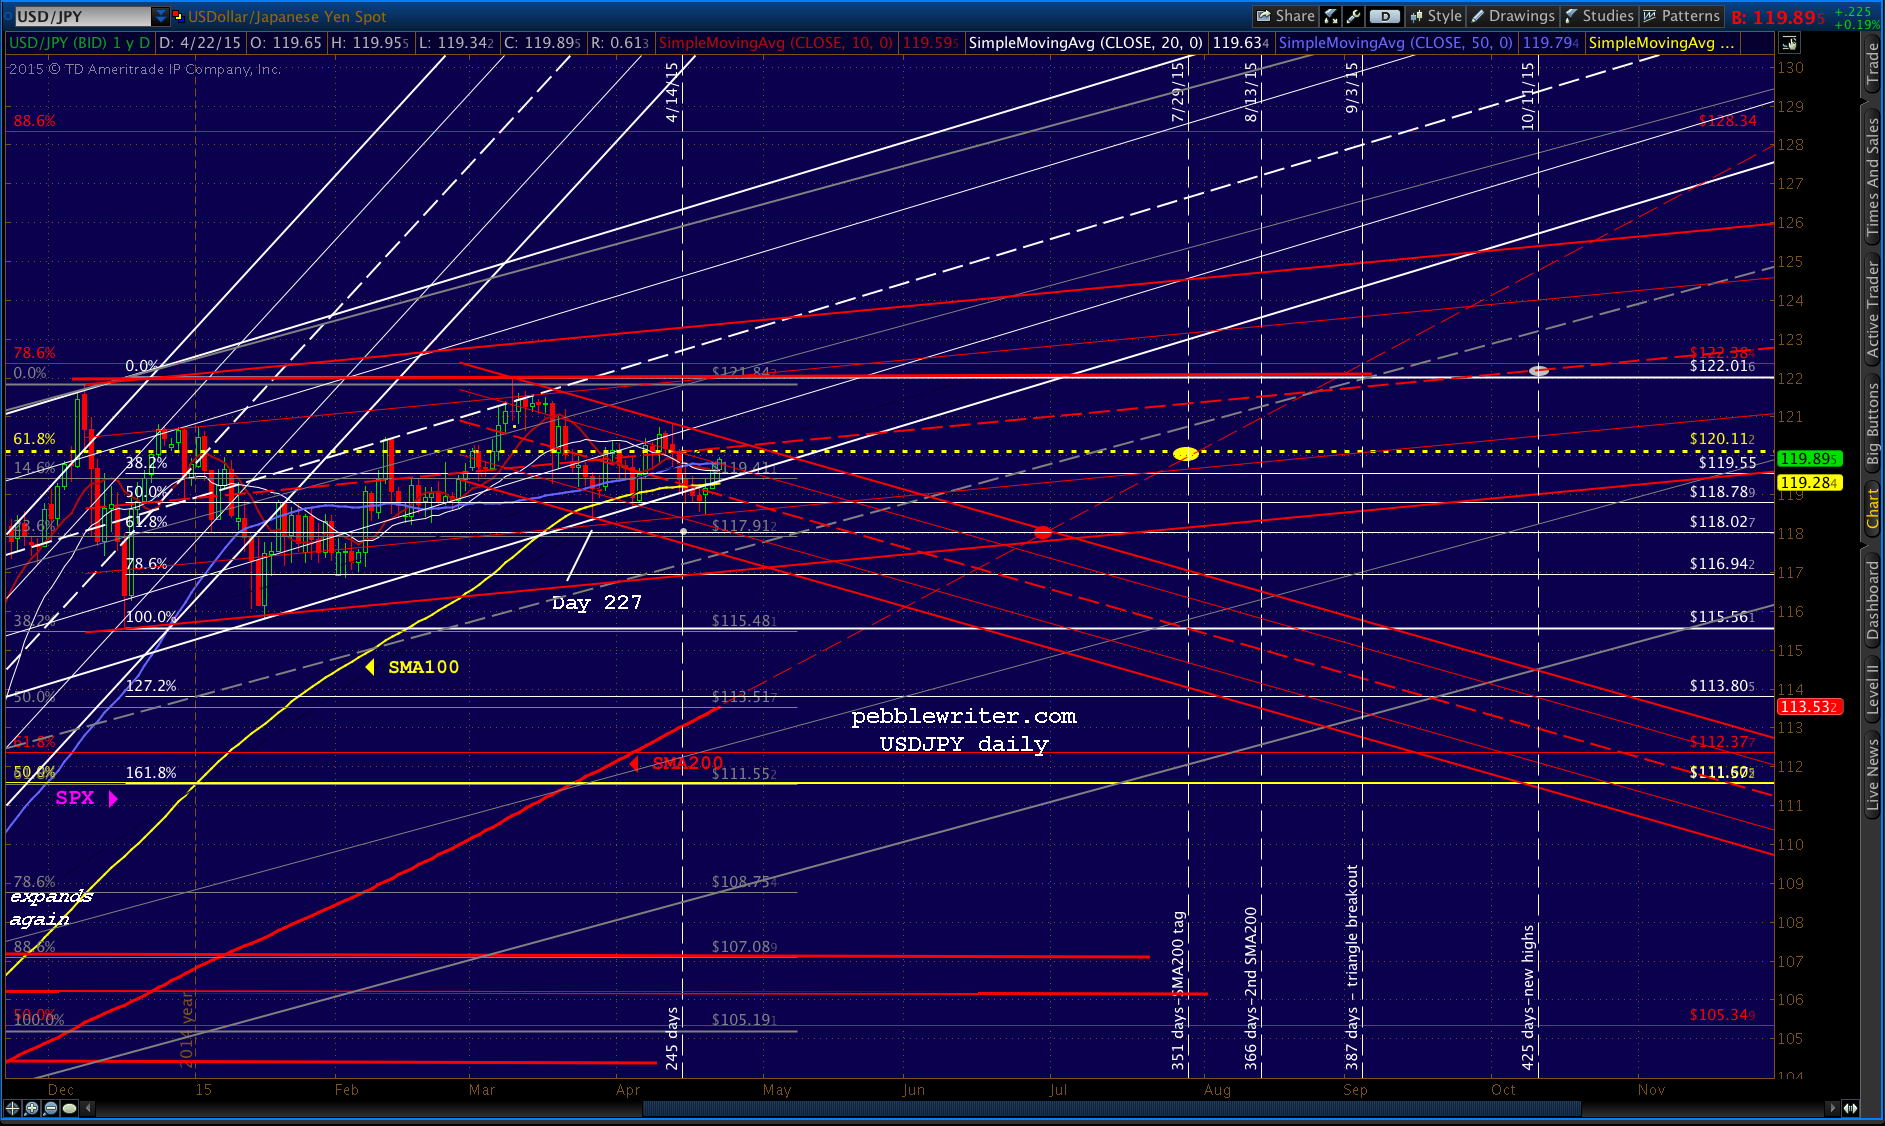
On the USDJPY chart, we can see that the SMA200 is roughly pointed at the yellow .618 (120.11) around day 351, when the next SMA200 tag is supposed to take place. I take that to mean USDJPY will remain in a holding pattern until then, possibly following the red channel I’ve sketched in which is based on the Dec and Jan lows.
If so, the SMA200 might cross the white .618 around the end of June, and then break out of the resulting triangle to tag the .618 around July 29. It would be followed by a backtest around Aug 13 (second SMA200 tag), test of the highs around Sept 3 and breakout to new highs around Oct 11.
Note that the gray channel midline catches up with the SMA200 during the last couple of events. It dates back to the original breakout in 2011-12, and should continue to provide guidance in any future USDJPY breakouts.
This is all speculative, of course. But, the fact that TPTB won’t allow even a small dip in SPX now that it’s near 2138 suggests it’s true. More later.