USDJPY looks like it will complete the Bat Pattern (red) with an .886 retrace of its post Mar 7 drop.
 A pullback here (at 103.46) would coincide nicely with the Nikkei 225, which (yesterday) reached the .618 retrace of its drop from channel support. It has been back-testing the channel for over two weeks.

 So, either ES will carry on without the yen carry trade support, or we’ll put in a 1-2, 1-2 Bat Pattern reversal at 1876.75ish.
 The 10-yr continues to cast doubt on the idea of new highs in equities.
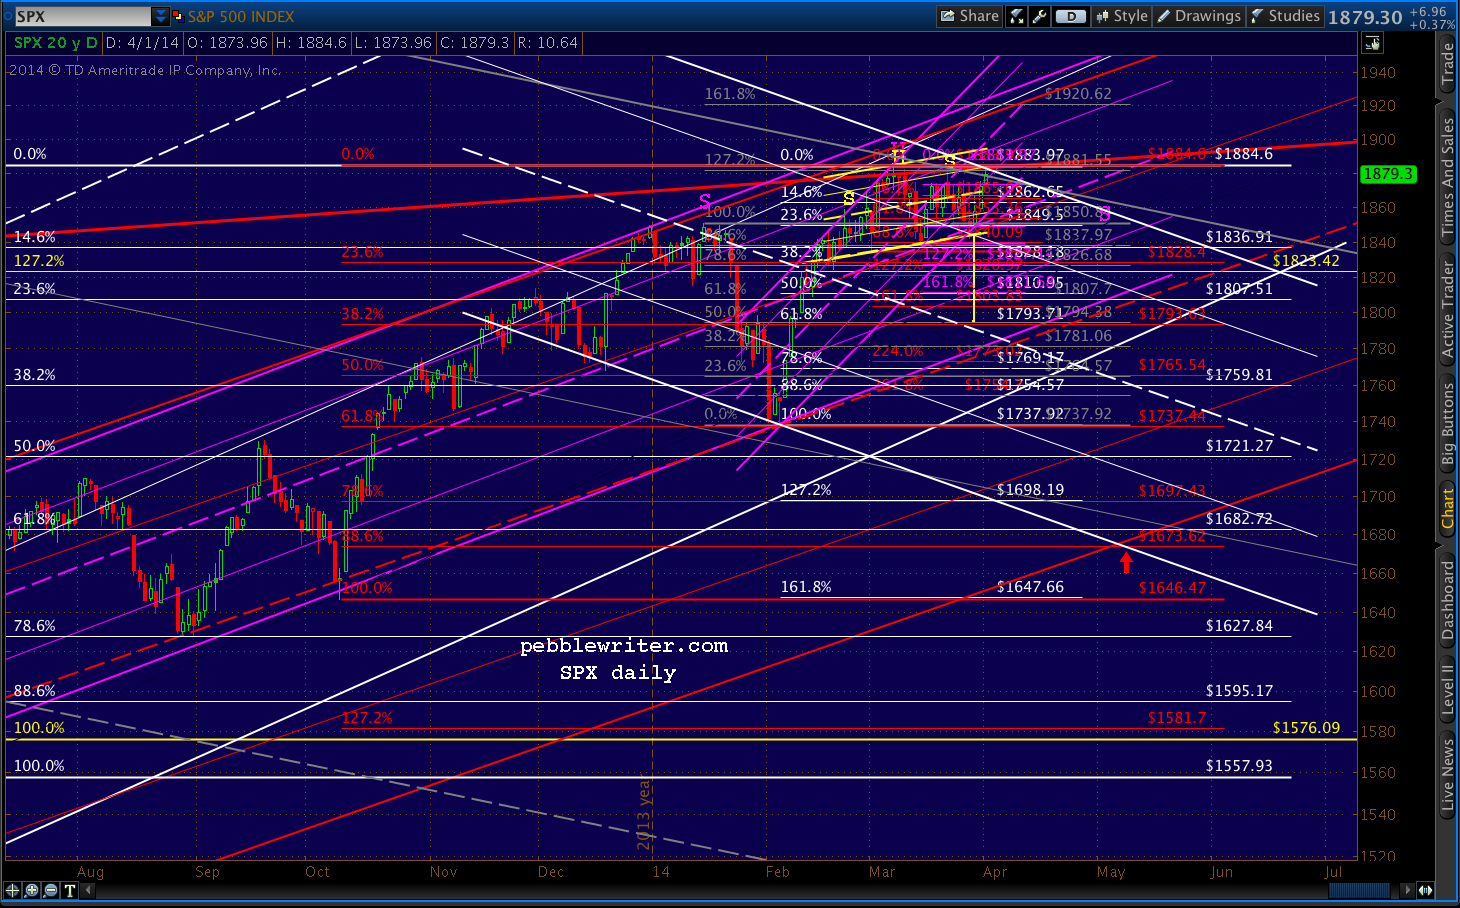
 The close-up:
 We could be setting up for nominal new highs to trip stops and break the bearish technical patterns — similar to what happened on Mar 21 when SPX beat the previous Mar 7 high by 0.40 pts.
From a technical standpoint, this won’t necessarily trash the harmonic or the yellow H&S Pattern. A double-top is a legitimate retracement in harmonics. And, the height of the right shoulder above the neckline relative to the head is technically more important than whether it tops the head in nominal price.

Yet, psychologically, the bulls will have made their point and busted the smaller, red H&S. Whether prices break out or this is a muppet trap, much damage will have been done.
UPDATE: 11:10 AM
So, SPX made a new high, topping the Mar 21 level by 0.64 points. While three new highs in the span of one month is impressive, I think it’s wise to remain cautious. SPX had three new highs in the span of 11 sessions in Mar-Apr 2012. It even featured a big-time overnight ramp job to push past the .786 at 1381.50.
 continued for members…
And, oddly enough, the small red channel connecting those three tops is a perfect fit with the bigger red channel that the bulls are trying to banish from the charts. Why? Its bottom is way down in the 1600’s — currently 1650ish and the red .886 of 1673 in early May (around our Fib time turn date.)
It’s an interesting enough looking comparison to label it a potential analog. We’ll call it the Mar 2012 analog and follow it until the bulls send it to the dust bin — which, at this rate, will be tomorrow.