

 It’s been very difficult for the bears to get any downside going over the past two weeks. Between USDJPY breaking out and VIX melting down, the algos had the upper hand. The KSA troubles were icing on the cake.
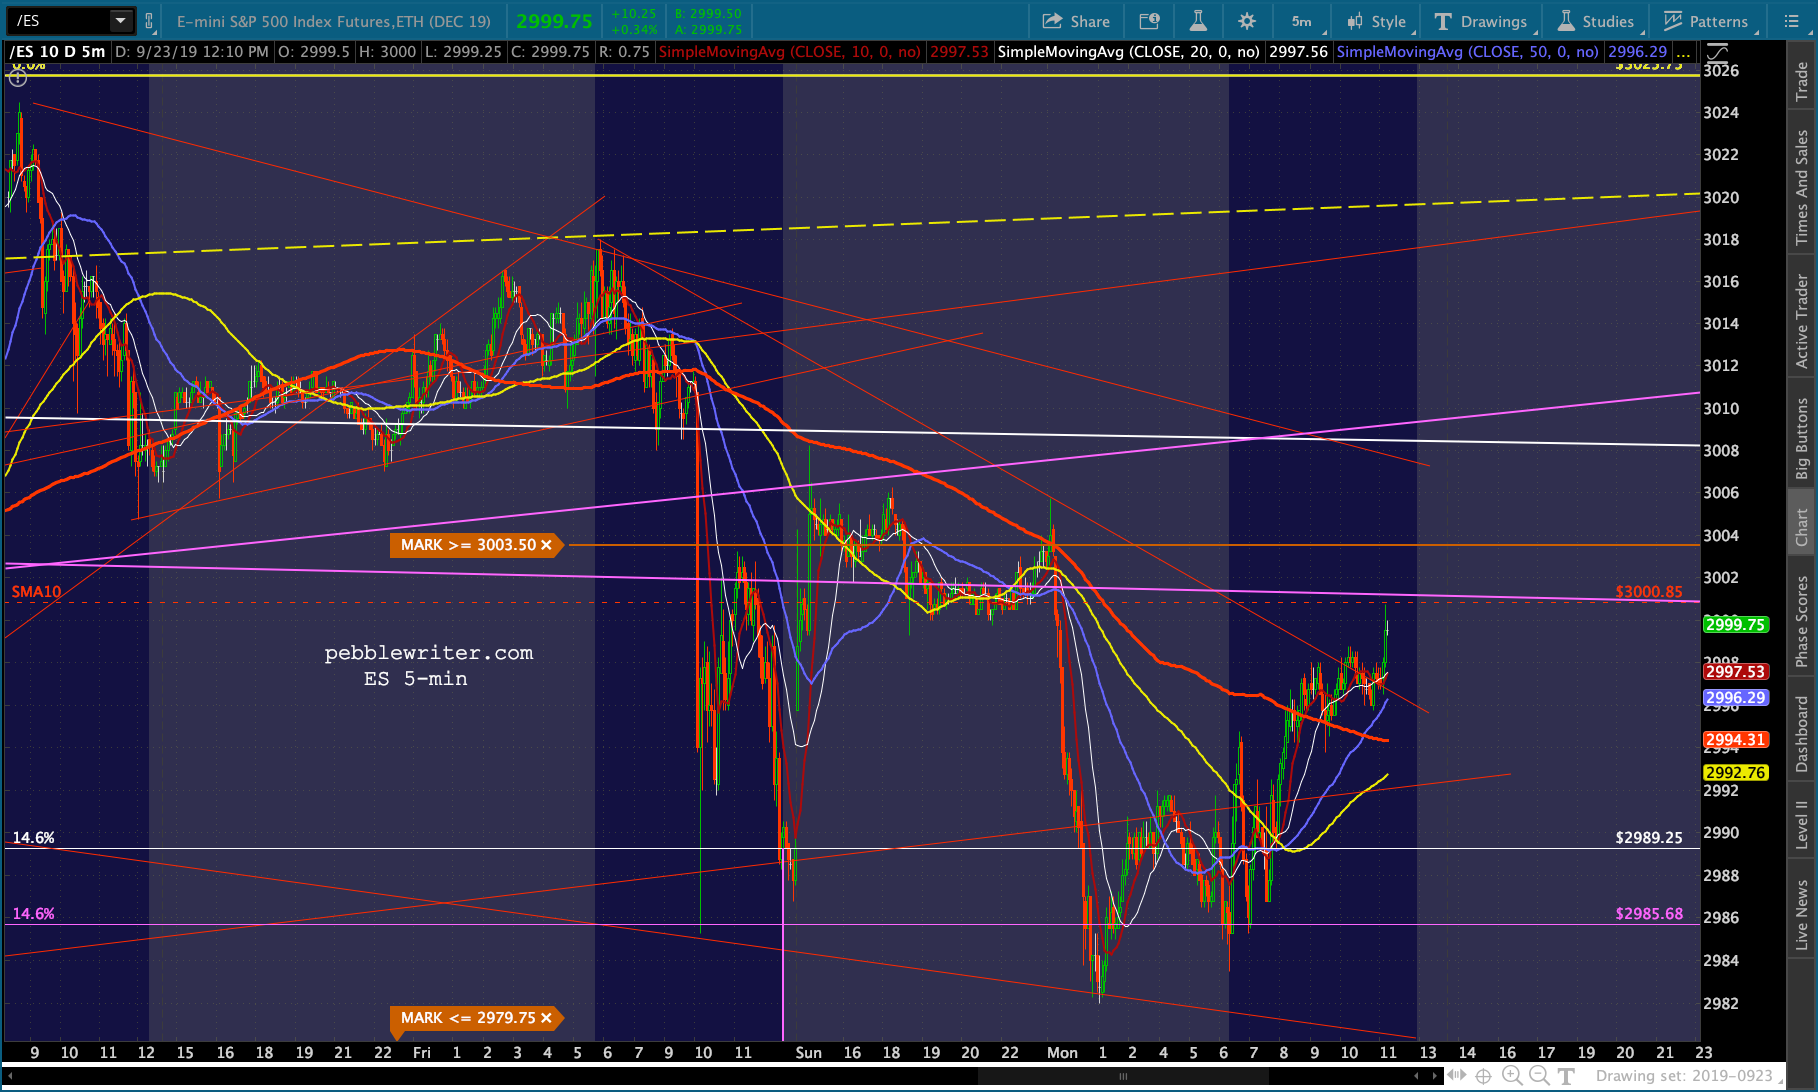
Although the initial impact was to inject some much-needed fear into the markets, the algos soon became encouraged by oil’s strength — as was witnessed last night when oil popped over 1% on the opening… …and, sent ES gapping higher by an impressive 19 points — making a lower low and completing a nice little H&S Pattern.
 No, the bears just weren’t able to get their ducks in a row. But, that was then.
Now, the ducks are very much in a row. And, from the looks of them, they’re none too happy about having to wait.
continued for members…
ES’ H&S pattern would get it down to the .382, a good start.
 The SPX big picture chart I continue to work on. If our analog holds, the next few days should see a very sharp drop.
 TNX, which IMO is due for a tumble, supports this view.
 It’s a little clearer to see on ZN’s 60-min chart.
  VIX appears to finally be done melting down. It finally closed above its SMA10 on Friday, something it hasn’t done since Sep 3.
 And, USDJPY is back in the fold and heading south.
 CL’s pop reversed sharply and has broken a little TL from Sep 12. It still looks likely to at least backtest its SMA200 and channel top.
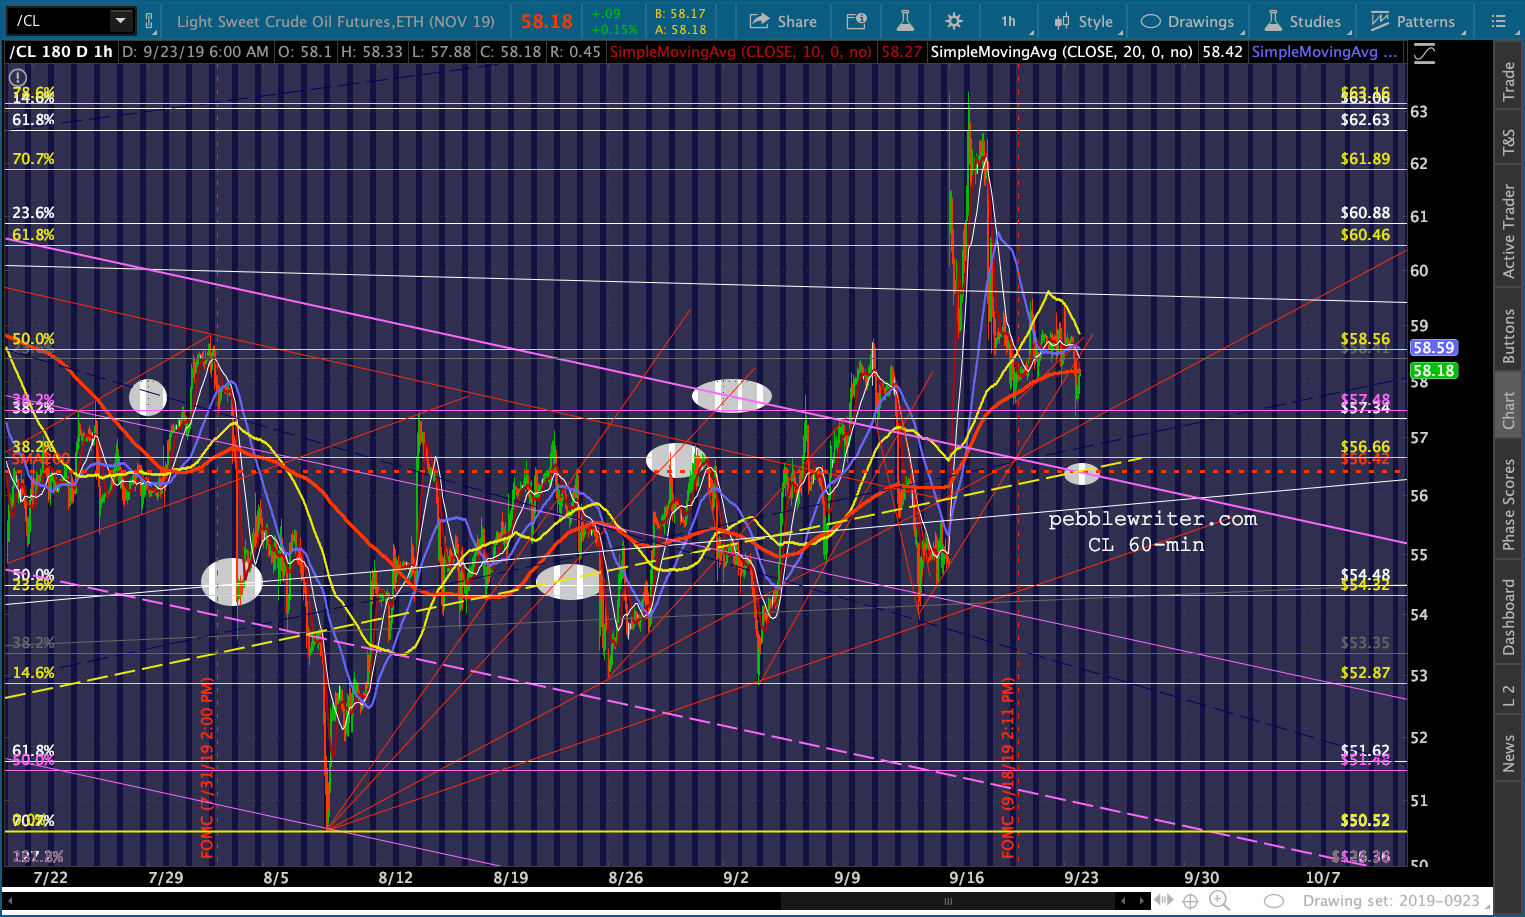
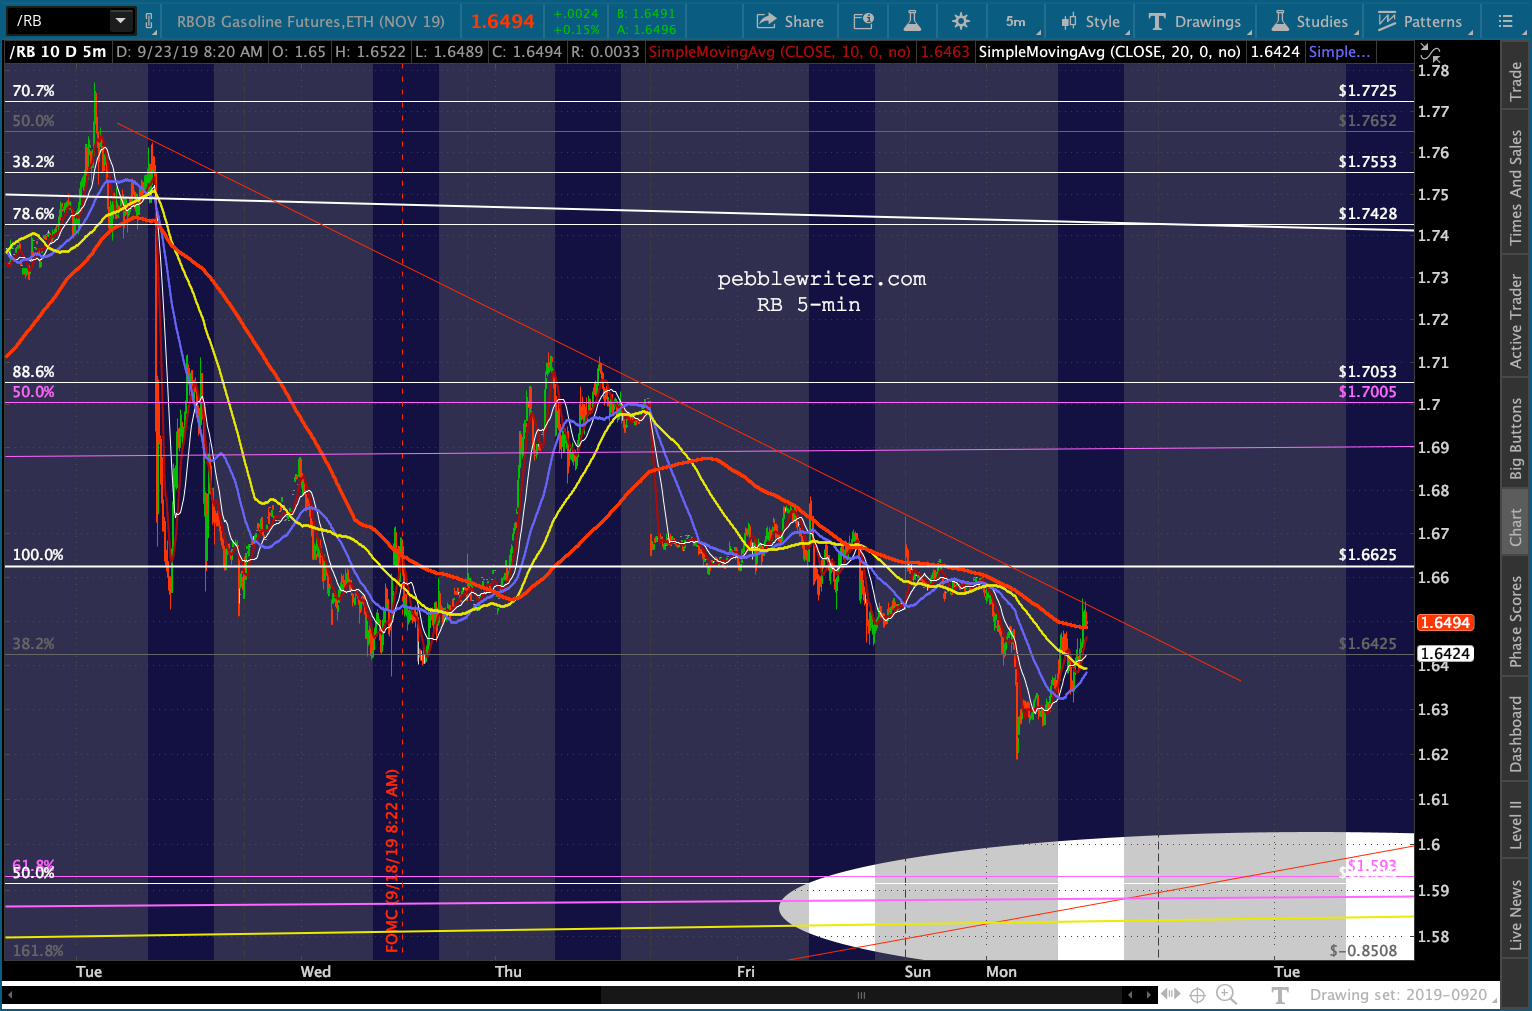
 RB has finally closed its KSA gap.
 The charts that most have my attention are bond charts.
I’ve spent a lot of time looking at 2s10s — a model which continues to be bearish as the curve heads back toward zero. The quicker moving of those two components, of course, is the 2Y.
The chart below shows how the 2Y breaking trend can be quite damaging to stocks. There are two types of TLs (shown in yellow below) which should be watched.
The rising TLs, when initially broken, signal a top is approaching. A break of the horizontal TLs — i.e. horizontal support — signal a fairly immediate drop. The chart below shows a close-up of the last 10 years. The 2011 breakdown was limited to only a 21% drop in SPX because the 2Y didn’t drop much after breaking below 0.33. Initially it dropped as low as 17 bps. But, it then spent the next 18 months bumbling along at 22 bps or higher.
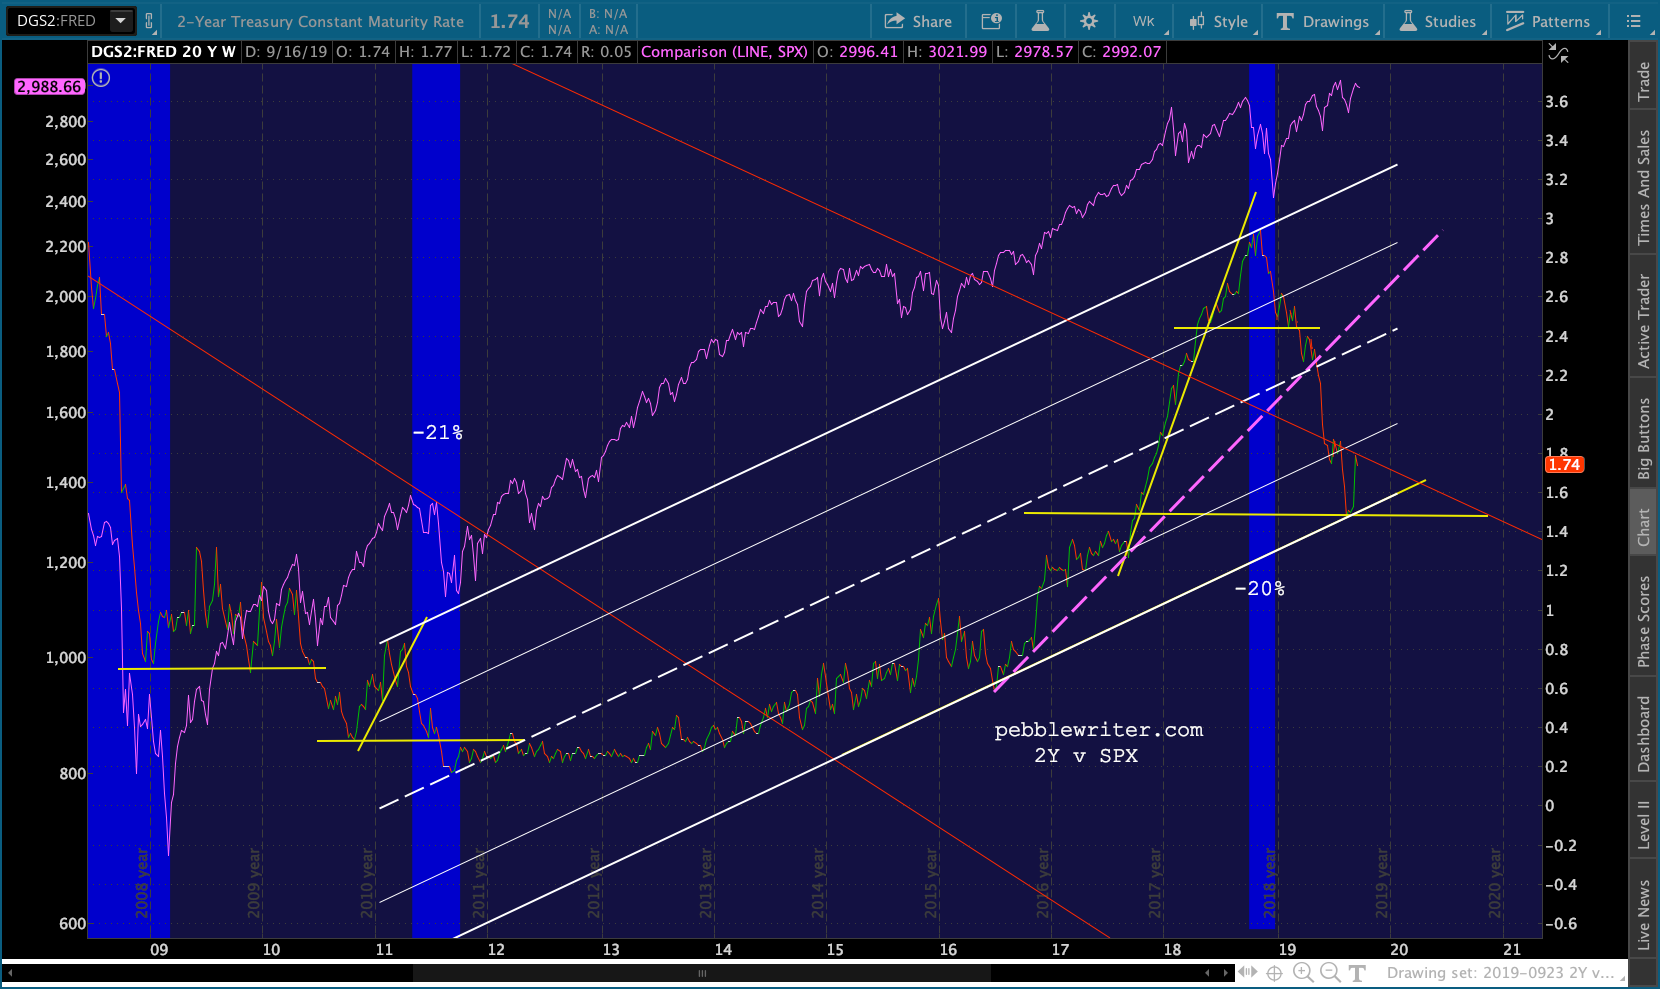 It began a nice uptrend in July 2016 (an aborted SPX dip) and rose all the way until Oct 2018. The yellow TL broke down a few times along the way, with the most notable instance on Feb 2, 2018. It’s easier to see if we switch from a weekly to a daily chart.
 In this instance, there was no need for horizontal support to instigate a drop. The market was exceptionally overbought and was itching for a reason to fall apart. A similar situation occurred in Nov 2018.
[How overbought, you ask? The daily DJIA RSI had reached 88.69, a level surpassed since 1902 only twice: Jun 20, 1944 and Apr 16, 1915. Weekly RSI, which reached 92.029 in Jan 2018, had been higher only once: 92.032 in Nov 1904.]
If we push in a little closer, we can see several breakdowns below horizontal support. But, the support wasn’t all that strong, consisting each time of only one, recent minor dip.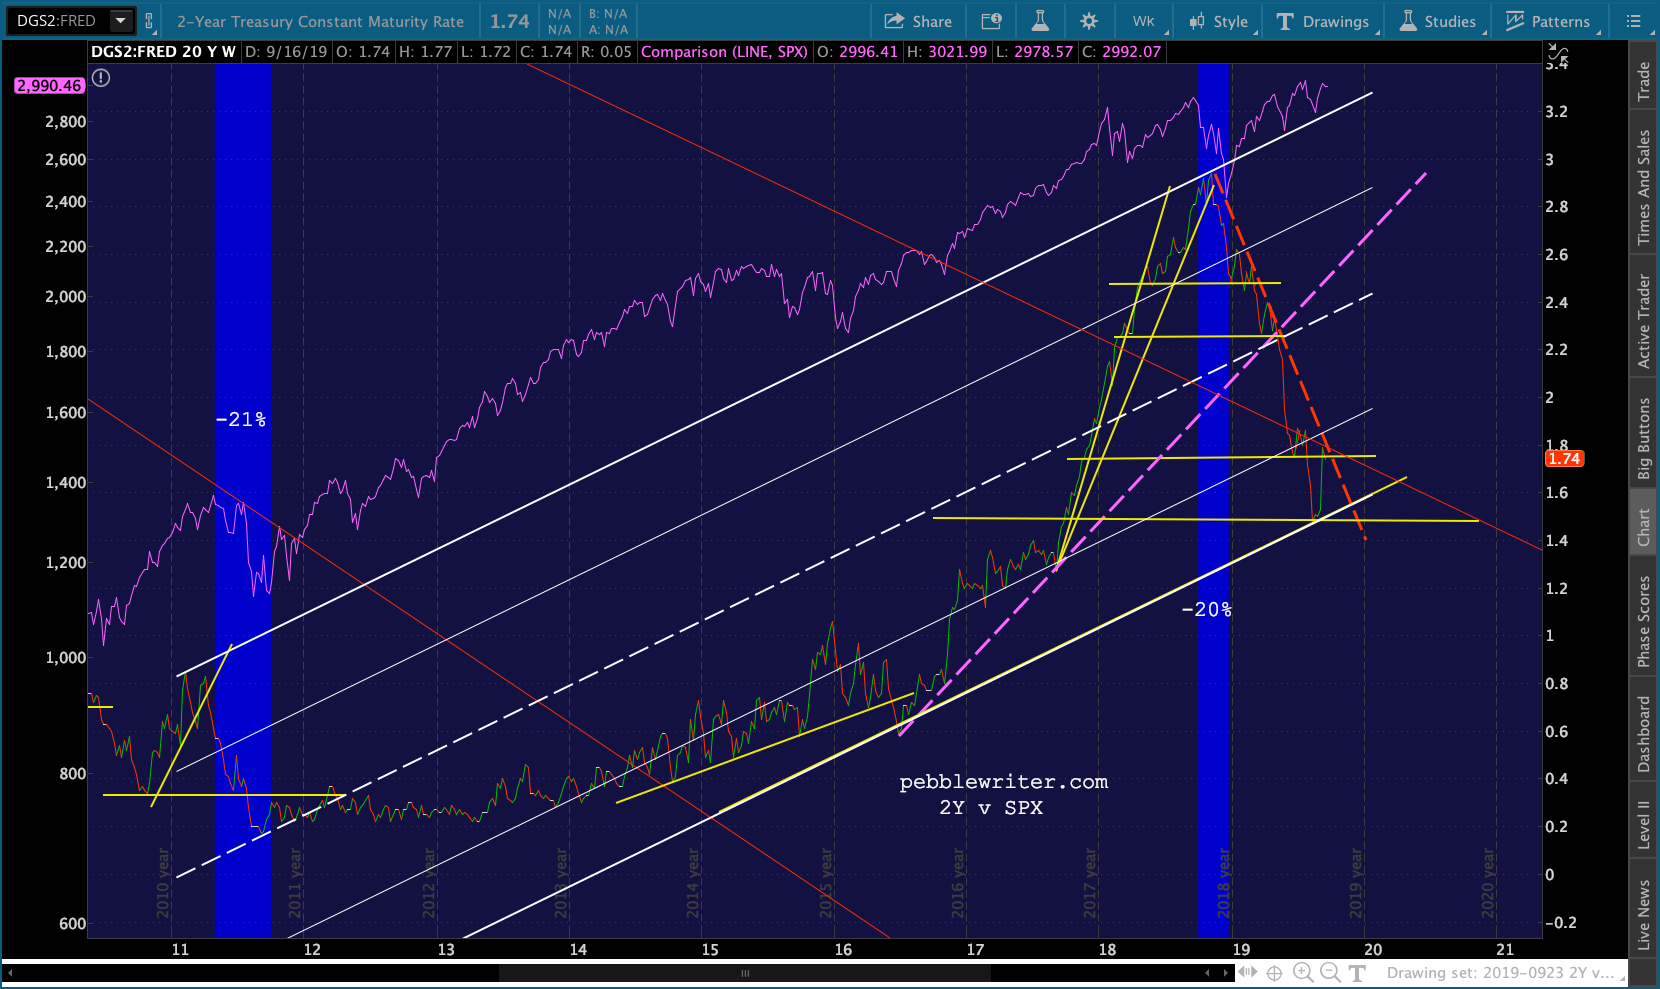 The more interesting signals are the rising dashed purple TL which was broken in 2019, the falling thin red TL that the 2Y broke above in Feb 2018 and back below in Jun 2019, and the falling, dashed red TL from the Nov 2018 top.
The dashed purple TL is analogous to the rising yellow TLs. A break — which occurred when the 2Y dropped through the white channel midline and one of the yellow horizontal support lines — was bearish for stocks.
The thin red line was potentially more important. We saw three breakouts above similar red TLs in 1994 (Point A), 1999 (B) and 2005 (C.) Each one bought SPX a little more time and enabled higher highs.
But, the breakouts typically end up failing — taking stocks down with them. Breakout A merely backtested that red TL instead of failing, so there was no damage done in that instance.
But, breakouts B and C fell back below the relevant TL, signalling an important top had already occurred. That’s right, it was a lagging indicator. It lagged by 9 months in 2000 and 2 months in 2007.
Although lagging, the signals were still important. When breakout B failed, the market had only fallen 14% on its way to a 51% drop. When C failed, the losses were only 11% on the way to 58%. Importantly, the indicator confirmed that the market had topped and was going to drop much further.
 The reason we care, of course, is that the 2Y has broken out twice more in recent years. More importantly, the most recent breakout has failed. After failing, the 2Y bounced off the bottom of the white channel, and the horizontal support and bounced back up to backtest the failed red TL.
 In failing in June 2019, it has confirmed the recent top. Note that it was unable to break out above the dashed red TL. All that’s left now is for the white channel to break down, opening the door to the rest of the losses the pattern indicates. As in 2007, we are about two months post-breakdown.
Is it proof that a plunge in equity prices is imminent? Of course not. Stocks are receiving much more support from buybacks, algos and central bankers than they did in 2007. But, a breakdown in 2Y still means the same thing: a flight to safety.
UPDATE: 12:00 PM
VIX has scuttled the H&S playing out…at least, so far. 

 Otherwise, CL, RB and USDJPY have all opened the door to lower stock prices.
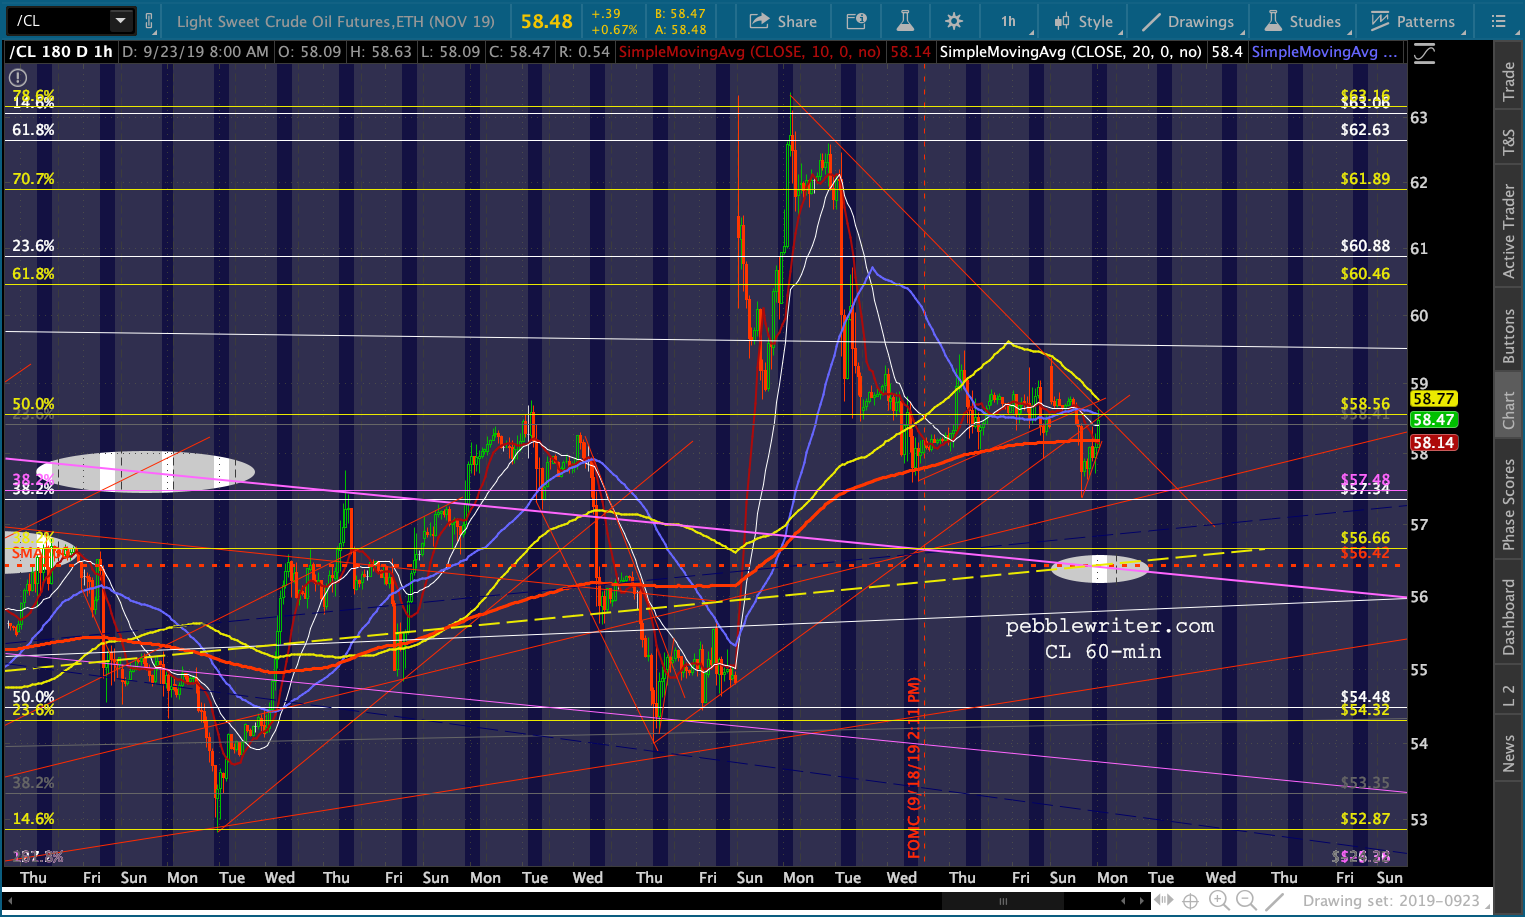

UPDATE: 3:12 PM
CL and (especially) RB suddenly broke out…
 …and VIX broke down (over 8% from this morning’s highs)…
 …at the exact same moment that SPX and ES reached their red TLs from Friday. Both are now backtesting their SMA10s.
 No question that the algos are still very much in charge…until they aren’t. USDJPY is angling higher, but its breakout remains kaput.
 This is very frustrating, waiting for something to happen which seems unlikely to happen. Given the degree of manipulation in the “markets” my sense is that the decline will be very big and very sudden. Otherwise, it would be too easy to trot Larry Kudlow or whoever out to a microphone and execute the usual stick save.
UPDATE: 5:30 PM
At the close, SPX closed barely in the red but above its neckline, while ES took advantage of the moments after the close to ramp higher.


 USDJPY is still suggesting additional downside.
 While RB is technically broken out…
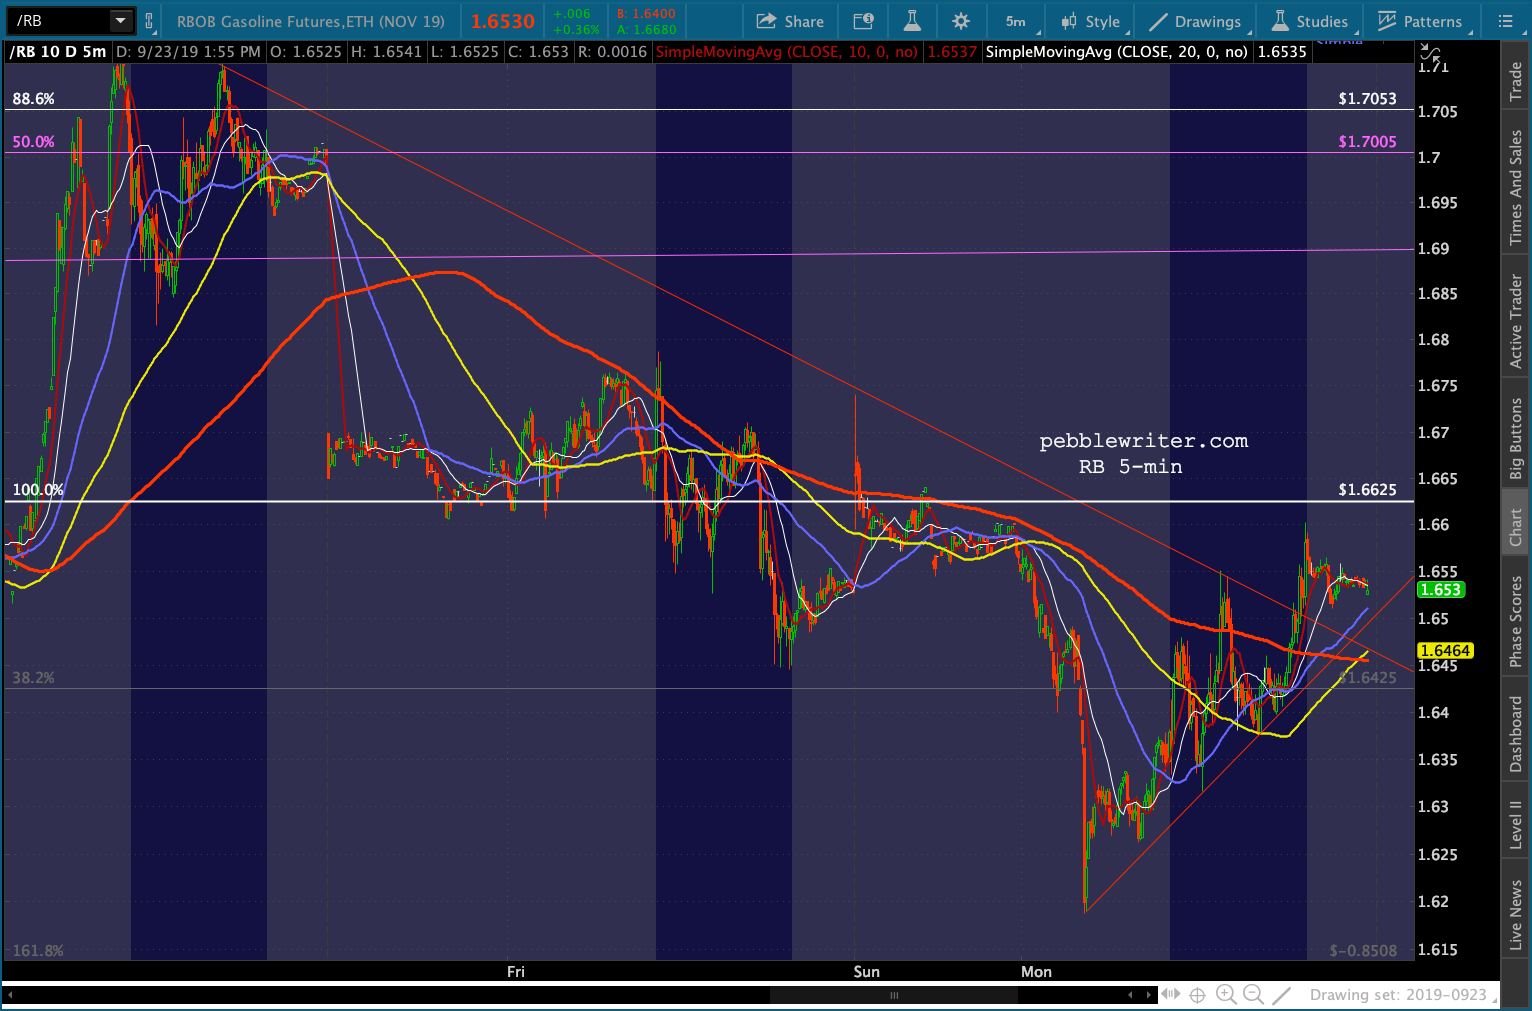 …but CL has not.
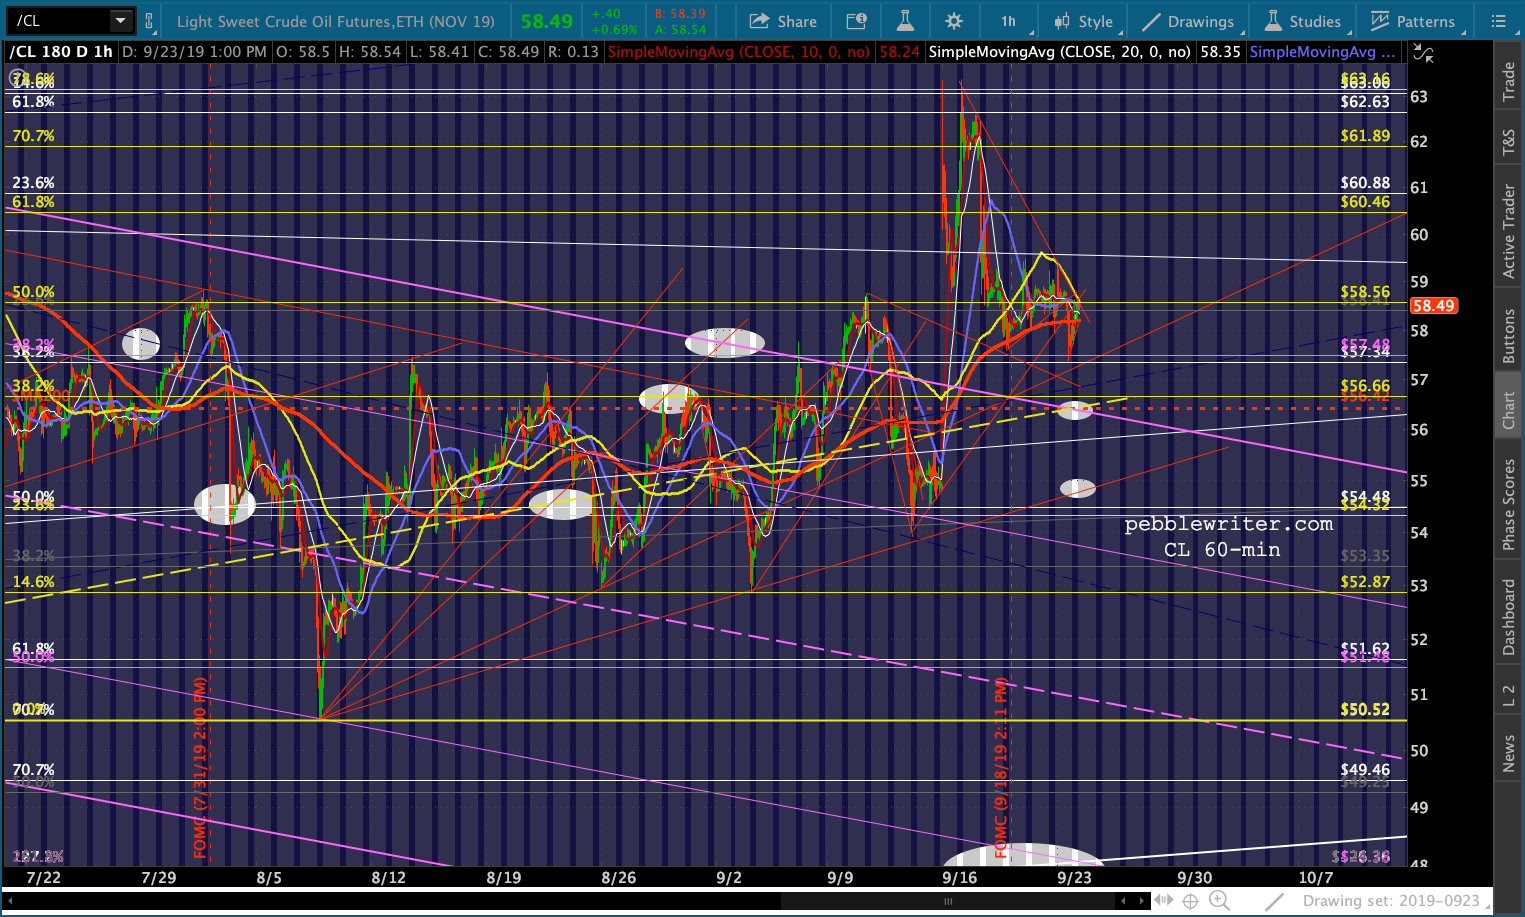 It would have been an excellent day to go golfing…