

On Day 427 of the “good and easy to win” trade war with China, we get news that the parties will sit down again sometime in October. Naturally, there has been no deescalation of any kind lately. In fact, the actions and rhetoric have increased over the past week.
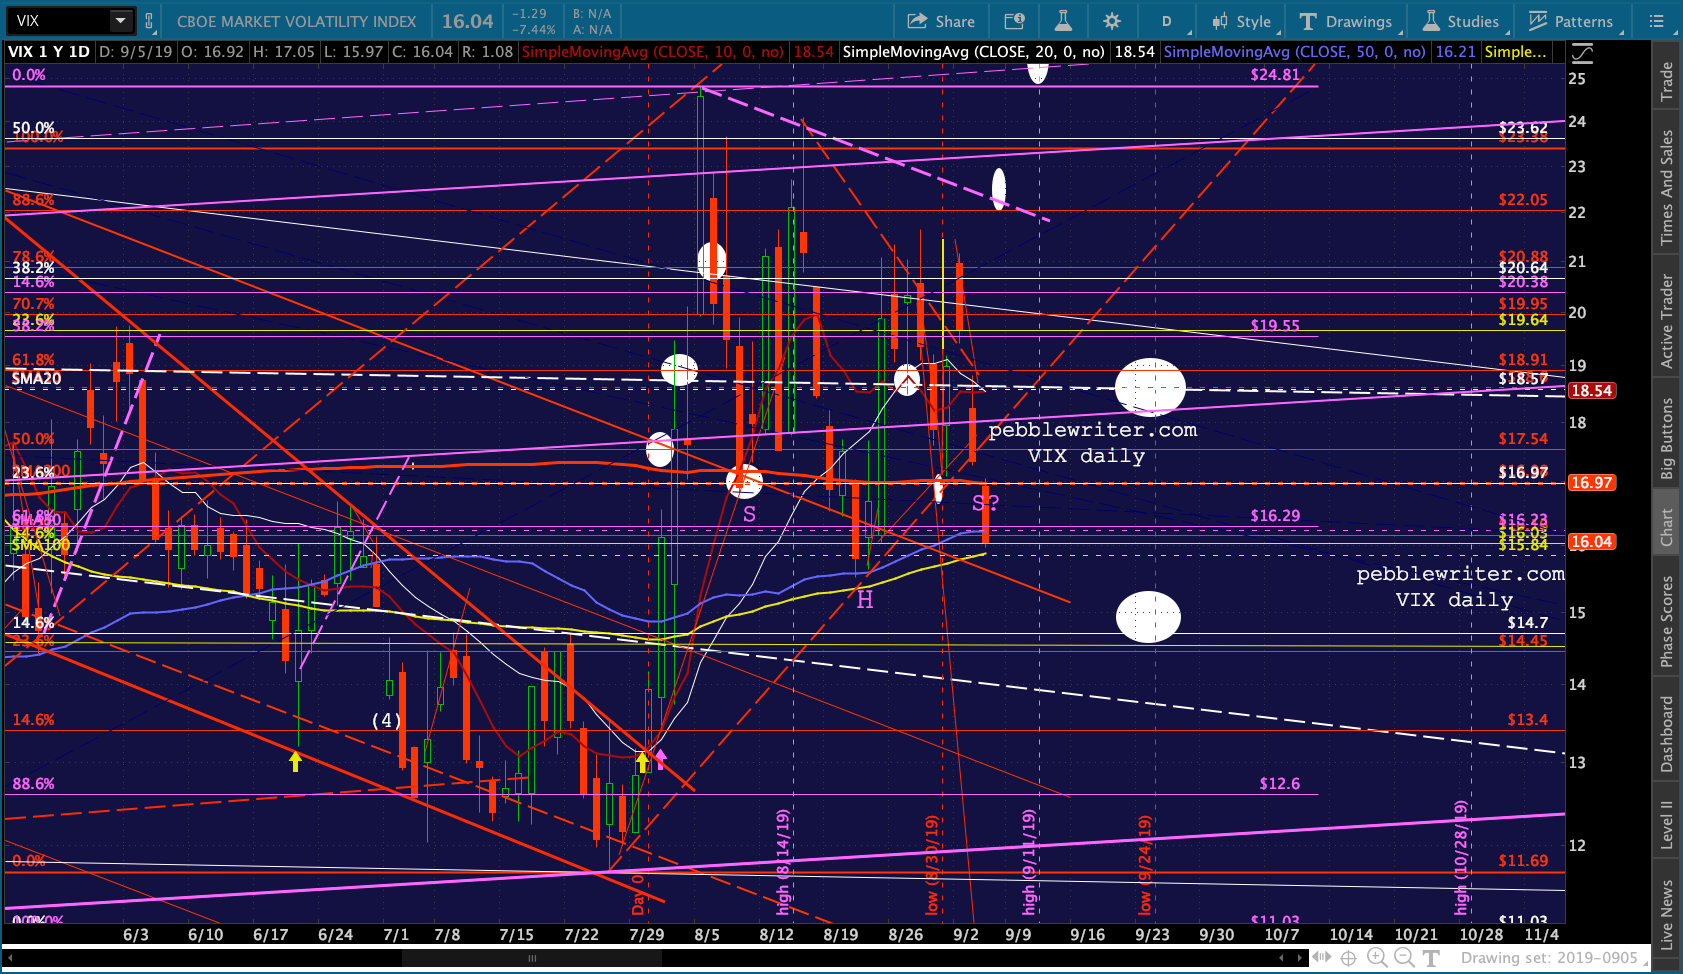
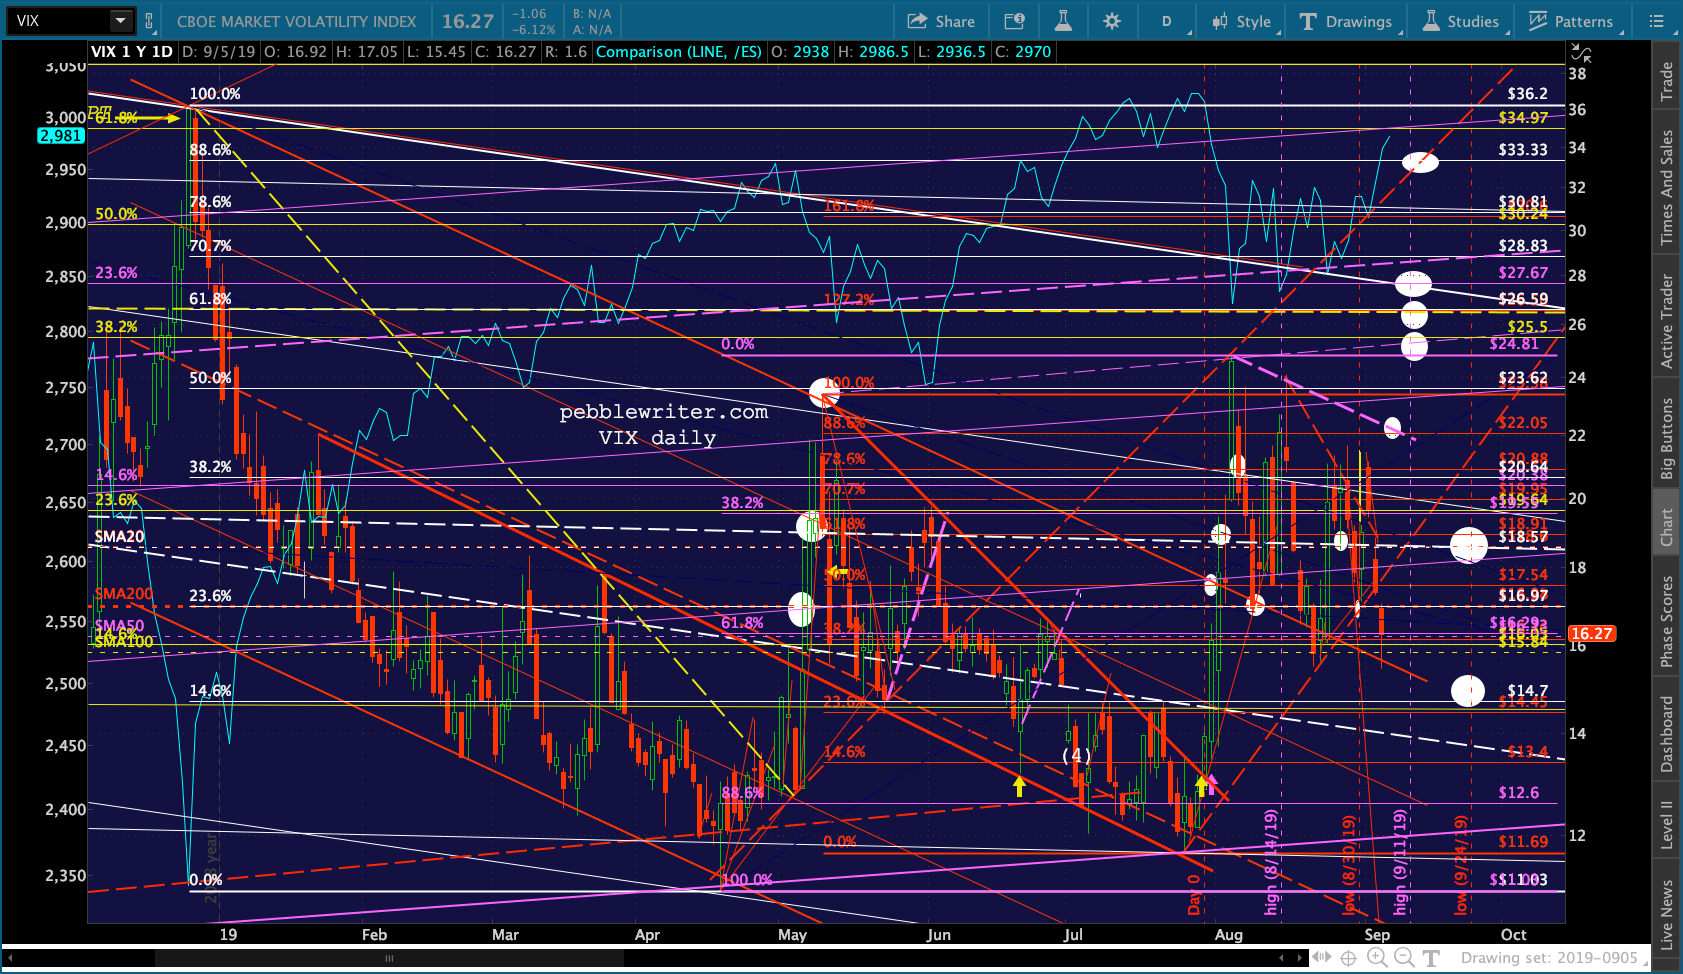
But, the algos could care less. VIX has dropped below its SMA200 and nothing else really matters. I wonder if anyone will notice that its SMA10 has pushed above its SMA20 again, the first time since July 30 — Day 0 of our analog. For our analog, it means the rally up to our next higher target — which was scheduled for last Friday — will occur three sessions late. This continues the trend of rallies being weaker and slower than anticipated.
continued for members…
The original chart from last week…
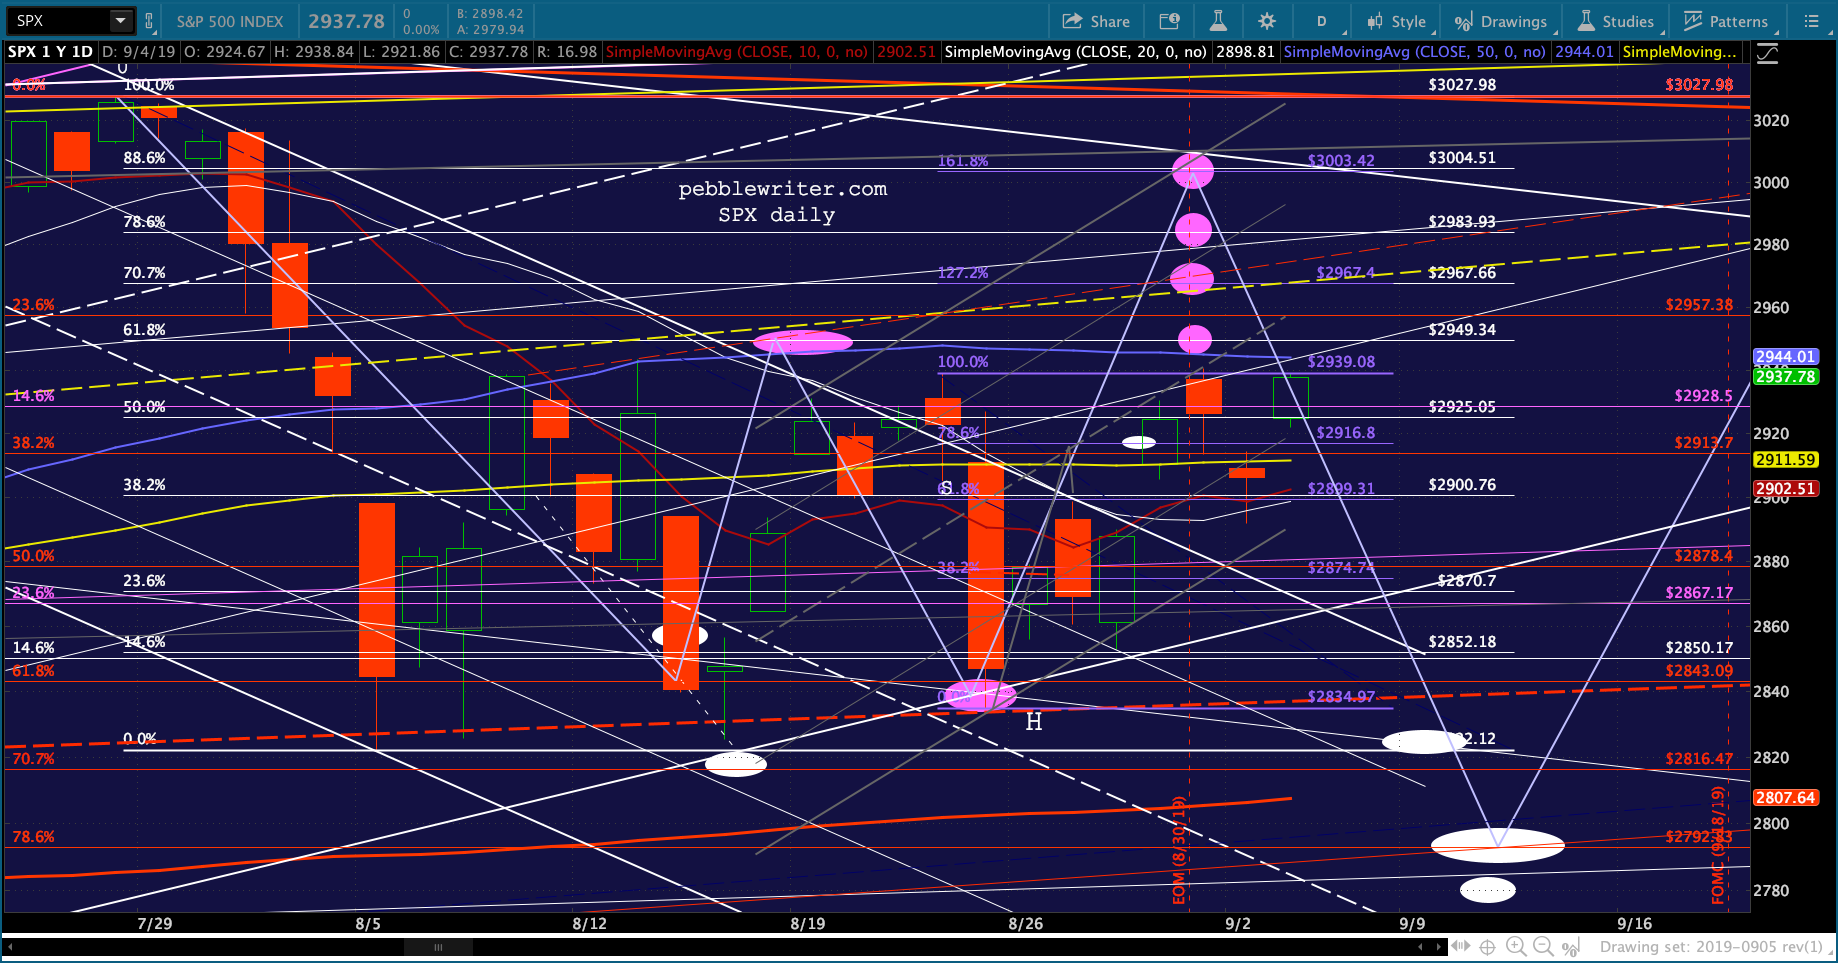 I was uneasy with the fact that the rally which should have accompanied Day 22 (pushed to Day 25 to align with the month end) barely registered a higher high. It’s no longer a problem.
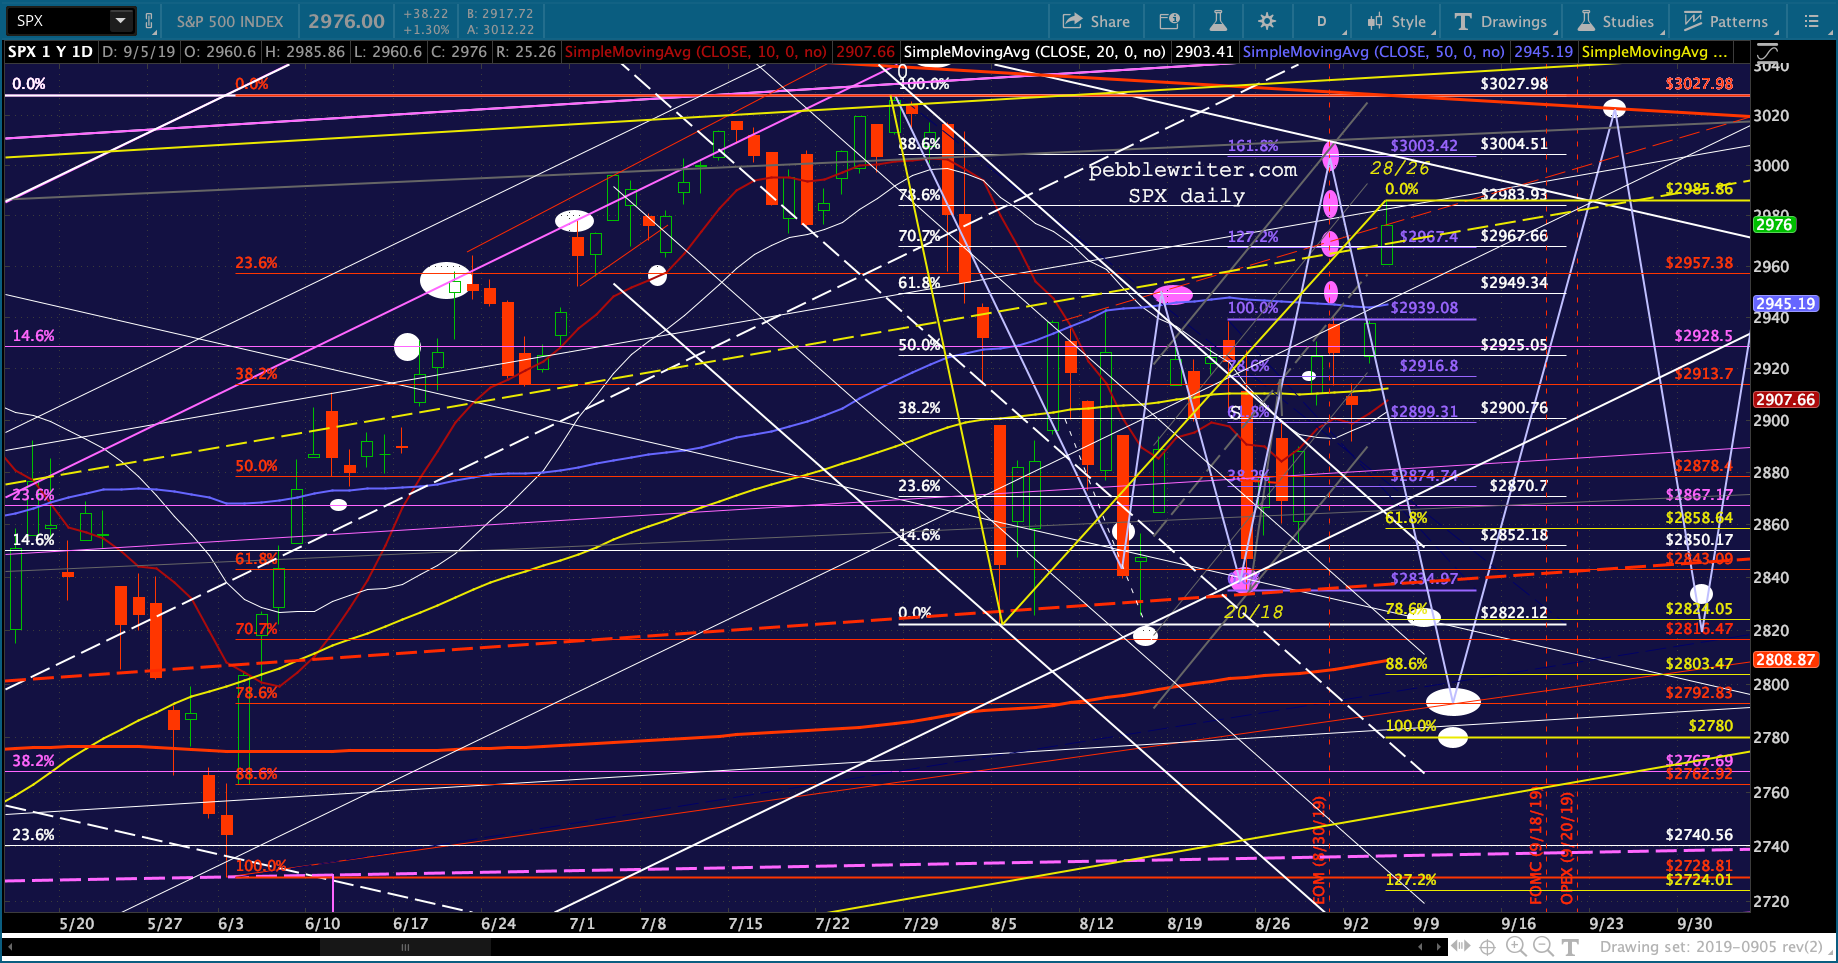
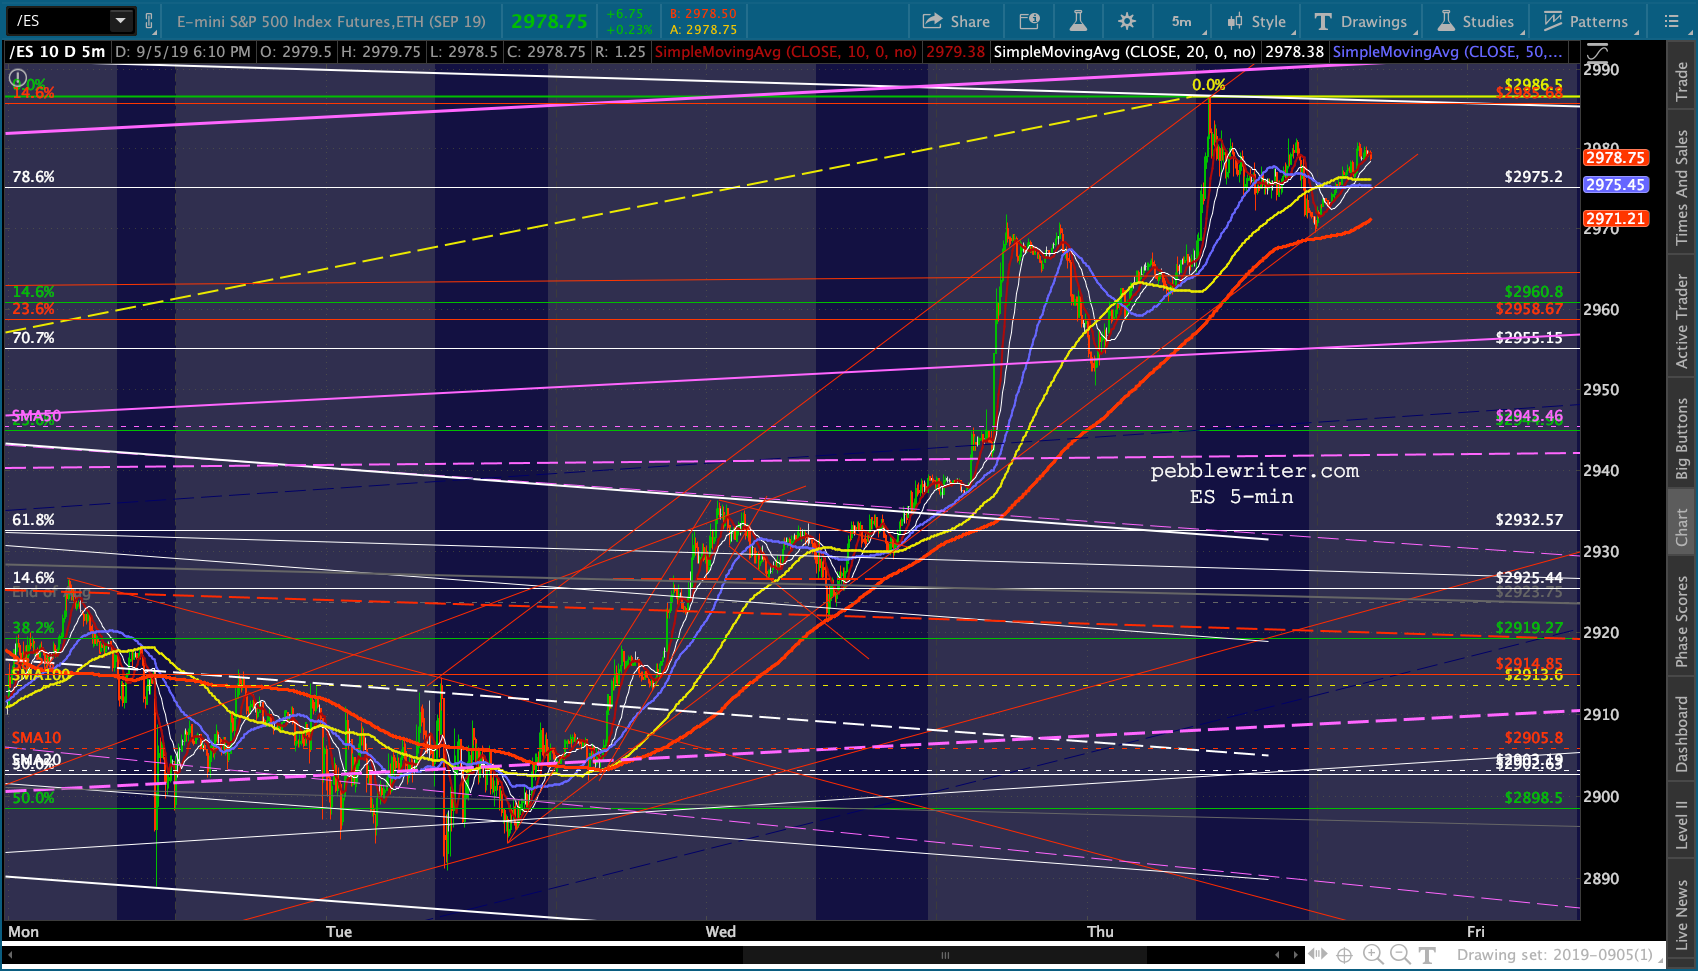
From ES’ perspective, the .786 at 2975 .20 makes plenty of sense. It’s a natural target for a Gartley Pattern, plus the C=A target for the A-B-C corrective wave targets 2977.77.
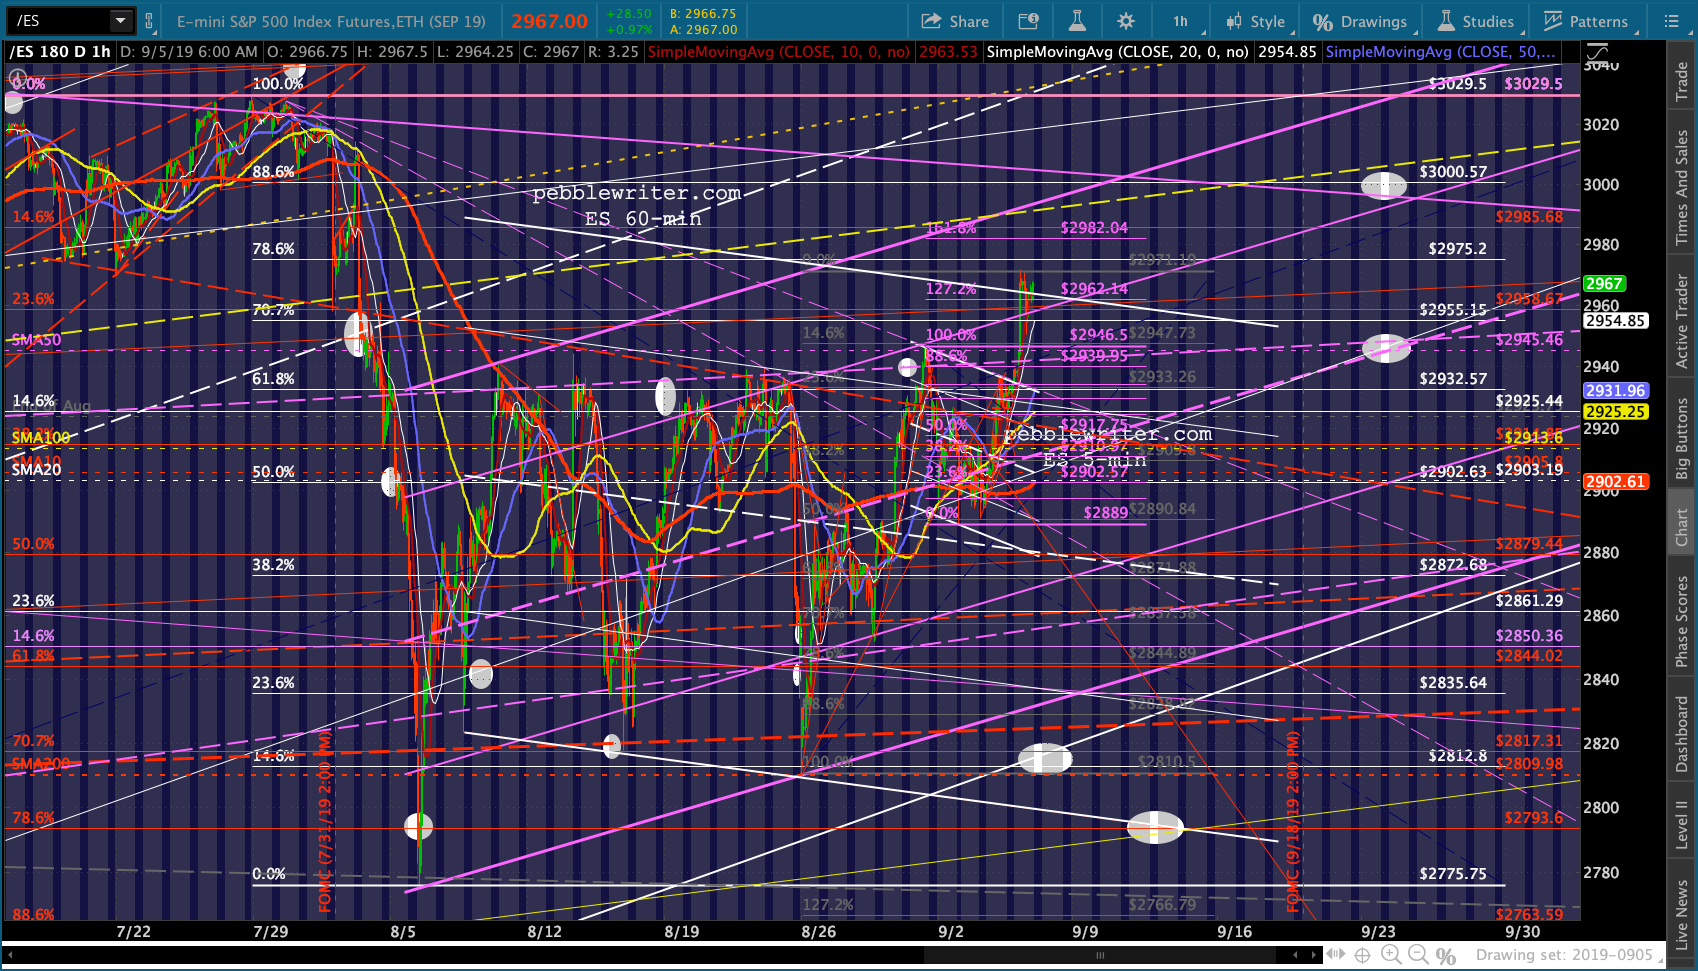 From a Fib standpoint, though, ES is way ahead of SPX. 2975.20 on ES is about 2974 on SPX, which would leave it in between its .707 and .786. When it comes to Fibs, I trust ES’ signals more than SPX. So, I’d start looking for a reversal at ES 2975. If it pops through, then the next higher targets are SPX 2983.93 and ES 3000.50.
The rest of the players…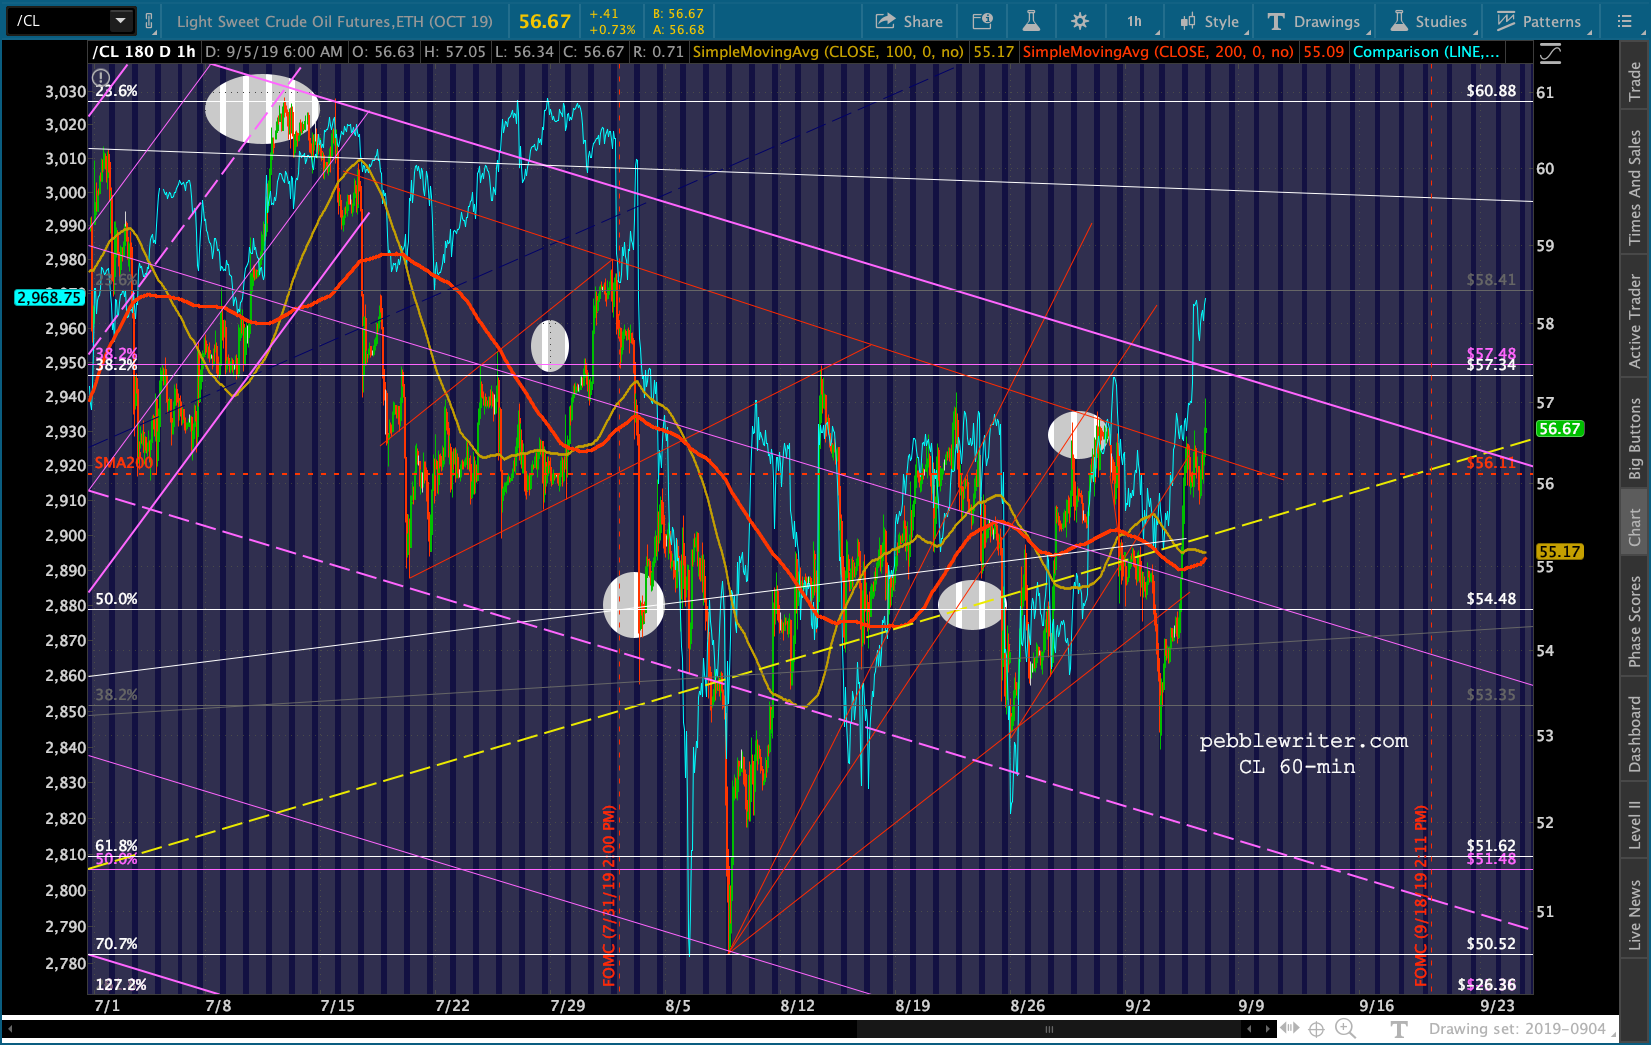
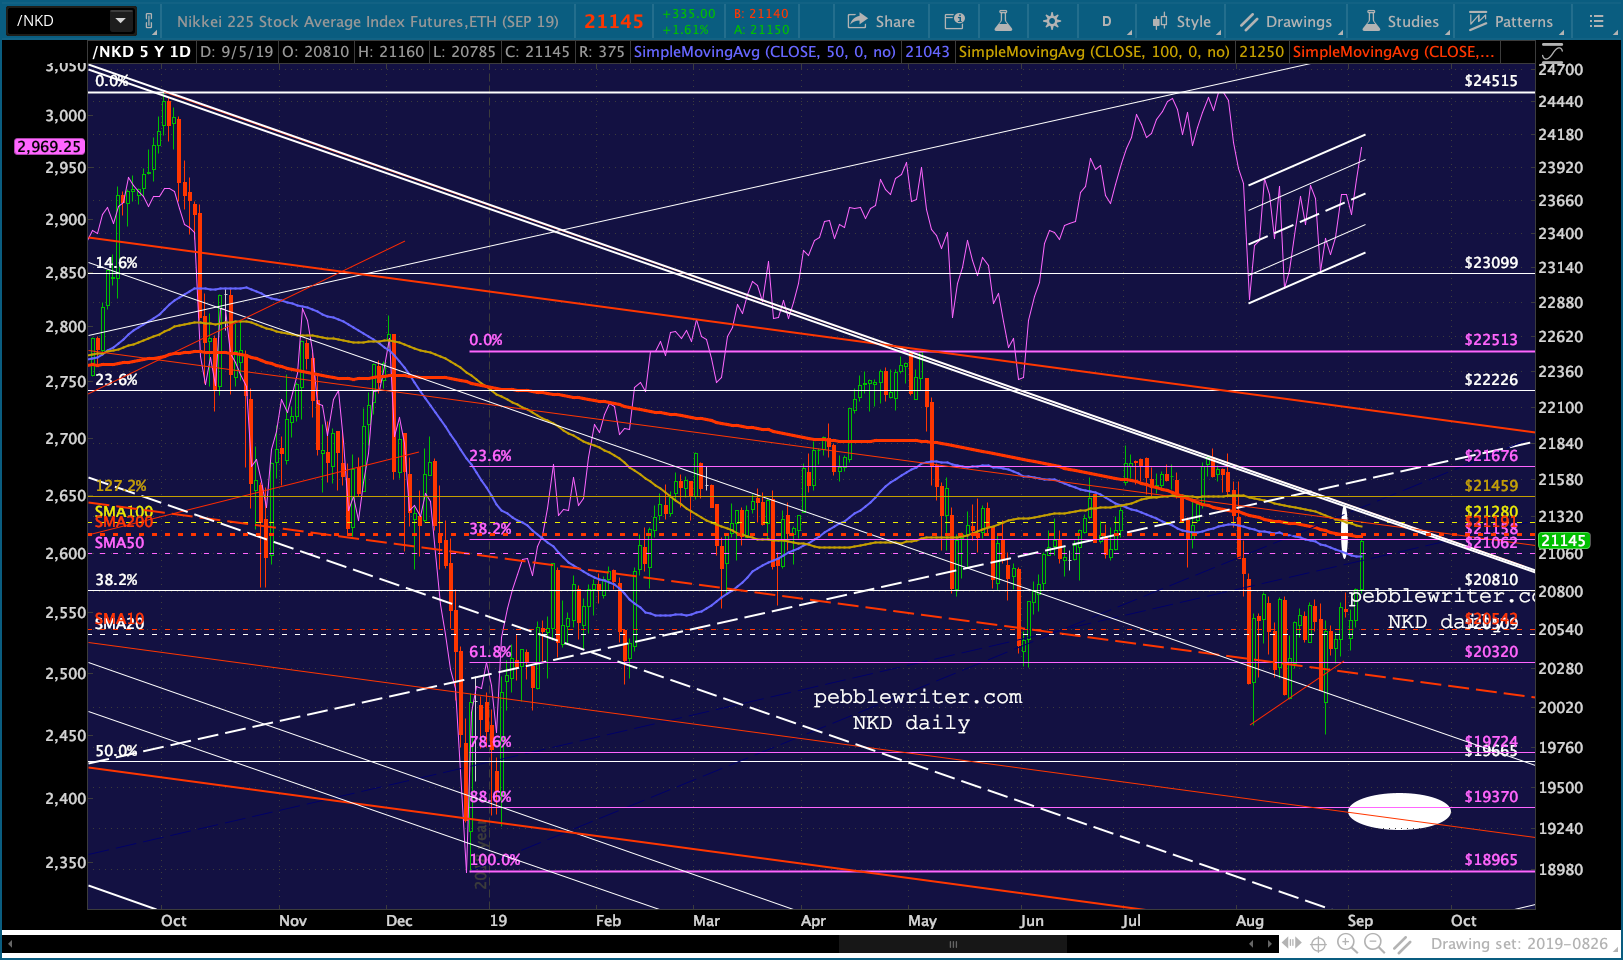
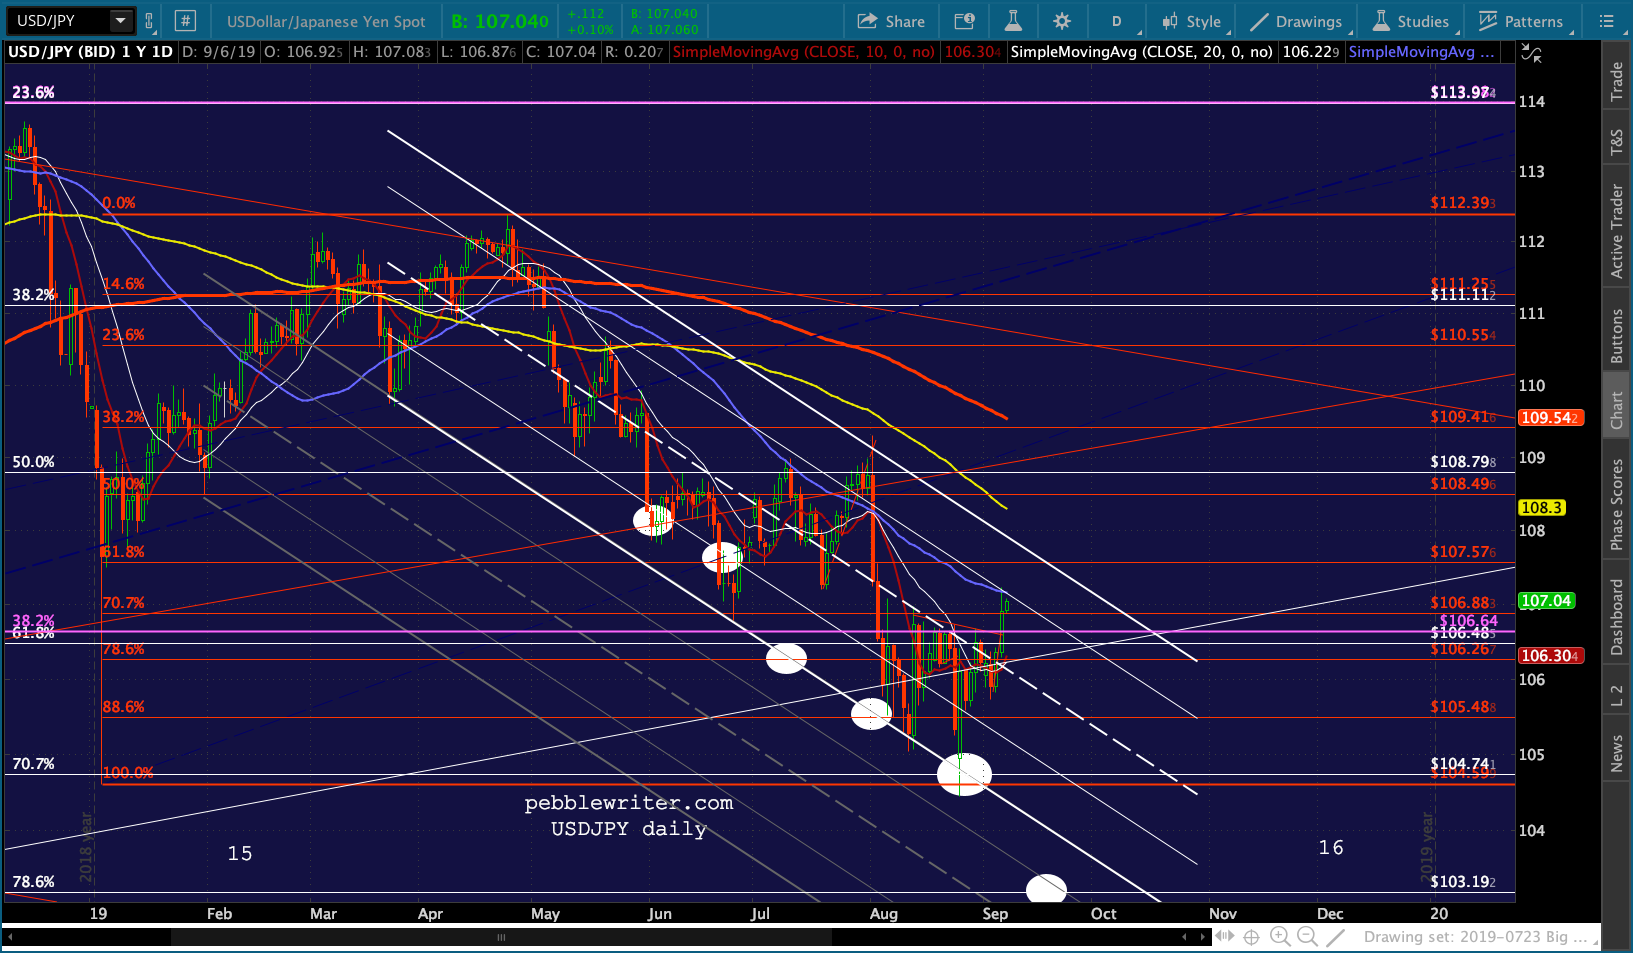
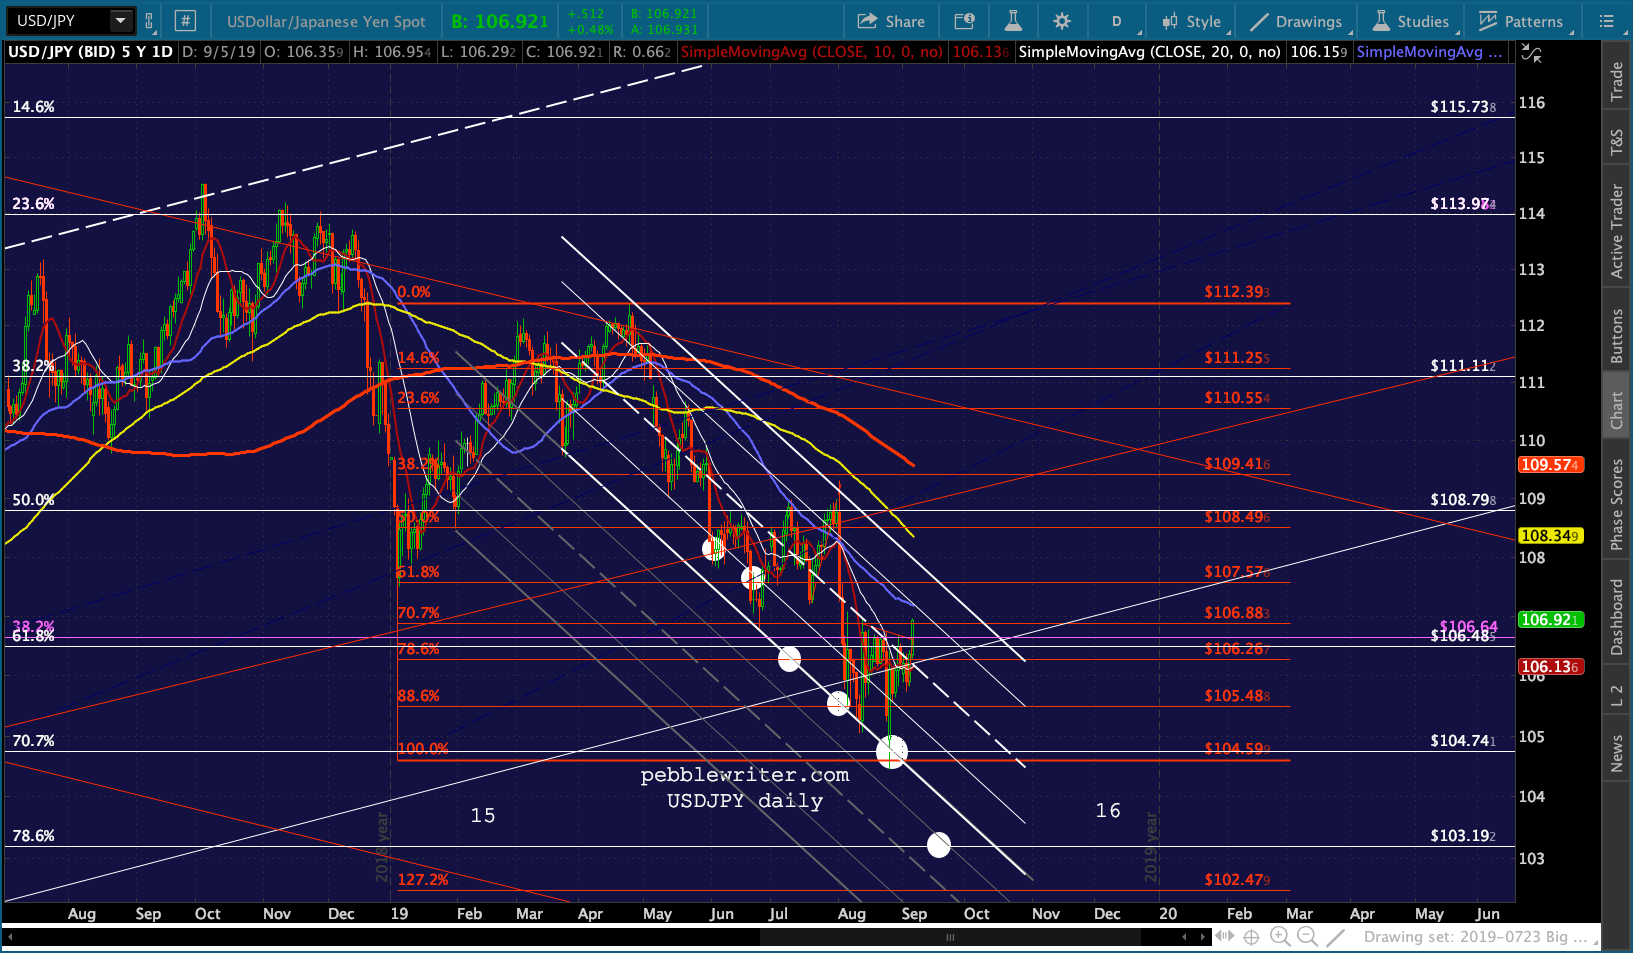 My favorite chart, this morning is NKD — which is tagging its SMA200 on USDJPY’s rally.
 UPDATE: 9:45 AM
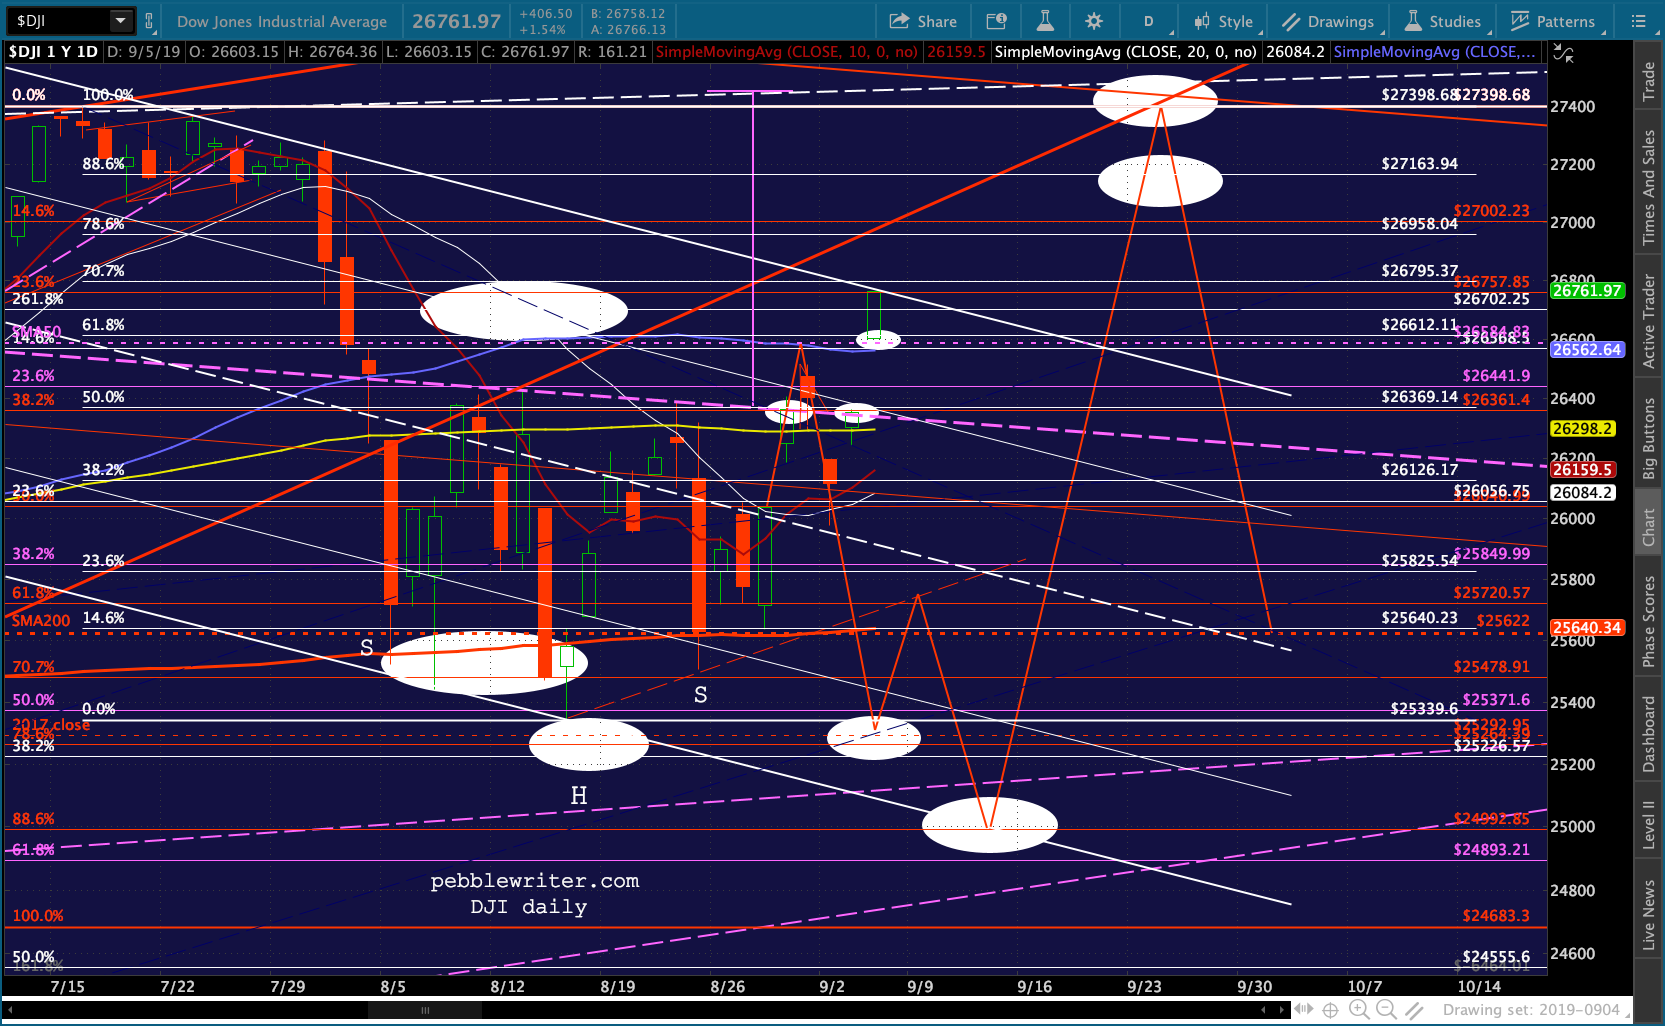
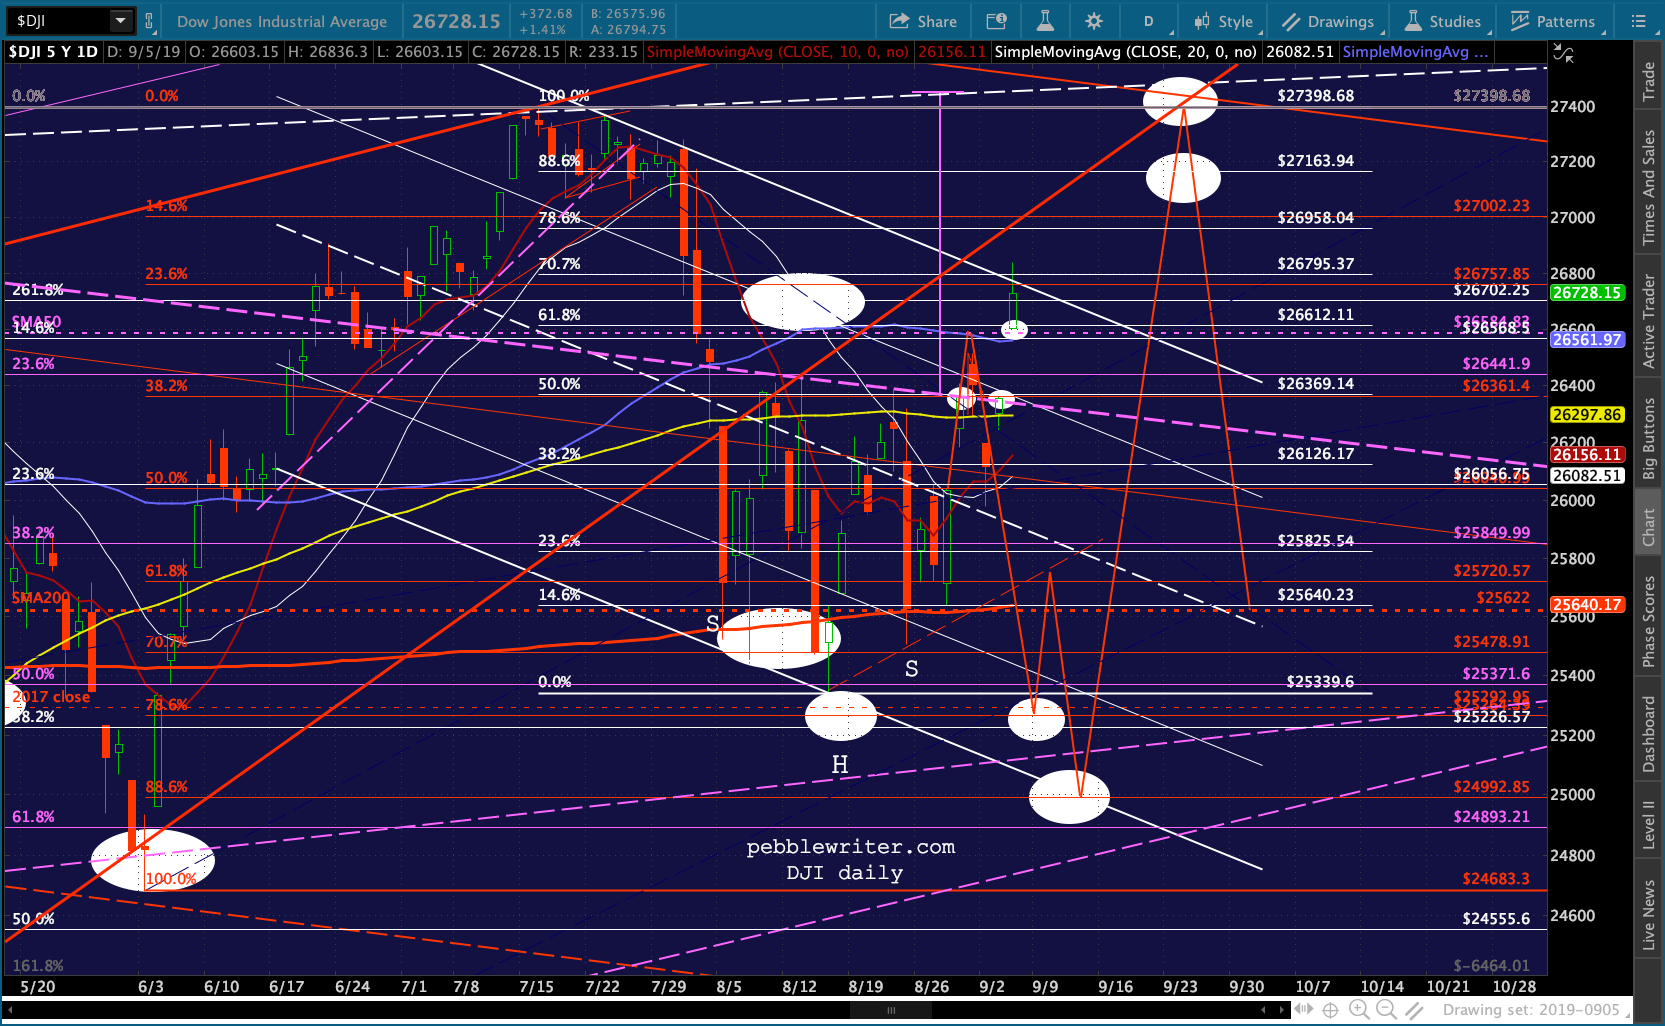
ES has pushed to 2975.50, just over the Gartley target. This would be a good time for a reversal, especially as DJIA just tagged its channel top.
My only hesitation is the lack of a catalyst. But, Non-Manufacturing ISM is due out in a few. Manufacturing ISM on Tuesday came in below 50. Will this latest data make a difference to the Fed? Remember, Powell speaks tomorrow…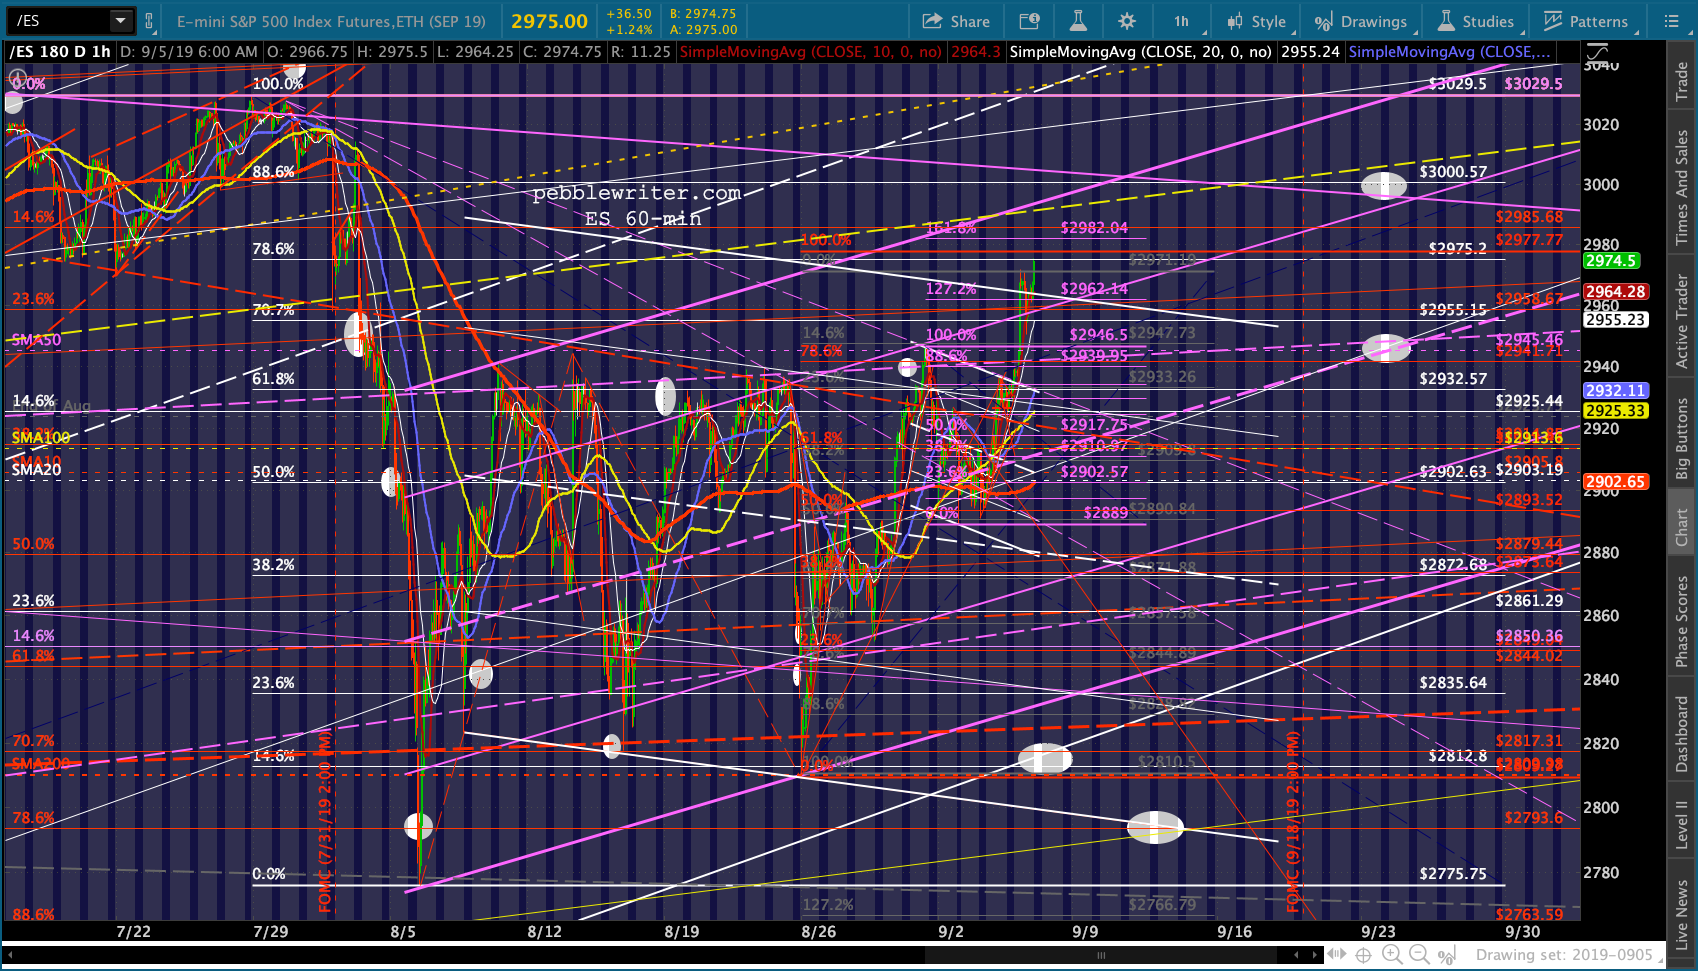
 Note that at ES 2986.50, we see the makings of an A-B-C wave (Jul 26 high at 3029.50, Aug 6 low of 2775) that targets a Wave C at 2729.38 – right on top of ES’ 2.24 extension at 2728.79. It’s highlighted below in yellow.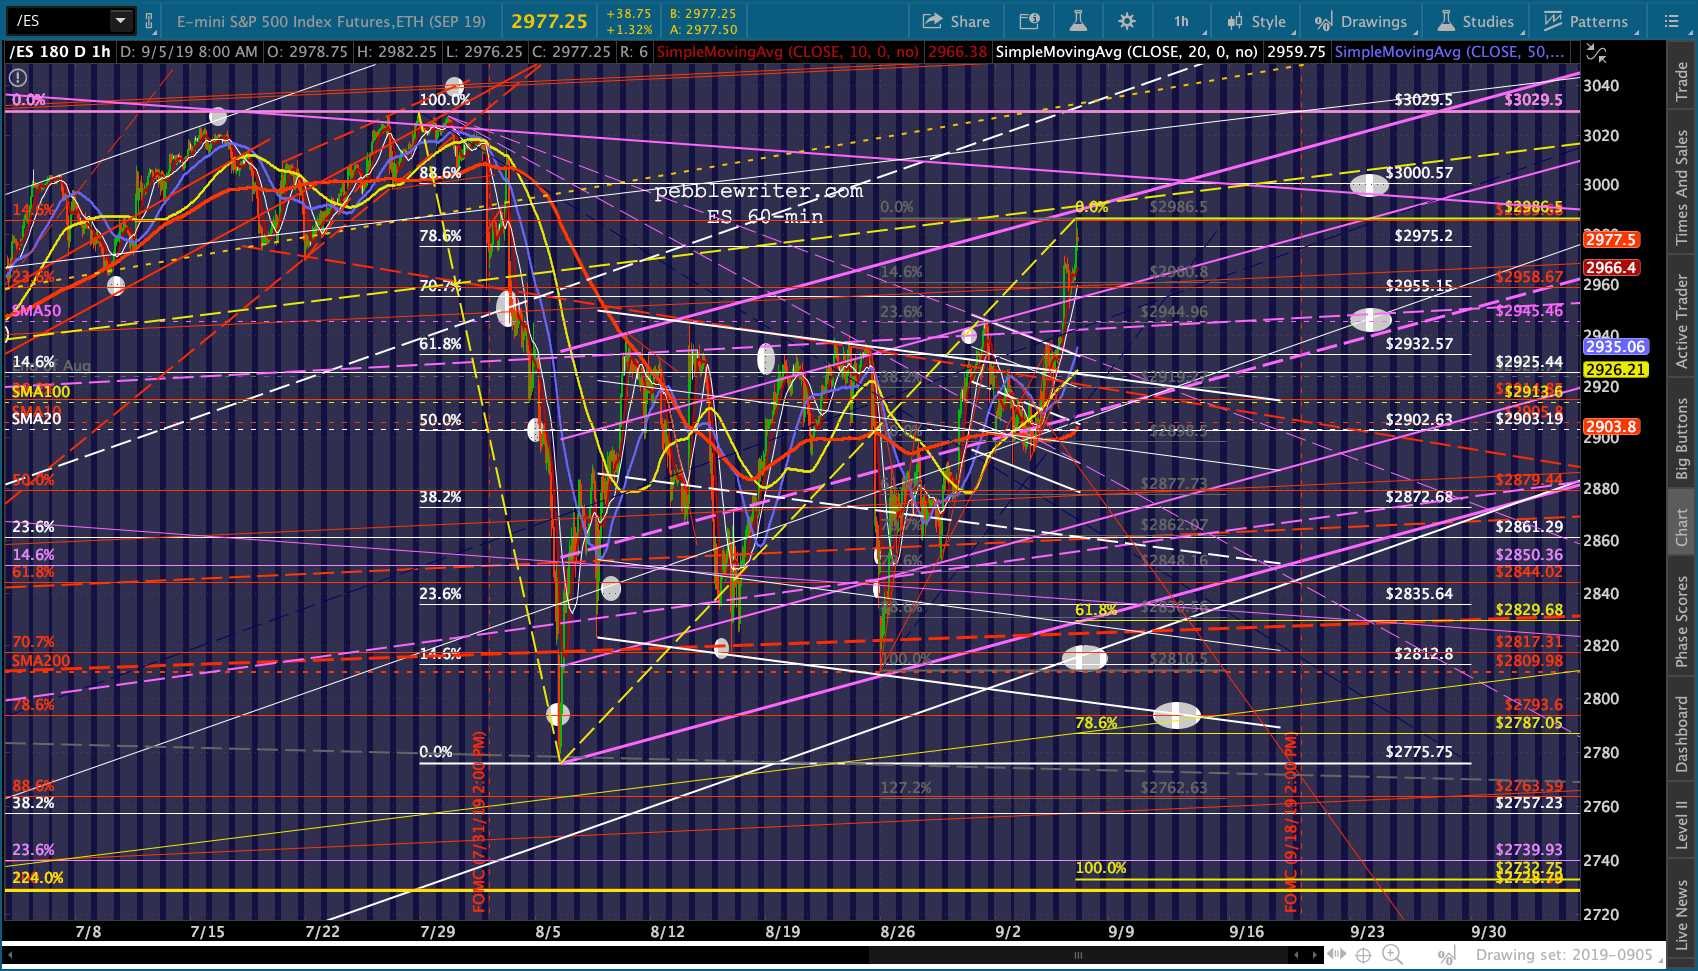
The equivalent pattern for SPX targets 2780 — already the lowest of our mid-Sept downside targets.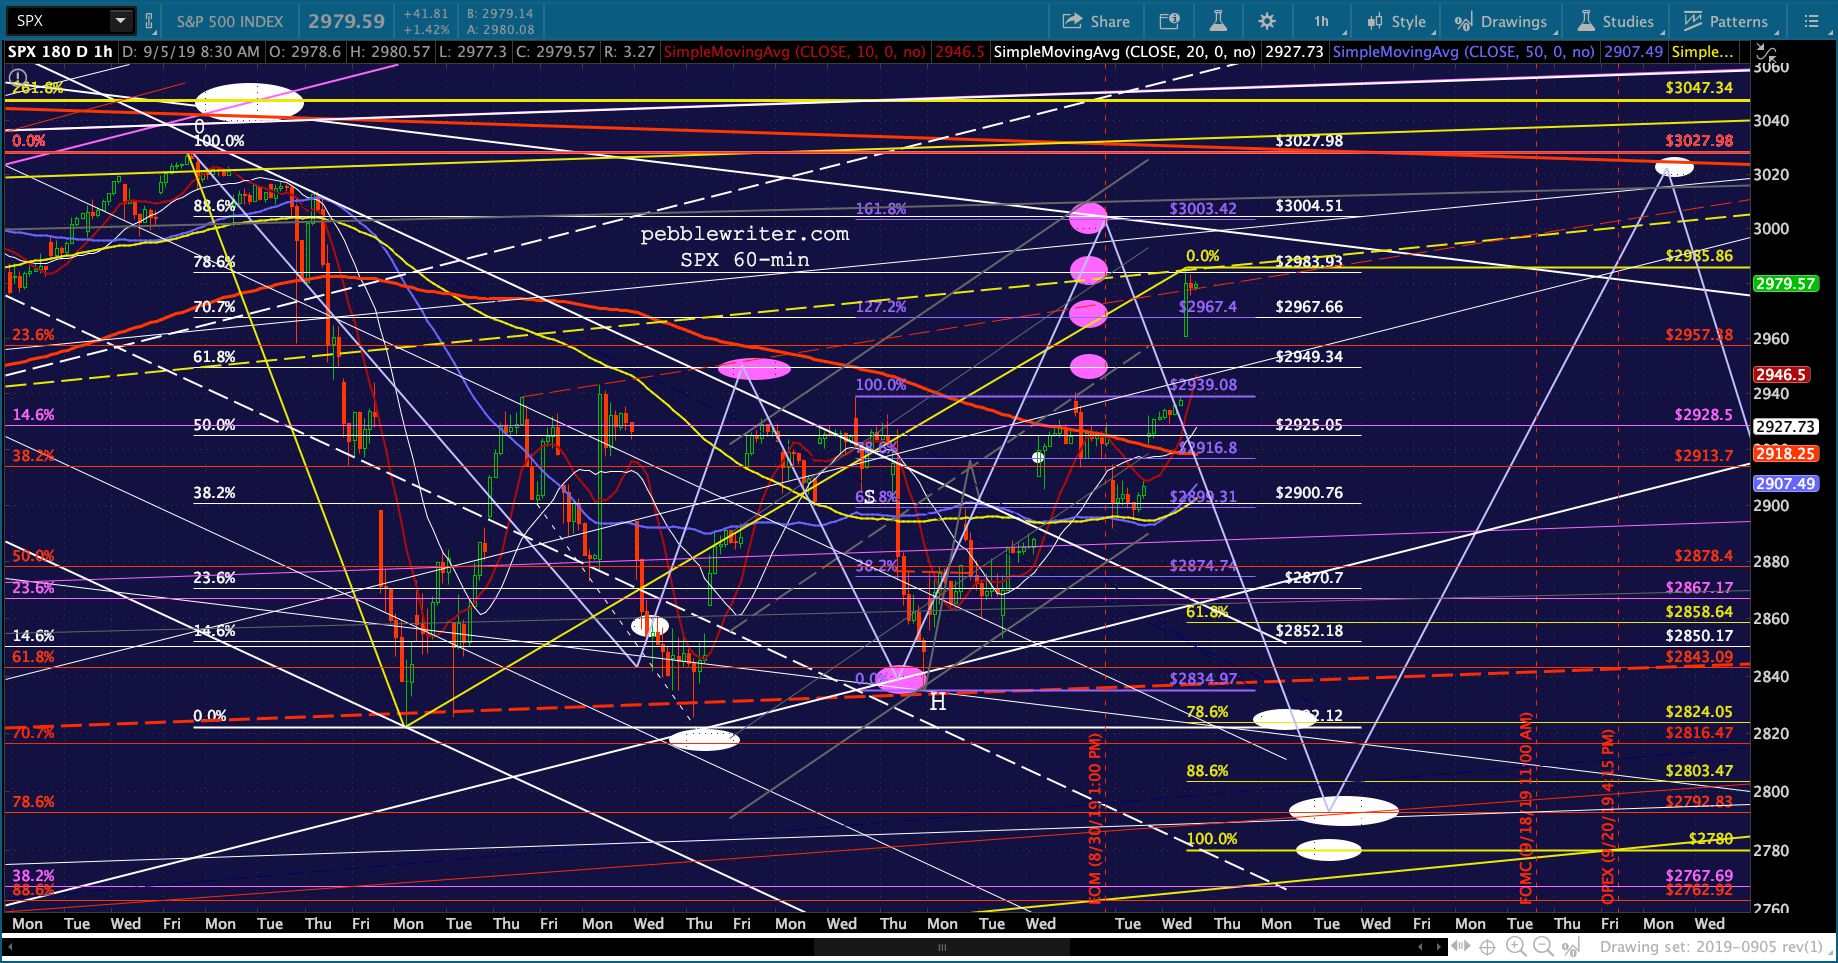
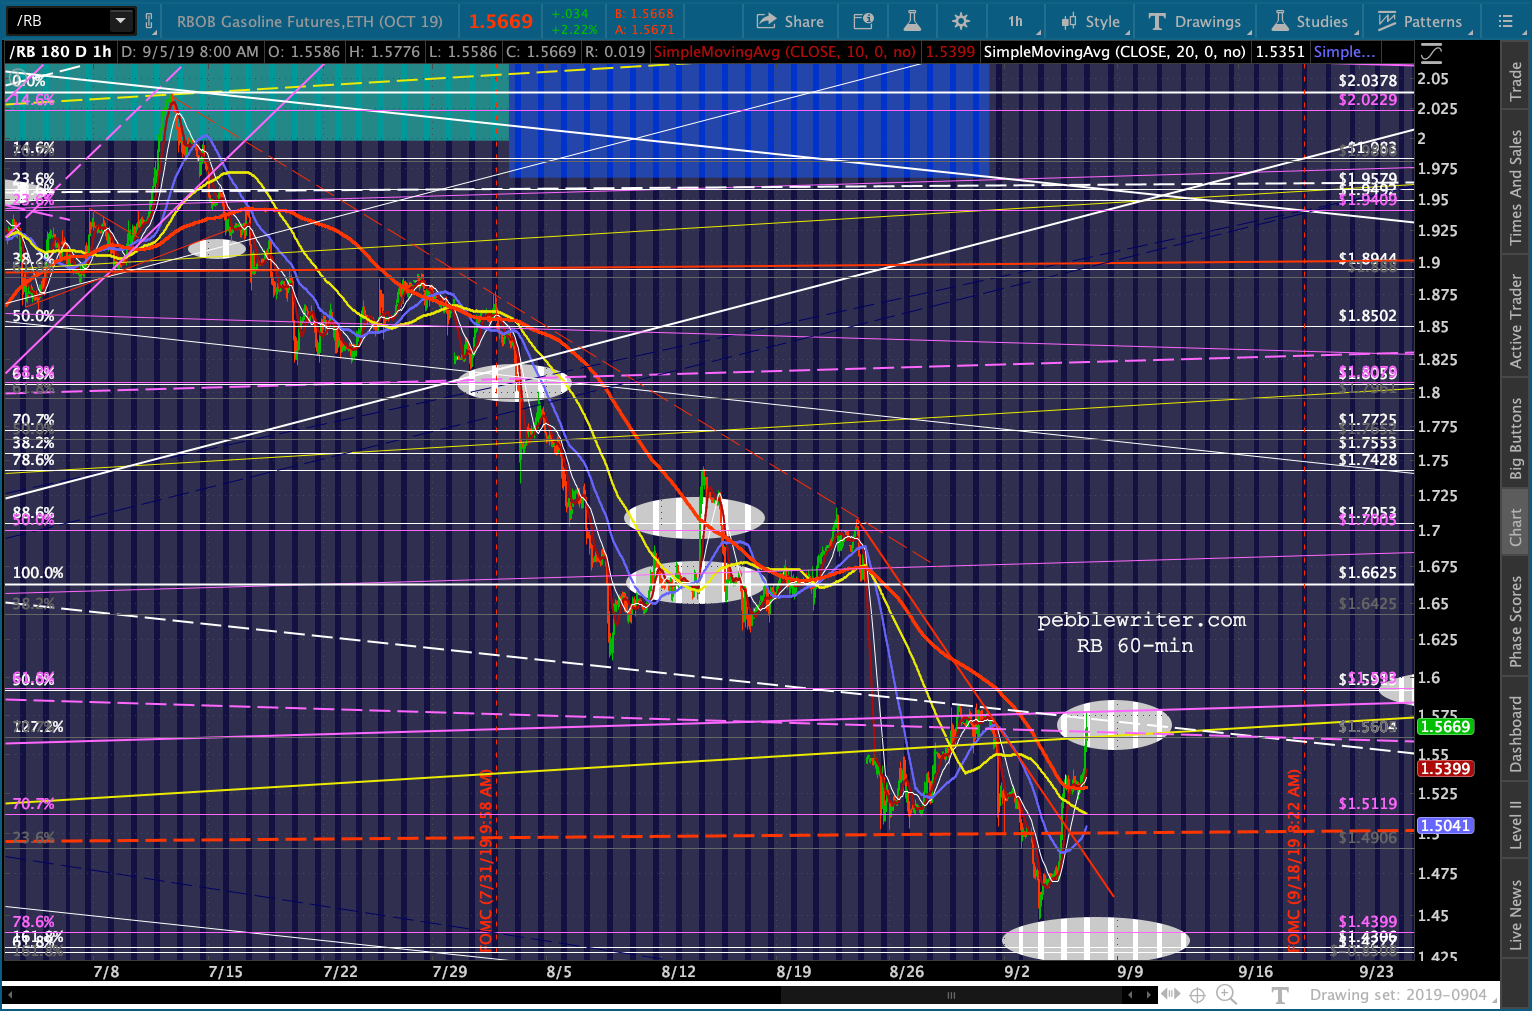
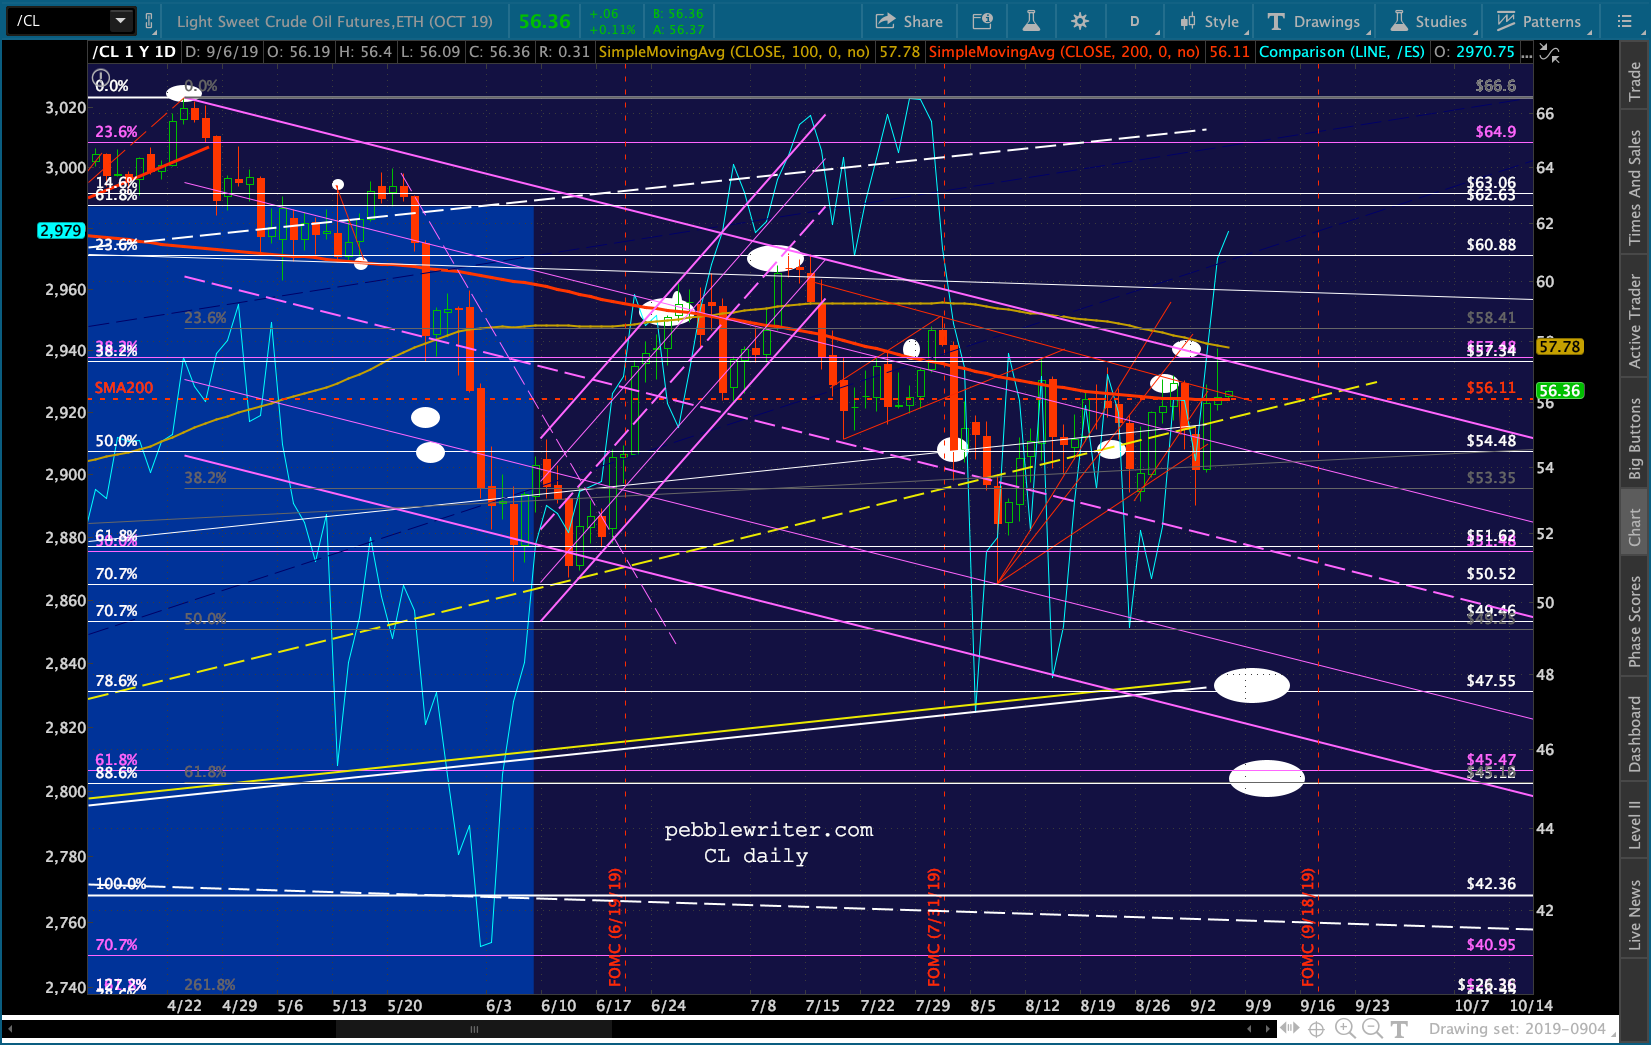
Meanwhile, CL and RB have both reached important resistance. If they don’t reverse here, it’s time to switch sides and go long.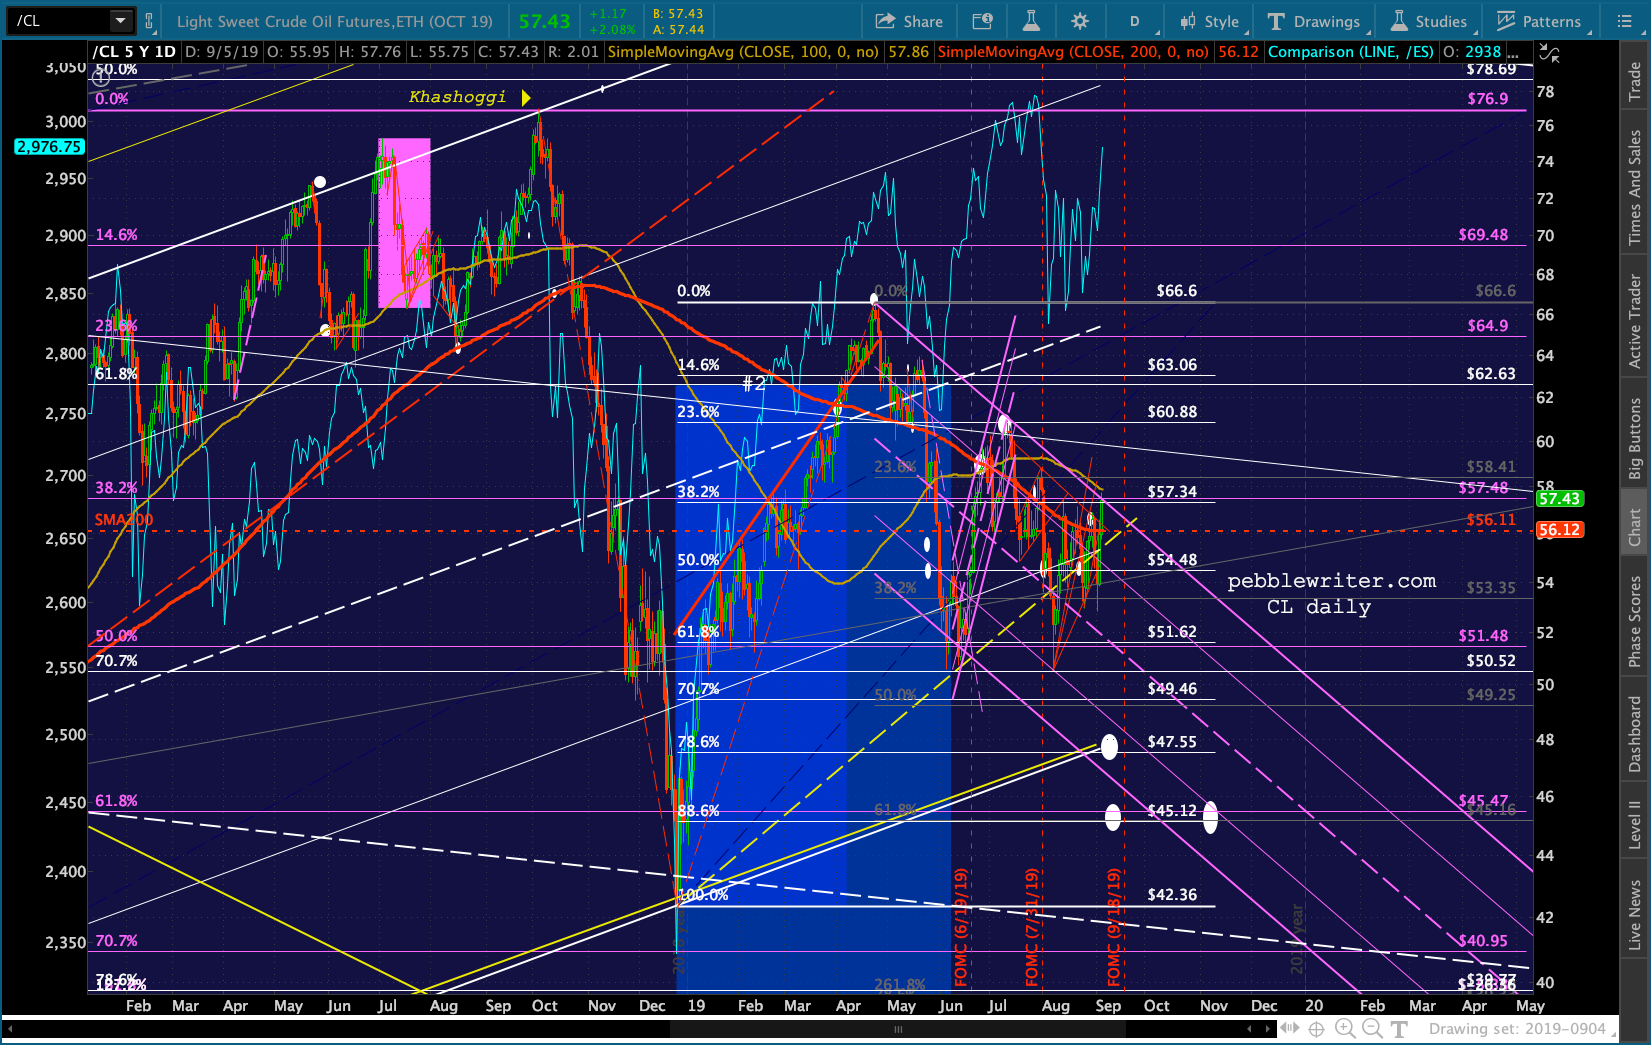
 As I mentioned yesterday, I need to take off for the rest of the day. I’ll try to slip in some charts later in the day, but it’s unlikely I’ll get the chance.
The biggest question in my mind is whether this rally can hold until tomorrow when Powell speaks. A close second: whether the next leg down will “catch up” with the analog’s schedule.
GLTA.
UPDATE: EOD
So far so good… I like that DJI, CL, RB and USDJPY all reversed at logical spots. I’m a little less enthused about VIX — though it did reverse at a backtest of the red channel top. The last time this happened SPX tumbled a nifty 113 points.
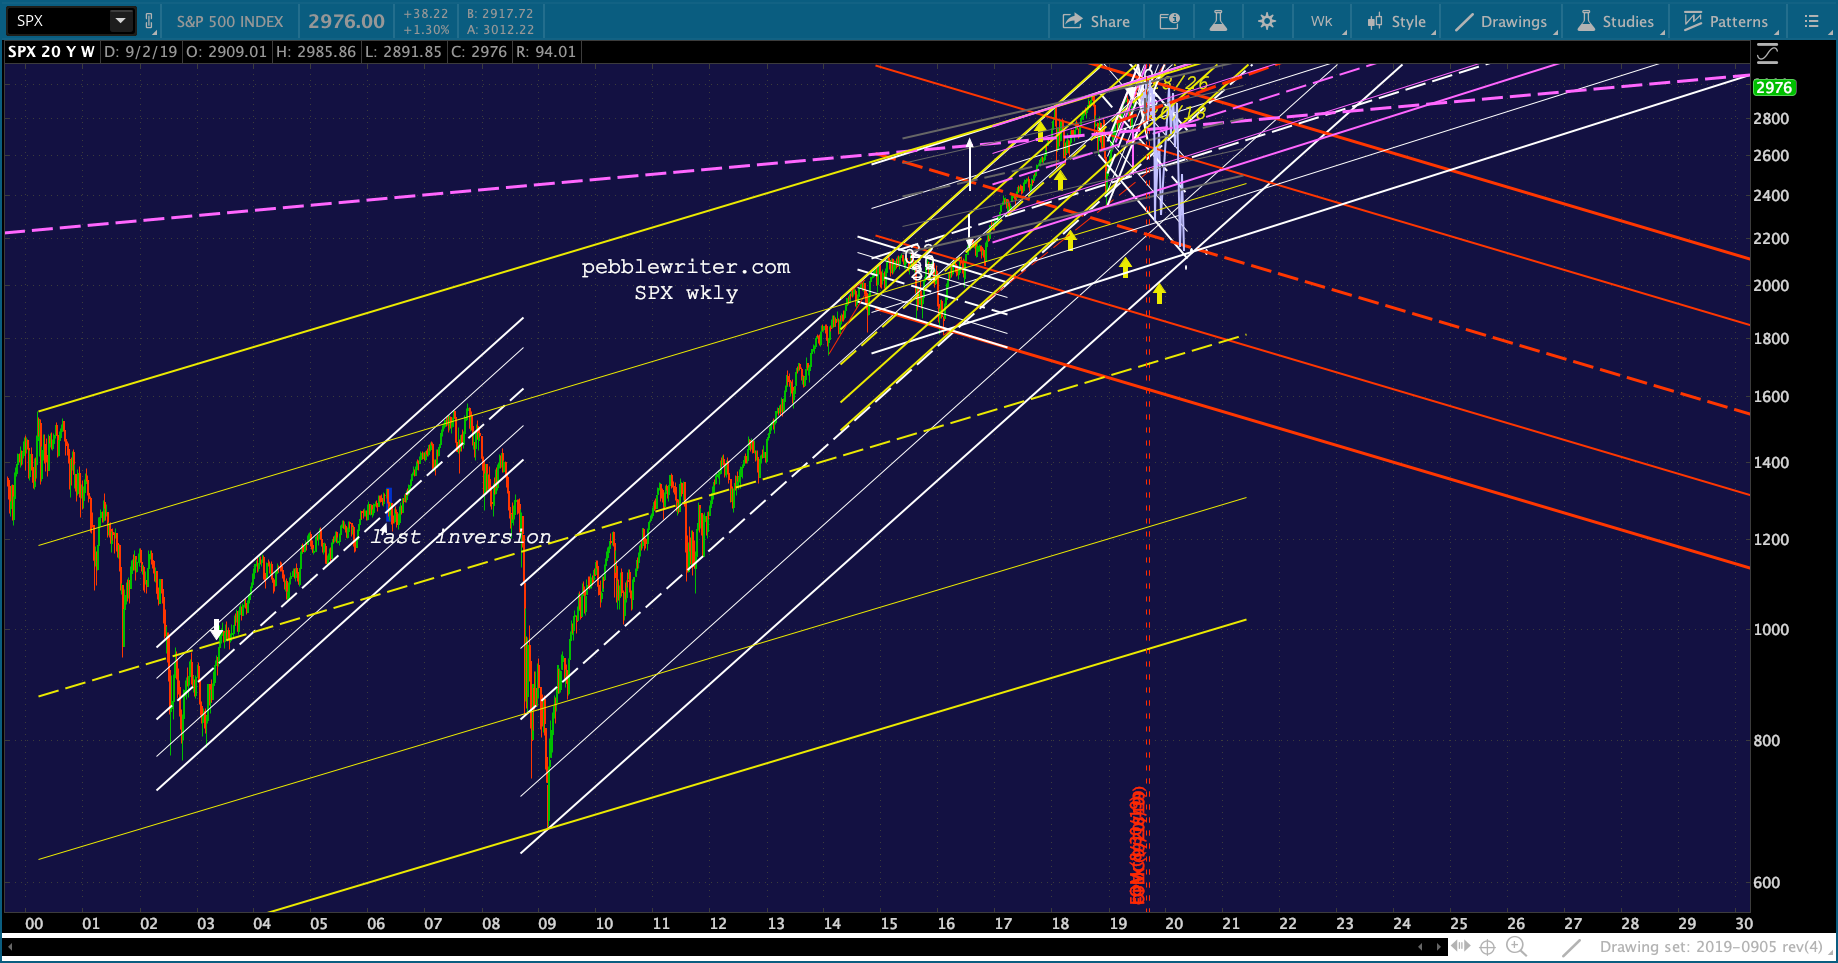
 FWIW, the white channel line marked with the big white arrow is the .236 line of the much larger channel dating back to 2008. Its top, bottom, .236, .500 and .786 lines are marked with the yellow arrows in the chart below.
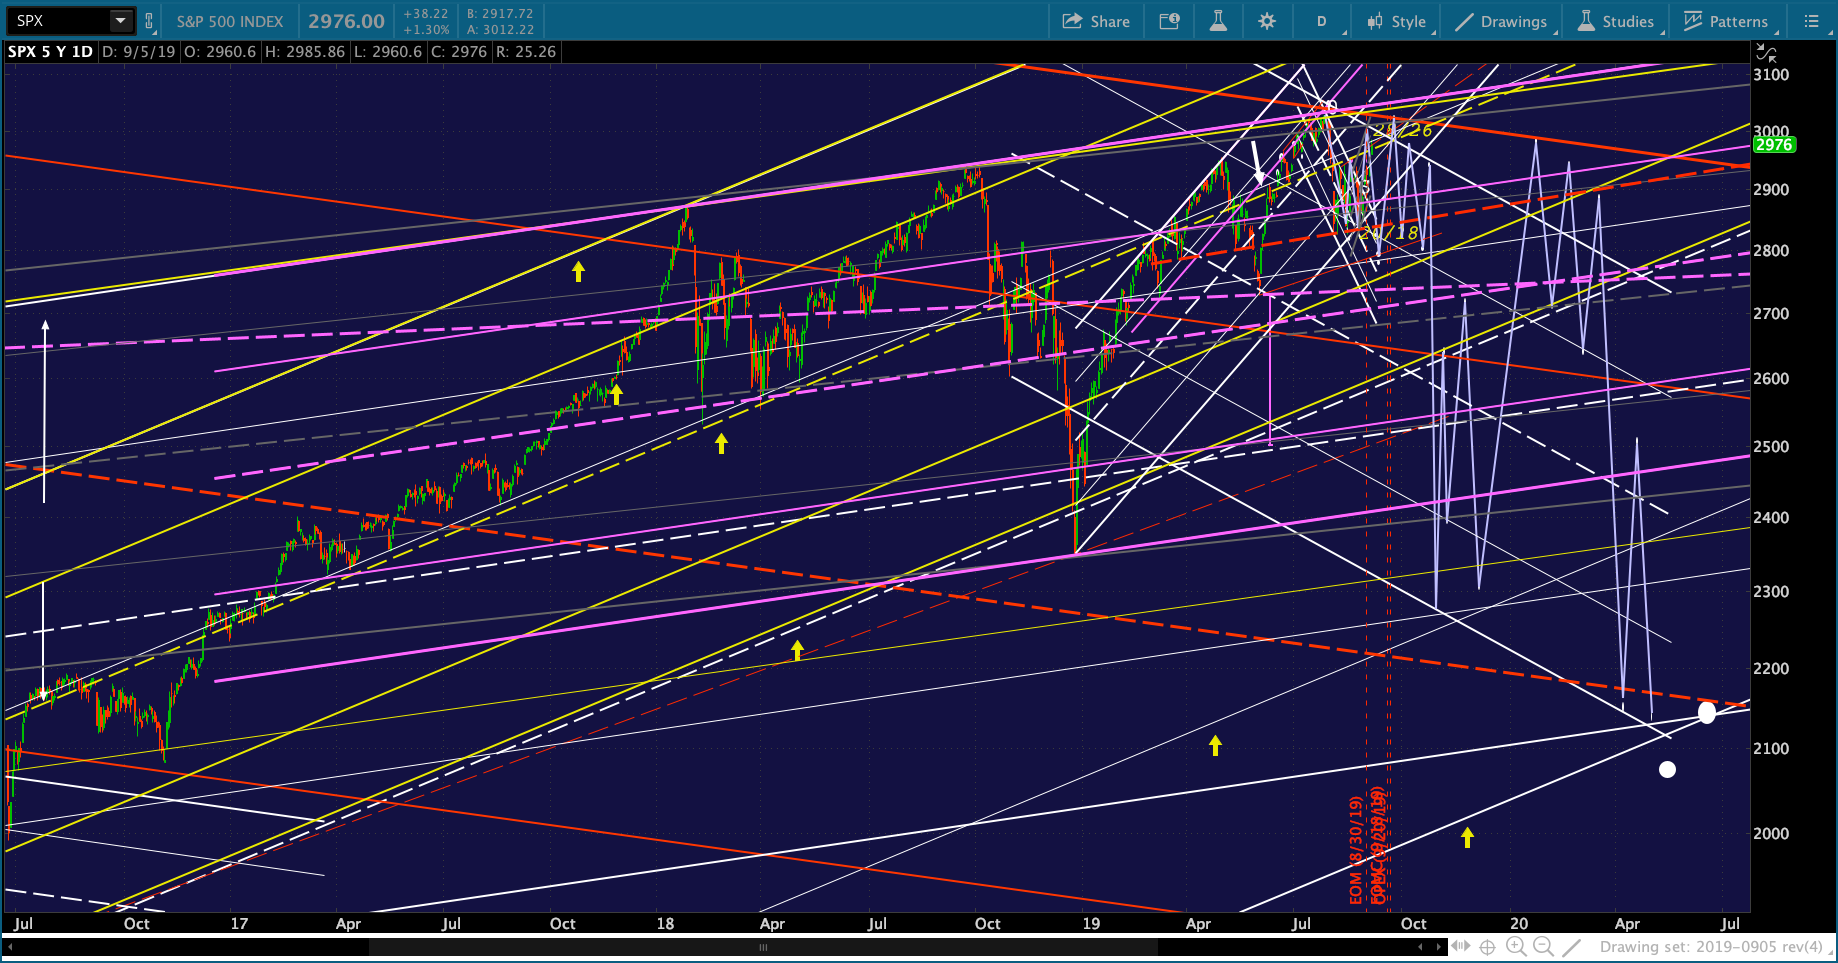 It’s a little easier to see on this weekly chart.
 More in the morning.
Comments
4 responses to “Better Late Than Never: The Sequel”
I was fortunate to have stayed long into yesterday (given that it looked like SPX was going to break-down Tuesday, or at any second for that matter), but then started building a short position at 2930. My target on upside was 2965, which has turned out to be insufficient with the buzz today – however, your upside fib targets give me some relief. If price heads back down into the consolidation zone under 2940, lets say by tomorrow, and stays down, then I think analog is back on track, although still slightly behind from a days perspective. The turn date back up would coincide with the fed meeting on 9/18…if you allow for the analog to be a few days off (late). I think its worth shorting this move…market could simply be expanding its trading range as volatility picks back up.
If on that turn date the fed ends up disappointing, or market doesn’t hold the lows, then I think this thing could tank.
Also looking at VIX, its stuck at 15.50 horizontal resistance on the downside. This is the same level it hit on 8/22 when SPX was over 40 handles lower. To me, this says move should be faded and gap will be filled.
That’s the way I look at it too. Plus, this was a backtest of the broken red channel as occurred on 8/2, 8/8, 8/21 — all of which were the start of previous declines.
I completely agree.