Author: pebblewriter

  • Eye Candy for Bears

    A smattering of my favorite bearish charts.  Enjoy!

    We start with the well-formed megaphone pattern on DJIA…2014-03-14-DJIA megaphone …and, its doppelganger on the S&P 500 from the 70’s.2014-03-14-SPX megaphone 65-74

    SPX (the thin purple line) raced ahead of DJIA at the top in 2000…

    2014-03-14-DJI v SPX Mar 2000

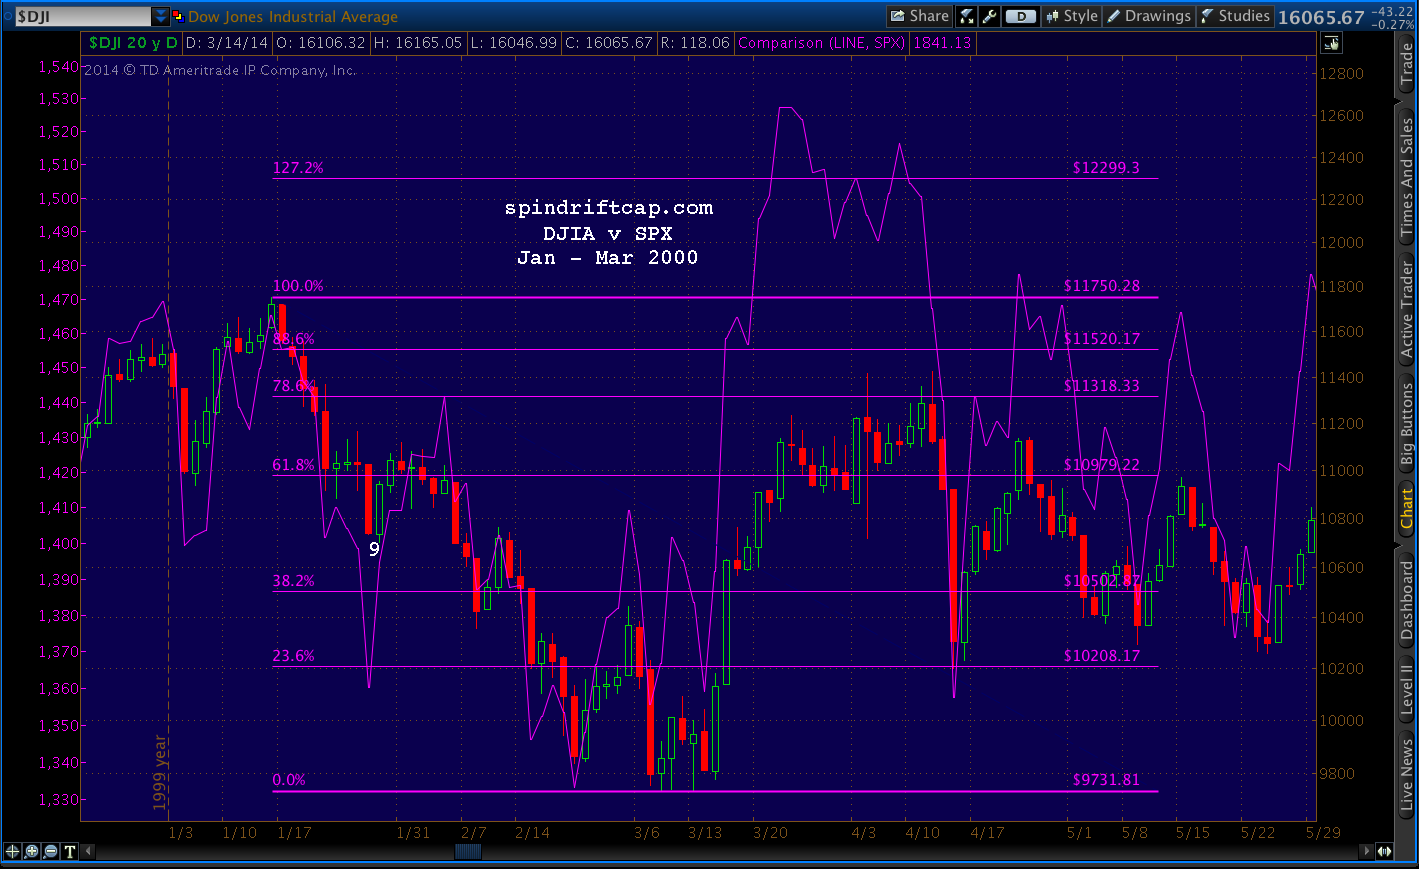
    …and, again over the past few months.

    2014-03-14-DJI v SPX Mar 2014

    The USDJPY recently reached the channel top that spelled stock declines of 22%, 35% and 57%.  Again, the S&P500 is shown as the thin, purple line.

    2014-03-10-USDJPY v SPX 2008-2013

    The two prior tags on the EURUSD’s channel from 2008-2014 signaled declines of 47% and 21%.  We just tagged it a third time.

    2014-03-18-EURUSD v SPX 2007-14And, three previous tags on the 10-YR bond’s major trend line since 2007 have touched off plunges of 52%, 15% and 20%.  The minor TL between Feb 2011 and Sep 2012 signaled two additional corrections of 9.9% and 8.9%.2014-03-14-TNX v SPX Mar 2014

    The latest breadth thrust pattern on the monthly SPX chart shows a startling resemblance to those from the 2000 and 2007 tops.

    2014-03-07-SPX BT monthlyAnd, last, my favorite bearish chart.  What would happen if 1973 were to replay?  Hint, the white dot is only half the damage.2014-02-14-DJI big pic 1152Safe trading!

  • Charts I’m Watching: Mar 20, 2014

    The website is undergoing some maintenance today.  If this site acts up, I’ll use pebblewriter.blogspot.com until the issues are resolved…

    *  *  *

    USDJPY has either completed its run or has formed a flag pattern that signals higher.

    ES had a nice move yesterday, but needs to move south of the rising white channel in order to confirm our downside case.  In the absence of a move lower, we should get a retrace of the 1823 lows, ideally to the purple .786 at 1832.92.

    UPDATE:  12:20 PM

    We’ve retraced .786 of yesterday’s plunge, a reasonable place for a reversal and retest of the downside.  The .886 at 1864.59, however, would provide another tag of the purple channel top.

    Note the divergence with USDJPY.

  • Update on Nikkei: Mar 19, 2014

    In watching the USDJPY, it makes sense to keep an eye on the Nikkei.  It’s in trouble, having broken down and backtested a long-term channel…

    …as well as the 200-day moving average.

    It’s most of the way through a H&S Pattern that indicates 11381  — the large scale .618 — if the 13,891 and then 13,196 don’t hold.  There is also good channel support at 13196 (the purple .786) from both the grey and purple midlines.

    The increased sales tax kicks in on April 1 (from 5 to 8%), which can hardly be expected to boost consumer spending which, along with consumer confidence, is sagging badly…

    …a logical reaction to soaring food and energy prices [for more on the macro picture, see: Sayonara Abenomics.]

  • Charts I’m Watching: Mar 19, 2014

    Sideways on the USDJPY overnight…

    …a victory of sorts for the e-minis, which have inched higher.

    Interestingly, SPX itself already reached the .786 yesterday.

    I presume this means another leg up 1873 or 1880 for ES.  But, of course, that depends to a large extent on what Yellen has to say later today.

  • Charts I’m Watching: Mar 18, 2014

    E-minis are off their ramp session highs after having retraced .786 of last Thursday/Friday’s losses.

    The USDJPY rally largely fizzled — with 101.20 safely defended for now.

    UPDATE: 9:55 AM

    Better look at the daily ES chart…

  • Charts I’m Watching: Mar 17, 2014

    We’re getting an USDJPY-driven overnight ramp…

    …with a 10-pt bar at 1am just because.

    It’s probably worth keeping an eye on EURUSD today…

    …as well as the 10-yr, which is still flirting with a dip below the red channel midline.

    It’s one of the indicators I’ve been studying that challenges the notion that the unrest in Ukraine, Venezuela, Southeast Asia and MENA, the faltering growth story in China, Japan’s continuing implosion, spiking food and energy prices around the world, and the Fed tapering are a positive backdrop for equities prices.

    Note how the reversals off the lower dashed yellow TL have coincided with SPX declines of 20.1, 9.9 and 8.9%.  Most recently, TNX failed to retake the upper TL which also has an impressive story to tell (declines of 52, 15.4 and 20.1%.)

  • Charts I’m Watching: Mar 14, 2014

    Dragging Warren Buffett out yet again to calm the markets… makes me wonder who they’ll get after he heads to that great big bridge game in the sky.   Maybe this guy?


    The weakness in the futures continues…though it looks like we’re getting a bounce at near the red .886.  Note the change over to the new contract pricing for the ES.  It puts the yellow 1.272 at current levels.The SPX opened down, but is likewise getting support near its red .886.  A substantial bounce here at the former lows could set up a head & shoulders pattern.USDJPY is also being propped up at the former lows.Coming up, price targets…(continued for members) (more…)
  • Dr. Copper: Mar 13, 2014

    It gets worse than this, with downside targets at: (a) 2.70, (b) 2.37 and (c) 1.64.

    It goes to show what can happen to a highly levered asset that’s the underlying for billions in debt…


  • Charts I’m Watching: Mar 13, 2013

    Futures are up a few points after yesterday’s bounce and overnight ramp.

    USDJPY took a tumble overnight, but is mostly recovered.

  • Charts I’m Watching: Mar 12, 2014

    The bulls should try to support the e-minis at 1853 — a smaller scale .618 and channel midline.

    But, SPX also has support at the .500 — the midline of its rising red channel.

    USDJPY should seek support at the white .500 at 102.48.  If it fails, we’re back into 102 watch mode — with the .618 at 102.18 as the most likely target.

    If all these .618’s don’t hold, things should get interesting real fast…