

USDJPY backtested its SMA200 this morning, leaving equities vulnerable to a pullback.
The short-term picture:

USDJPY backtested its SMA200 this morning, leaving equities vulnerable to a pullback.
The short-term picture:
I wish everyone a safe and enjoyable holiday weekend!
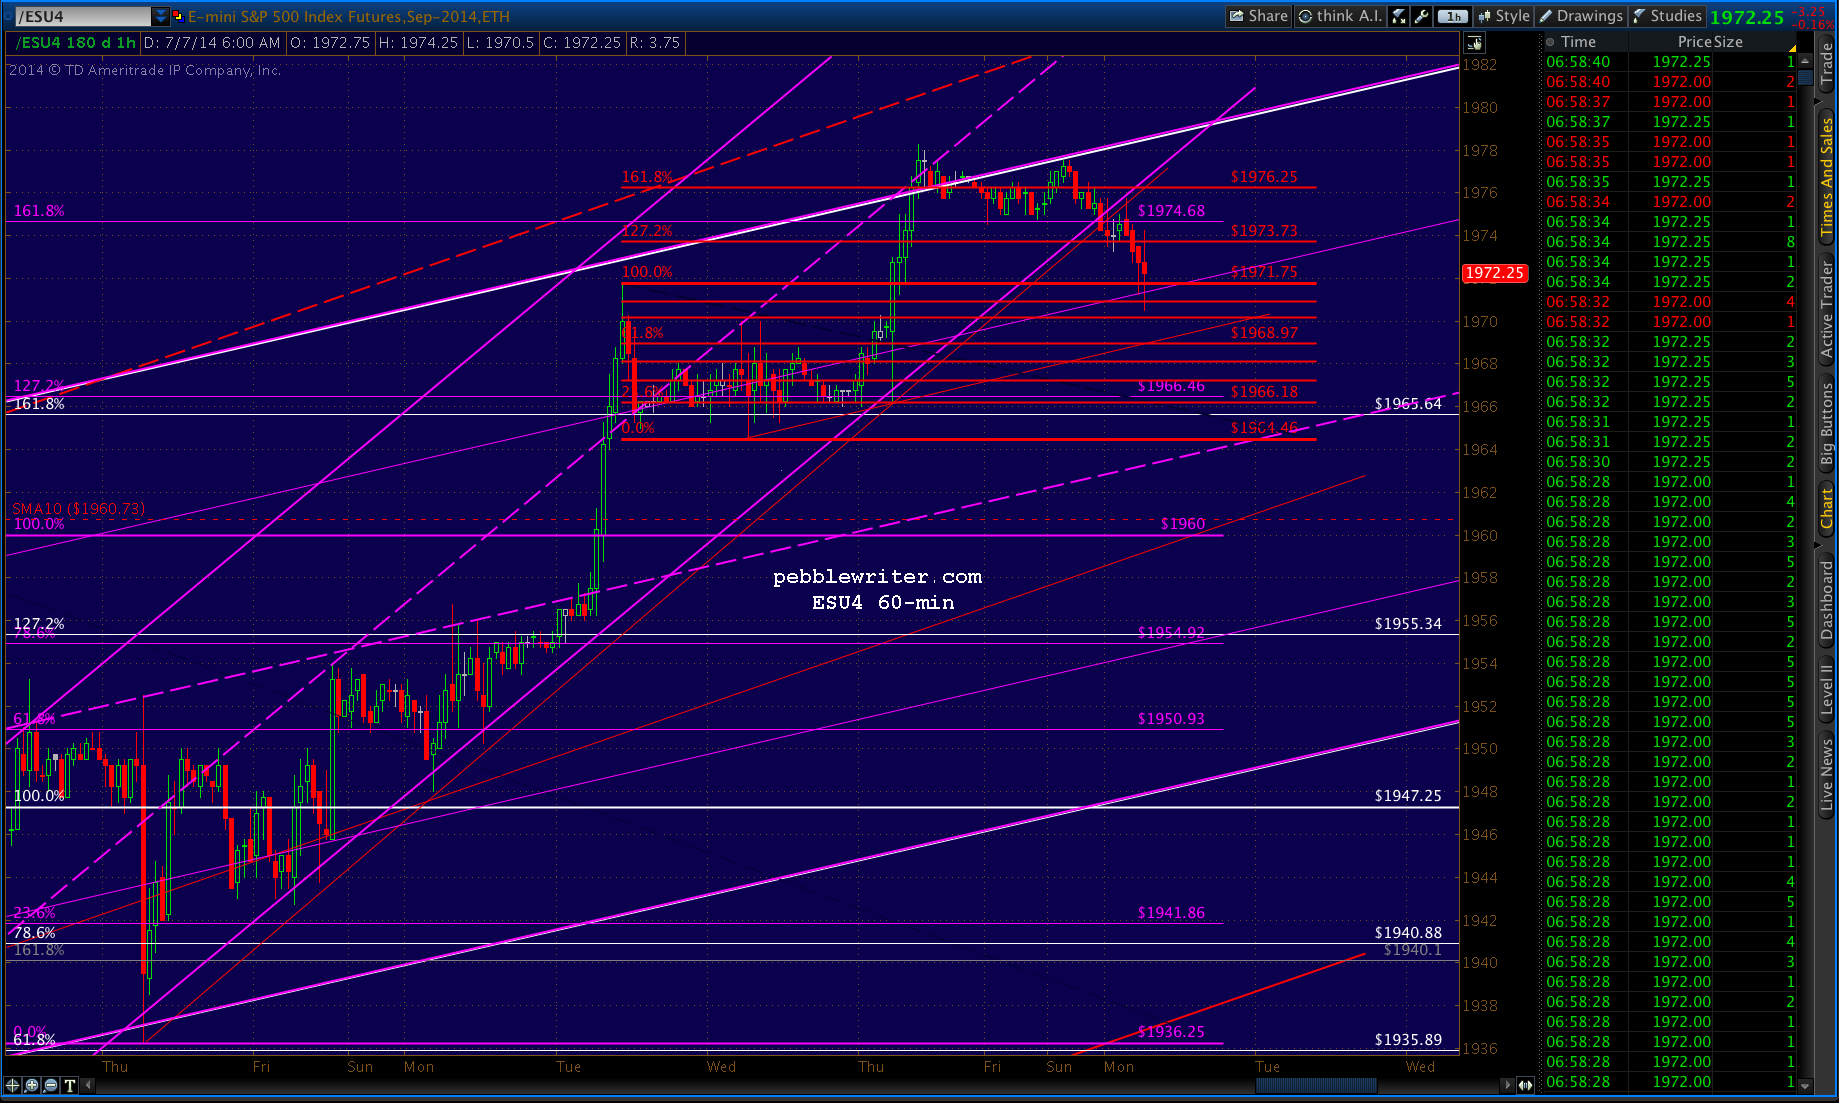
The employment report boosted futures back to the point of resistance we discussed yesterday — the white channel top. Stocks still face the decision of whether to reverse or break out.
We often reach these points on the eve of holiday weekends, when volume is particularly low and TPTB can push it wherever they like. I can’t remember the last time the “market” didn’t break out. But, we should always be alert to the possibility that a big player will take advantage of the low volume/volatility to launch a bearish sneak attack a la this past New Year’s.
It’s not likely though. SPX gains on the days following all CME equity holidays in 2013 totaled 80 points, or about 5.6%.

In addition to the white channel top, there is potential Fib resistance at both the purple 1.618 as well as the red 1.272 or 1.618. Note the floor under prices this past week.

Quick note on the payroll report itself…Not to throw a wet blanket on the report, but the total jobs increase of 288K includes almost 800K part-time jobs — the most since 2003. Full-time jobs declined by 523K. Real wages declined for the third month in a row. Combined with the growing inflation we’re seeing, the stagflation argument is picking up steam.

Break out or break down? TPTB love holiday weekends, as they can push prices through resistance more easily while everyone’s on holiday.

The bots are pushing USDJPY higher; but, a muted impact so far on ES. Traders might be nervous after yesterday’s weak close (on an otherwise strong day for no reason whatsoever) that saw SPX return to the 1.272/1.618 Fib level we discussed.

Many of us have noted the shenanigans going on in VIX in the last minutes or even seconds of trading. By slamming VIX lower, an algo forces prices higher — one of many manipulations occurring in the “markets” these days.

For those who haven’t seen it, yesterday’s Nanex article explains what’s going on:
There is a new High Frequency Trading (HFT) Algo afoot, probably designed to measure, or cause system latency. This algo sends extreme bursts of 1-share orders in a symbol to two different exchanges: Nasdaq and BATS. The result is a system-impacting surge of quote updates, similar to quote stuffing, but accompanied by an extremely high number of 1-share trade executions. These trade executions often consume the entire SIP output line, as indicated by continuous sequence numbers with no gaps. continued…
SPX just completed combo Crab and Butterfly Patterns at the purple 1.272 and white 1.618 at a channel midline. It’s a Tuesday, and a big POMO day. But, under normal circumstances there would be a reaction here to at least 1961-1963.

These days, “normal” means sideways until the close, followed by a 7-pt dip around 3am which is quickly reversed on nonsense ADP numbers at 8:15 tomorrow morning.
I spoke to an old friend the other day. Paul and I go back to the 80s when we were baby brokers at Mother Merrill. Neither of us could remember a phase like this, when even the slightest dip was immediately and aggressively bought and algorithms turned charting the daily price action into an exercise in drawing a straight line.
We were pretty sure there hadn’t been a time back then when the worst GDP print in 5 years produced only a 2-pt dip, followed by a 13-pt rally like last week. And, we were almost certain that banks used to lend money, not just speculate with government funds on securities whose actual value need never be reported.
Paul was on-board with the whole NKD/USDJPY algo idea. But, we both came to the same conclusion: even if Yellen, Dimon, Blankfein, et al held a joint press conference and announced they were, in fact, manipulating the market higher, would anyone care? I can’t see Occupy Wall Street braving pepper spray over daily all-time highs.
The reality is that anyone who might even consider shorting might as well have a bright red target on their back. They’ve been driven out of the “market,” which I’m fairly certain was the plan. Who knows? Without shorts, maybe the government and MSM will even go back to telling the truth about the economy once in a while.
UPDATE: 1:00 PM
And, there, in the 20 minutes it took to jot that down (and, that dramatic 1.79 point plunge) a new all–time high! Thanks, USDJPY.

As we discussed Friday, USDJPY closed below its 200-day moving average for the first time since Nov 13, 2012. Back then, SPX was about 30% lower (1376) and the Nikkei was 40% lower (9,230.) The big question before us: now that Abenomics is coming apart at the seams, can we also expect the boost Japan’s QQE has given stocks to unravel?
Remember, even though Abenomics as an engine of economic revitalization is failing, the BOJ is still actively propping up equity prices and suppressing the yen. It remains to be seen how players in the yen carry trade will react to the SMA200 breech. Some will bolt; but, the biggest carnage would come with a drop below the 2014 floor of 100.746.
It’s worth noting that USDJPY has also completed a bullish (for the pair) Gartley Pattern, with the tag of the .786 occurring yesterday. Given that it’s the last day of the 2nd quarter, the bots should be out in force — putting a little wax on this clunker of a “market.”

While Friday’s close was unsettling and we saw the first tiny wave of panicky action in quite some time, TPTB still have their sites set on SPX 2000. There is no law that states a move below the SMA200 must produce follow through. Chart patterns and technical analysis that are normally quite reliable have been busted more times than I can count this past six months.
There are many ways to prop things up if they so choose.

No POMO today, and more horrid news out of Japan. As we’ve been discussing for quite some time [see: Sayonara Abenomics] Abenomics is doomed to fail. Last night, we received more hard evidence: consumer spending plunged 8% and inflation soared to 3.4% — well above Abe’s 2% goal. More easing is supposedly off the table, and another 25% tax increase is on the way. No way to run an asylum…
Bloomberg does a good job of summing it all up HERE.

The Nikkei futures are off 200 points, and USDJPY is currently down .30, trading well below the SMA200 and nearing the .786 Fib level (101.24) we discussed the other day.
Oh, did I mention there’s no POMO today?
UPDATE: 3:10 PM
45 minutes left, and no run at the SMA200 (101.713) yet? Uncharacteristic big swings in equities in what is usually traction mode time for SPX. Either USDJPY gets its butt in gear real quick or it could be a ugly close.
Why? The last time USDJPY closed below the SMA200 was Nov 13, 2012. NKD was 9,230 (now 15,120) and SPX was 1376 (now 1948.)

USDJPY is front and center today, currently trading below the SMA200 and hemmed in by the daily cloud. I wouldn’t be at all surprised to see it test a lower Fib level — the .786 or .886. Stocks should respond in kind…if traders aren’t too mesmerized by the GoPro IPO.
CNBC’s marketing contract must specify that they say the word “GoPro” at least 10,000 times per hour. It might be a good product/investment, but the coverage is like one of those late night infomercials.

UPDATE: 12:10PM
USDJPY is back to the SMA200 under control of the algos, with ES climbing along the 5 and 10 min SMA min as yesterday. NKD is back to the .786 of its pre-opening highs in a carbon copy of yesterday.

Note that, yesterday, NKD turned at the tend line shown (point “a”) while today it was the SMA10 (“b”). In both cases, ES and USDJPY turned on a dime in anticipation of NKD’s reversal at its moving average.
In an unrigged market, USDJPY wouldn’t sail right back through the SMA200 (ditto for SPX and its SMA10.) We’ll see if the algos can maintain control.
Here’s a look at the 1-minute chart. The correlation is easy to see. Watching them live, side-by-side, it’s obvious that it’s causation rather than just correlation.

Worst GDP miss in years, “market” is up. Makes perfect sense…
Look no further than USDJPY and NKD, which — after a very weak after-hours — suddenly spiked at 9:30. USDJPY tested the SMA200 and NKD a trendline before the session opened, but neither spiked until the cash market opened. Good thing it’s not rigged (sarc.)

ES rallied 11 points, SPX 7 points. We should either see a breakout here or a replay of yesterday’s meltdown with the rally acting as a flag pattern, with continuation down to1934ish.

USDJPY, pushing up against a bearishly aligned SMA10 but in a fairly well defined rising channel, is looking weak this morning…

… though NKD is ignoring it for the moment.

If they can both hold their rising channels, equities should tag along. ES has dropped out of the rising white channel, but that hasn’t mattered much lately as NKD/USDJPY can negate just about any resistance — technical or otherwise.

UPDATE: 11:00AM
USDJPY to the rescue yet again. Note the spurts higher it makes, dragging ES up through what would have been harmonic resistance back when stocks used to correct every once in a while.

USDJPY should be able to let some air out, maybe backtest some of the broken SMAs, as NKD has elevated to the .886 and is likely to stay there — or higher — until the close.
UPDATE: 12:15 PM
What happens when ES threatens a move lower? It ticked down 0.25 points a moment ago…

…triggering this immediate response from USDJPY…

…and NKD.

UPDATE: 1:50 PM
Live by the sword…
Real live downside in stocks after the 2-yr auction belly-flopped. Stick save (so far) courtesy of NKD.

USDJPY continues to be boxed in between lots of overhead pressure, including the daily cloud, and the SMA200. The 15-min chart shows a triangle setting up, reflecting the likelihood of a directional breakout soon.

Bonds have been a pretty indicator of equity moves in the past, but have lost some predictive ability as prices are currently rising in concert with stocks.
