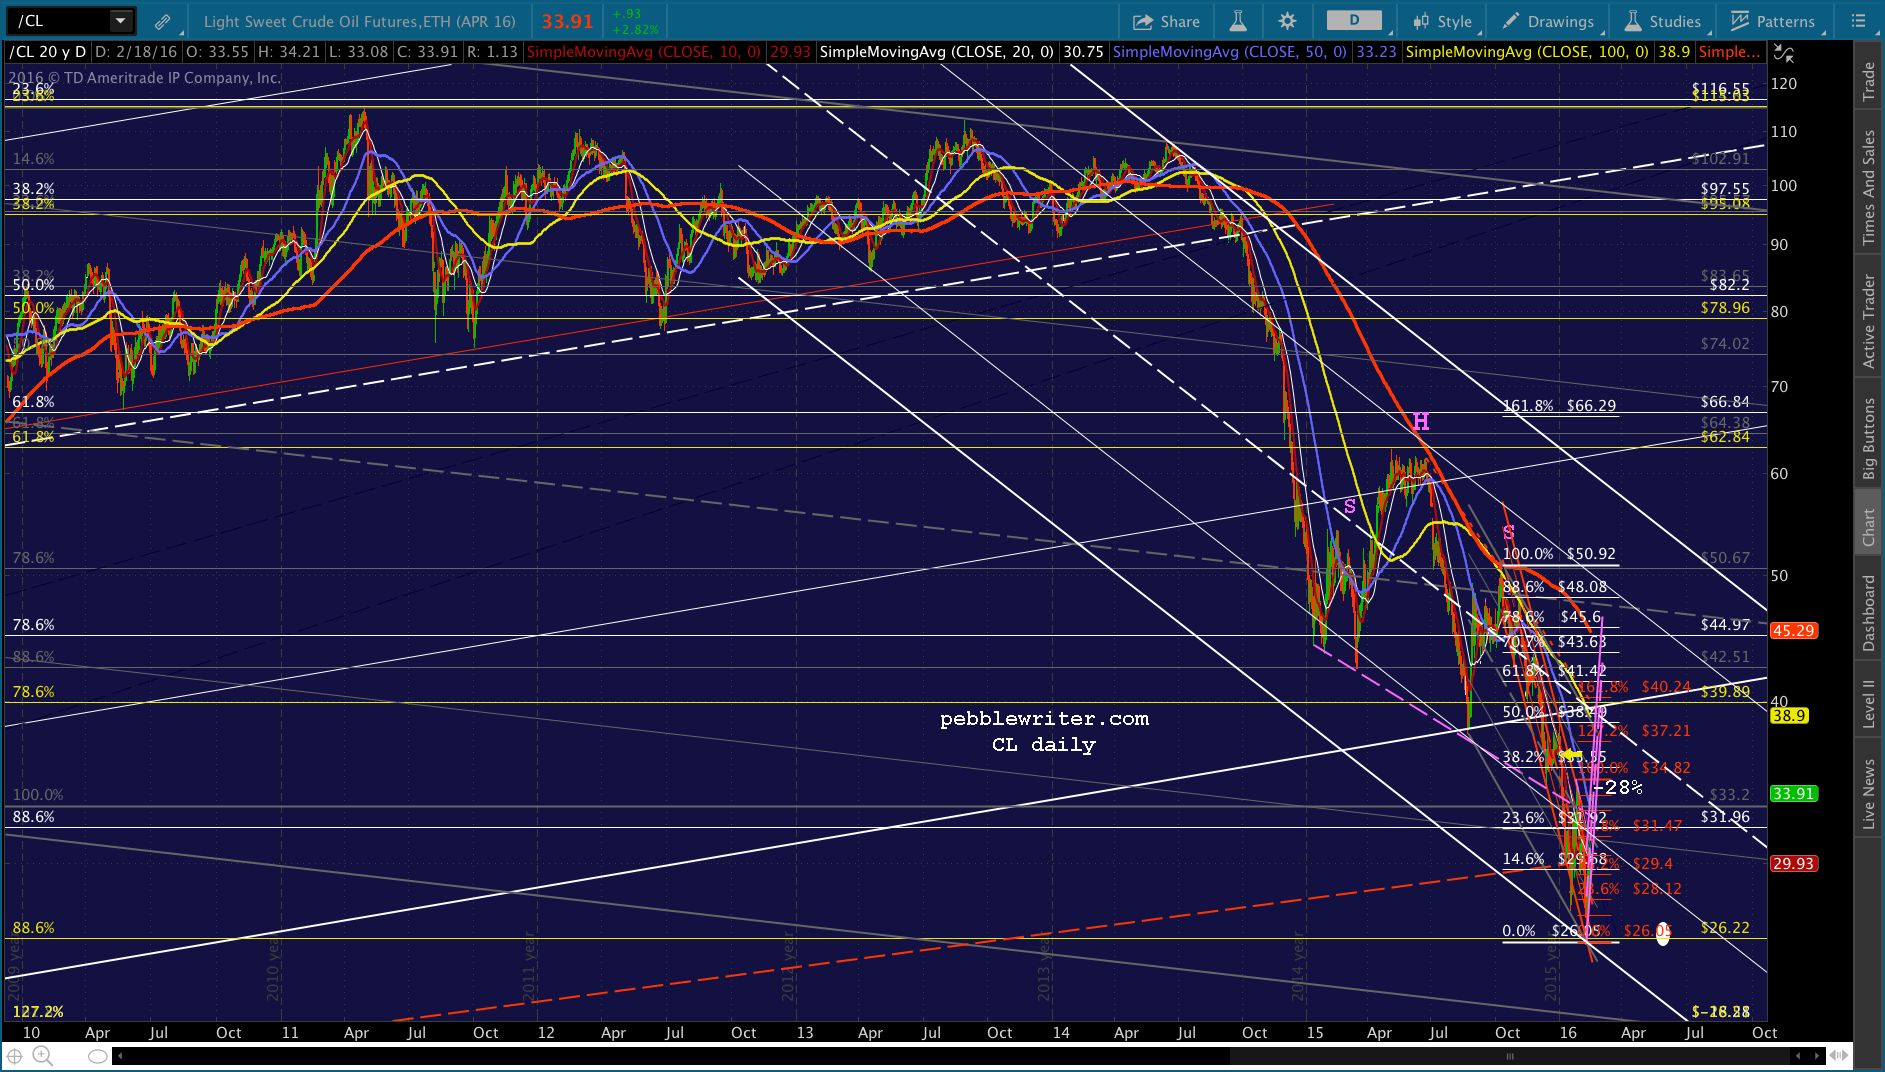
In last month’s post [see: Update on Oil, Jan 6] I noted that CL had dropped to 34.17, the target we posted in mid-December (the yellow arrow below.) I then donned my tin foil hat and added:
In an unrigged market, it would suggest a possible bounce to the purple midline and .618 Fib at around 42.78 — a very playable 25% move. But, the noose of USDJPY is still hanging around CL’s neck, and could easily drag it lower.
USDJPY can’t move higher (yen lower) unless TPTB accommodate Japan with lower oil prices to compensate for the hit of higher imports (chiefly oil — which is priced in USD.)
And, if USDJPY doesn’t start moving higher soon, we’re going to see a lot more days like today, with sub-2000 SPX [see: Yen Carry Trade.]
Over the next two weeks, with USDJPY dropping through major support, SPX shed 9.9%. CL plummeted 21%. But, it wasn’t done.
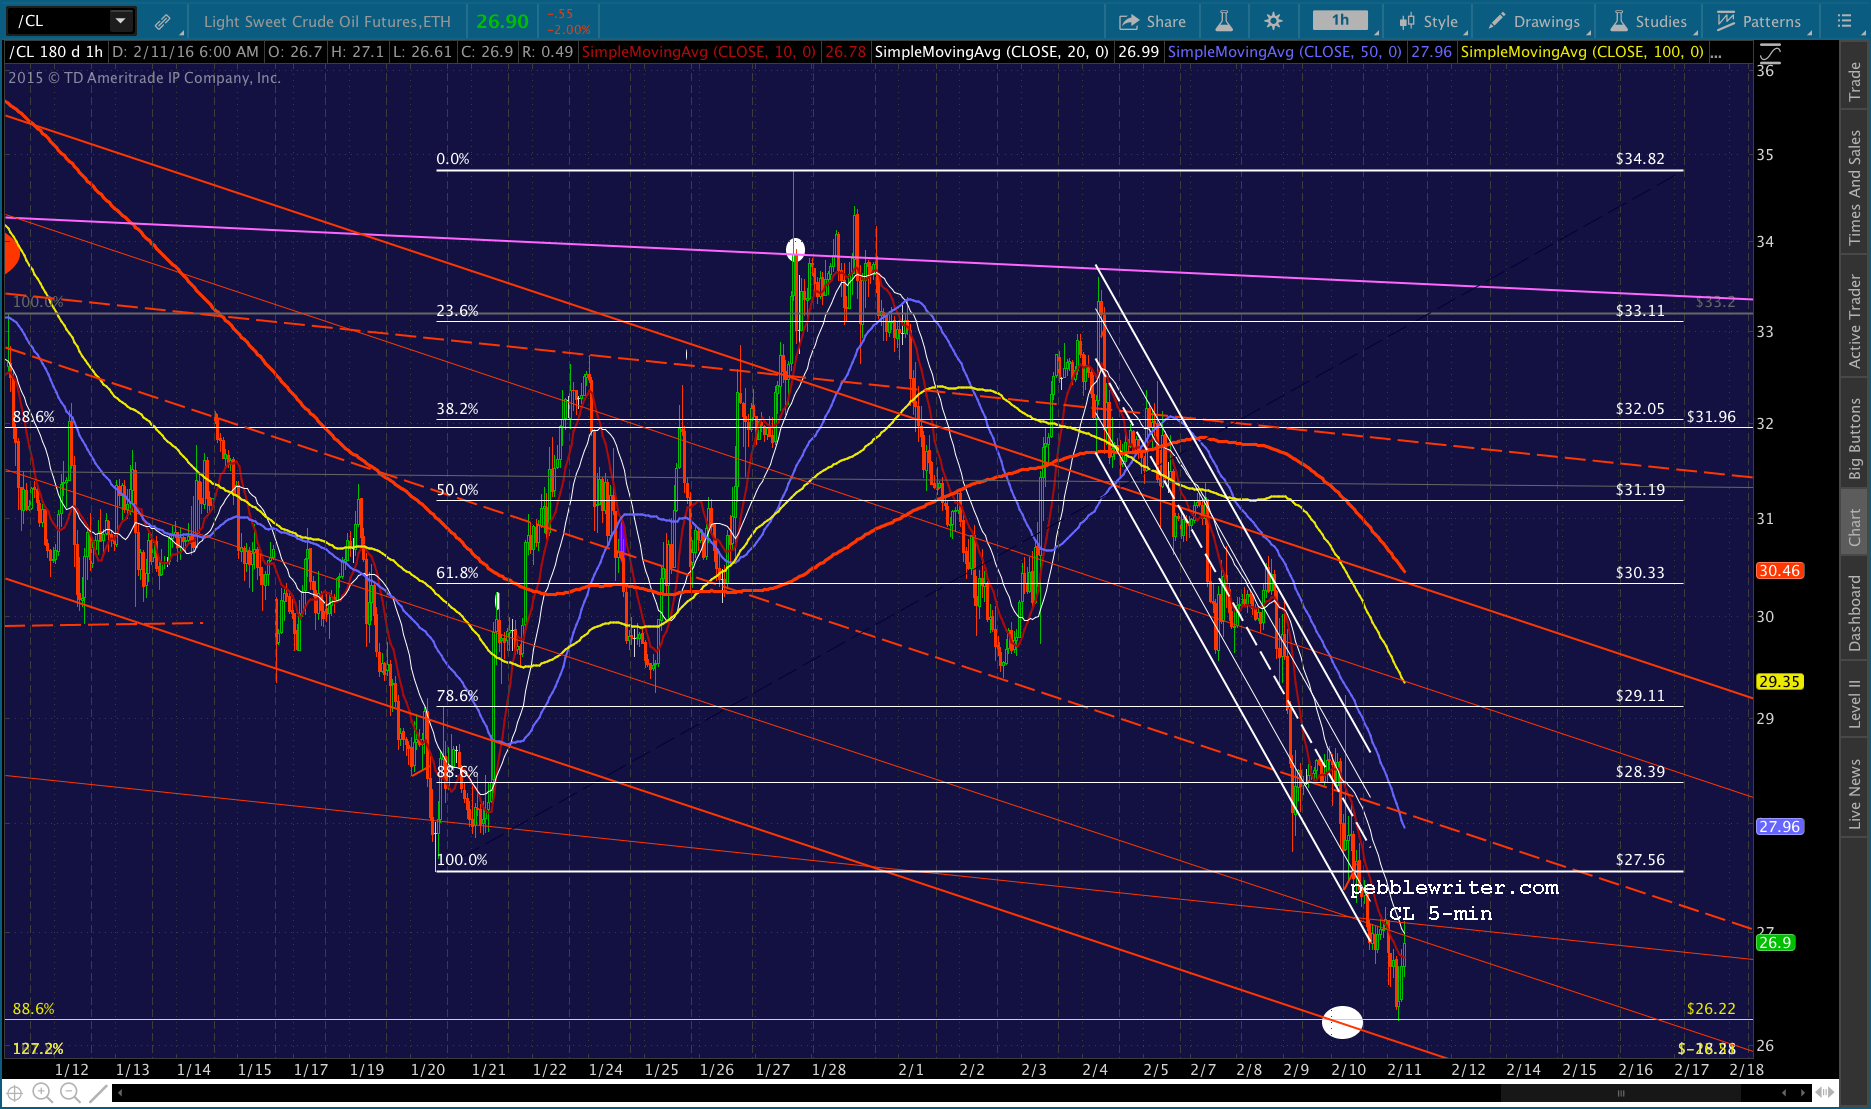
When I finally called a bottom on Feb 11 [see: USDJPY Finally Relents] CL had plunged 28% (totaling -75% since last June.) It had also nailed the lowest of the targets I had identified in January.
 Is the worst over? continued for members...
As we discuss on a daily basis, CL is nearly as important as USDJPY in fueling stock algorithms. At times, it seems more important. But, that’s chiefly due to the huge price swings that often prompt ES/SPX ramps.
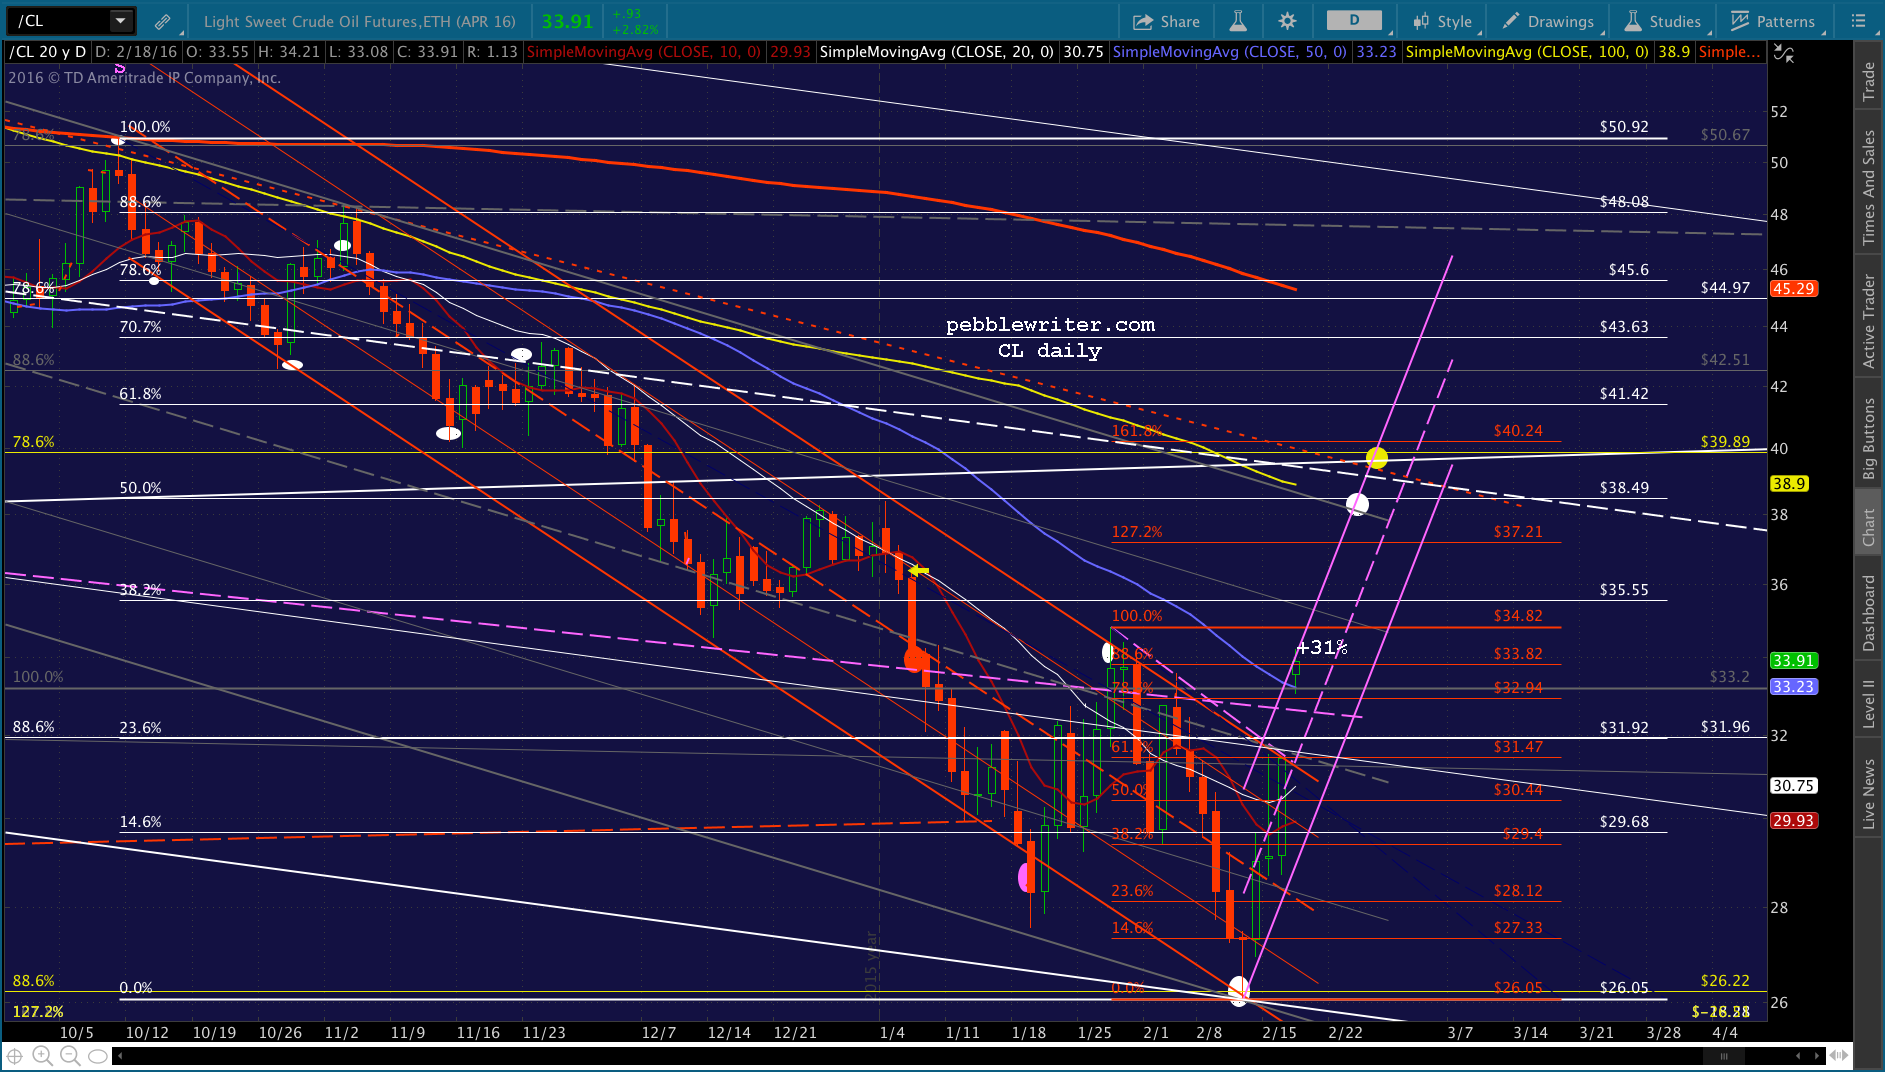
So, it’s no surprise that CL has bounced 31% in the past week in an effort to drag stocks out of their swoon. We saw a number of attempts to do the same between Jan 28 and Feb 4 — each one of them ultimately failing.
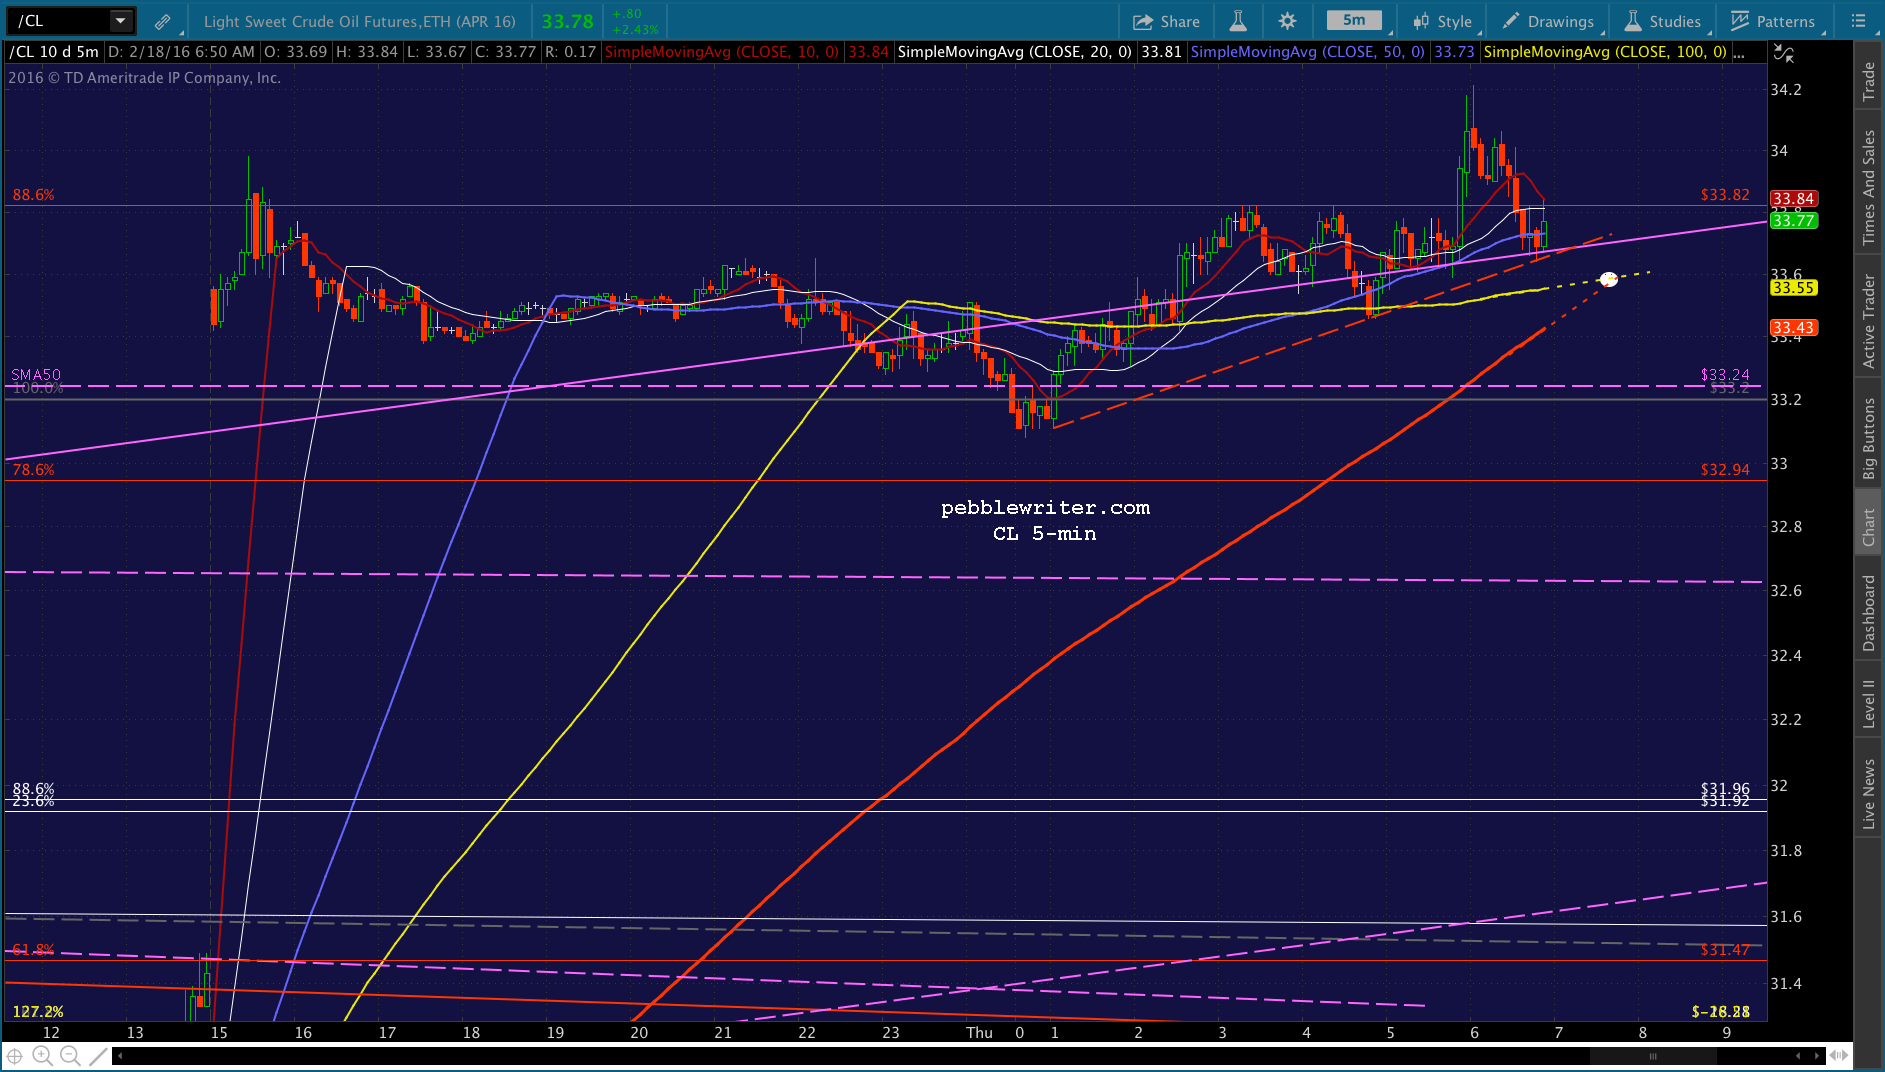
What makes this rebound different is that (1) it’s accompanied by a significant rebound by USDJPY, and (2) it has broken out of the falling red channel and gapped back above the purple neckline and the 10, 20 and 50-day moving averages.
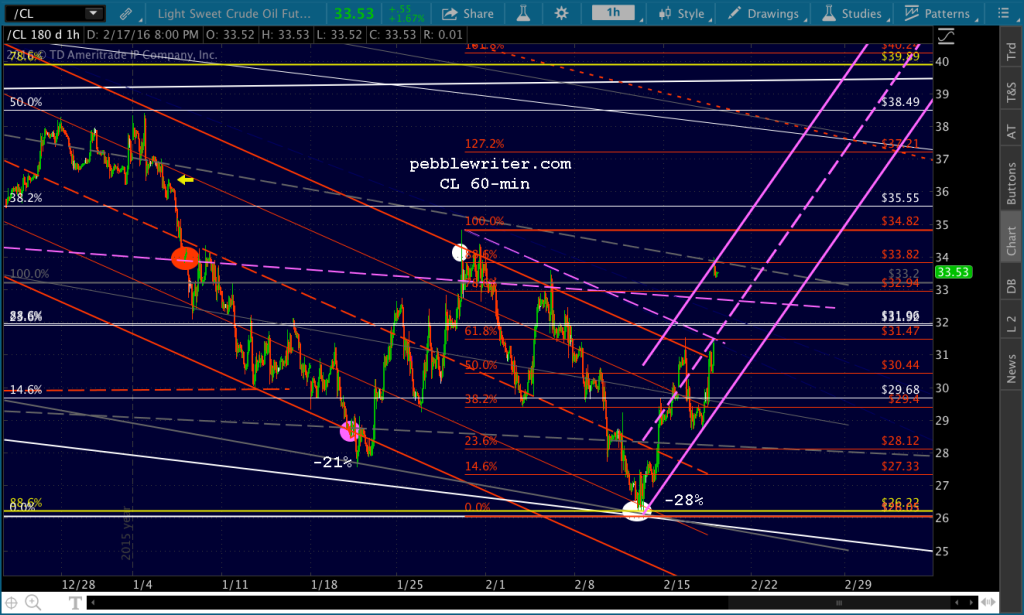
The big picture: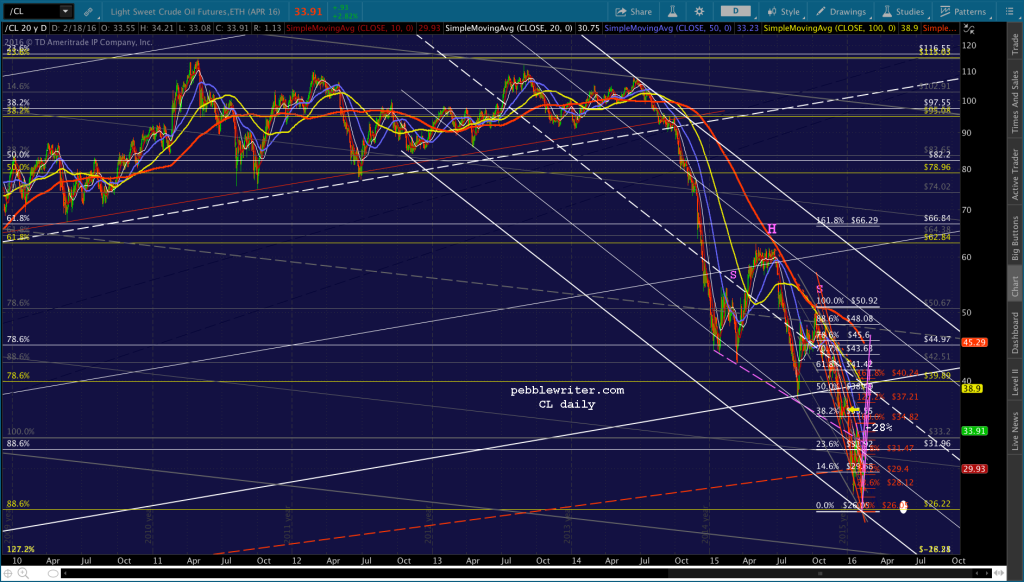 And, the close-up:
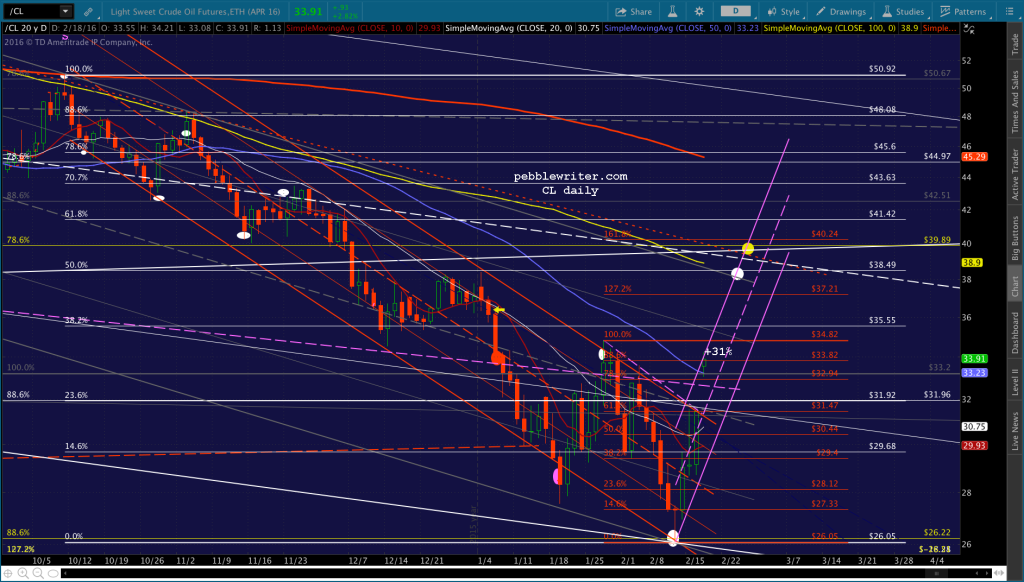 We would normally expect a backtest of the broken red channel, the broken purple neckline and/or the SMA10 and 20. But, these are not normal conditions.
TPTB pressed CL into service to save the global stock market — not follow the rules regarding chart patterns and satisfy yours truly. Therefore, there’s a possibility that it’ll continue ramping up to our next upside targets at 38.49 or 39.89 by the end of the month.
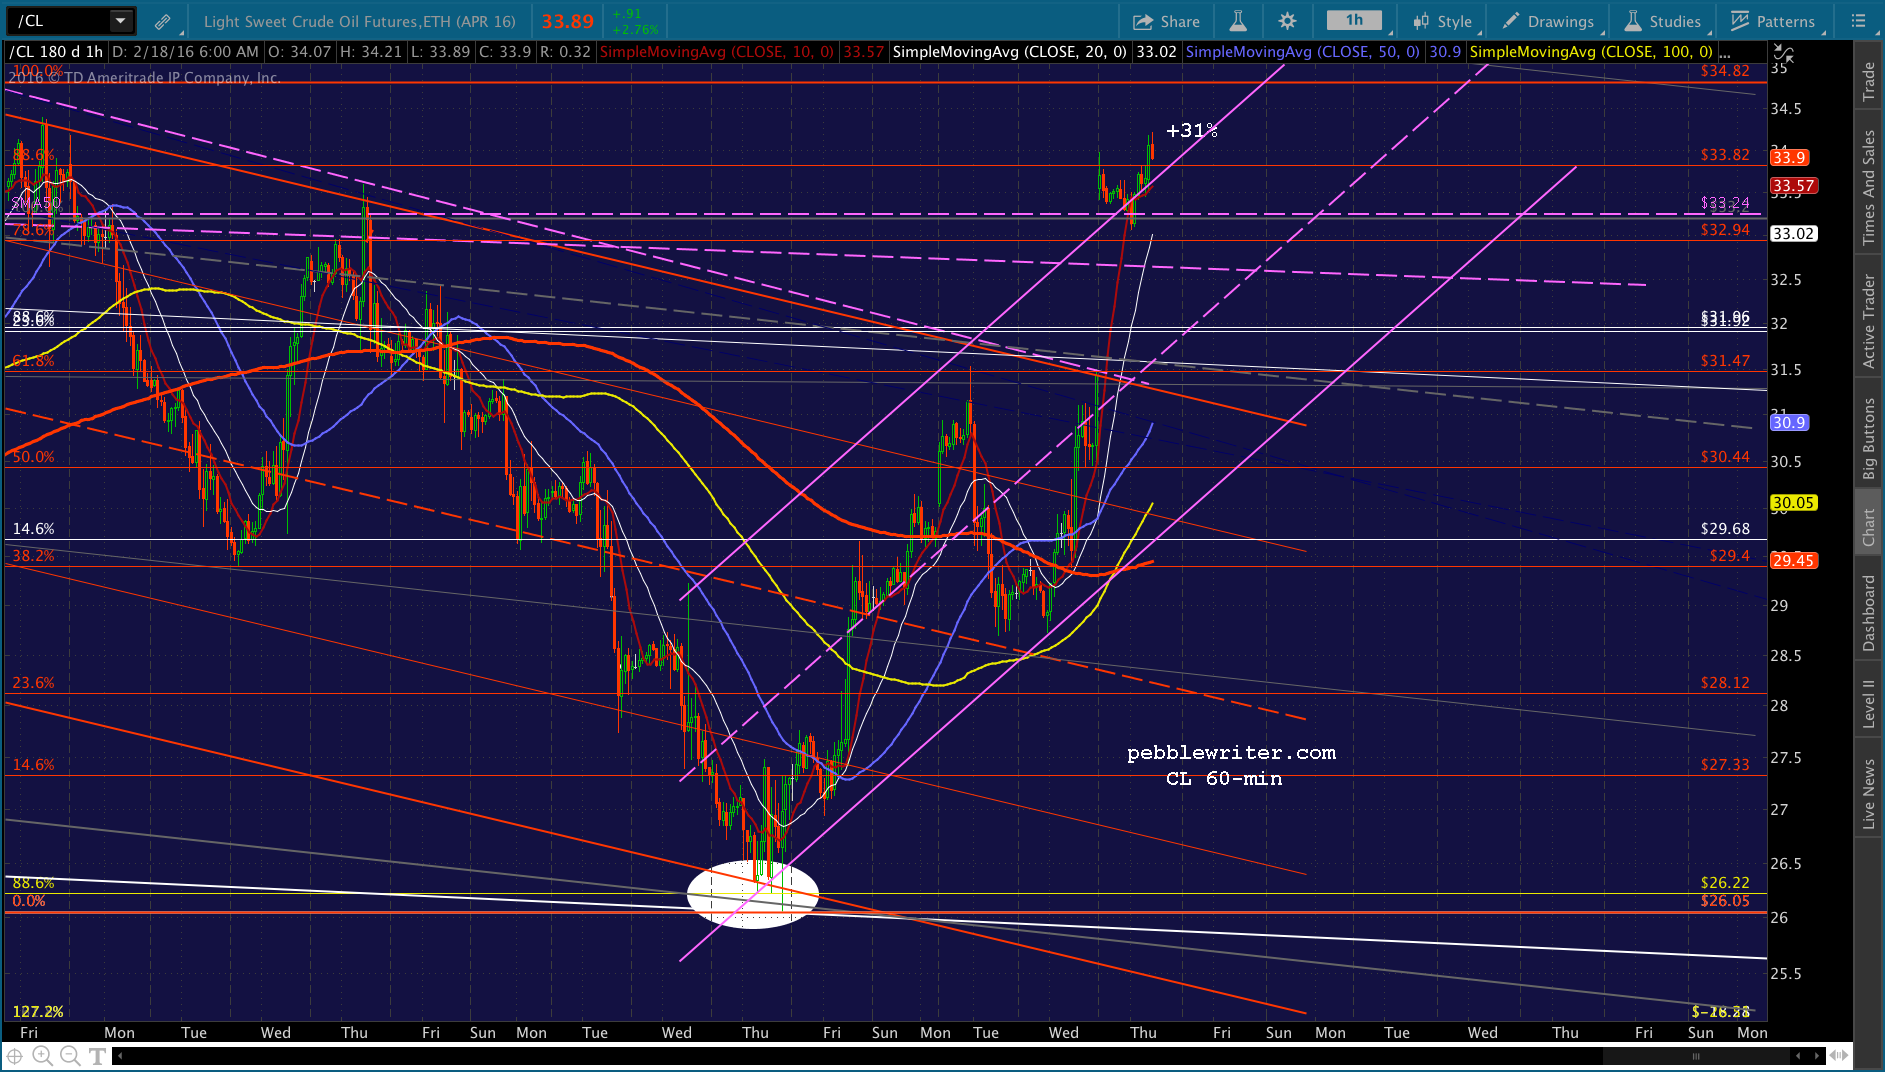
Note the cluster there consisting of the SMA100, the falling gray channel top, the red, dashed TL, and the falling white channel midline.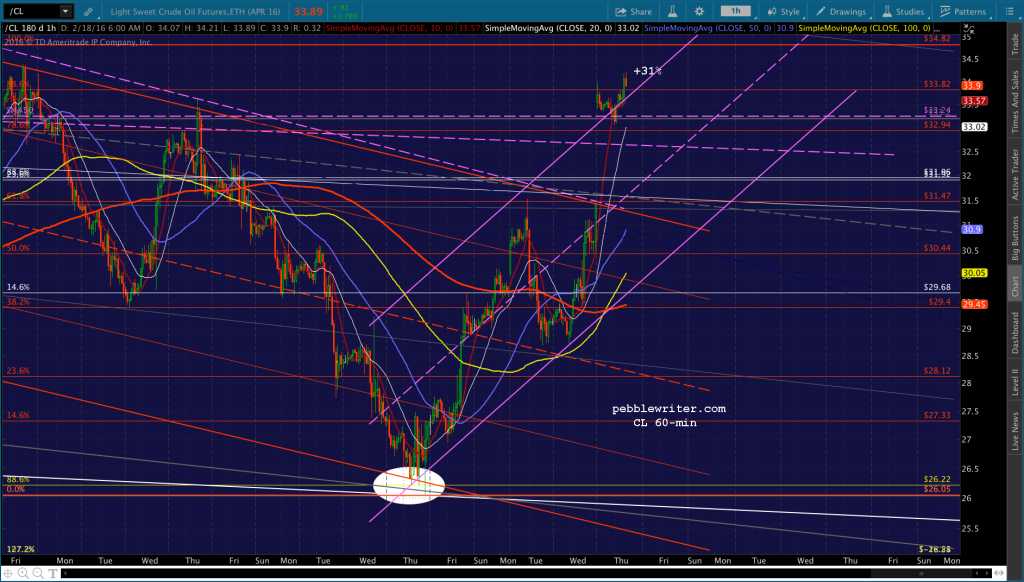 With OPEX tomorrow, it increases the odds of at least a plateauing at these prices until early next week.
If I’m wrong, and a backtest is forthcoming, then CL should target 31.49 to close the gap — but, probably not until next week. But, if I’m right, this is a dangerous vehicle to short.
This move is designed to make a statement to the algos — that CL is back.
* * * * *
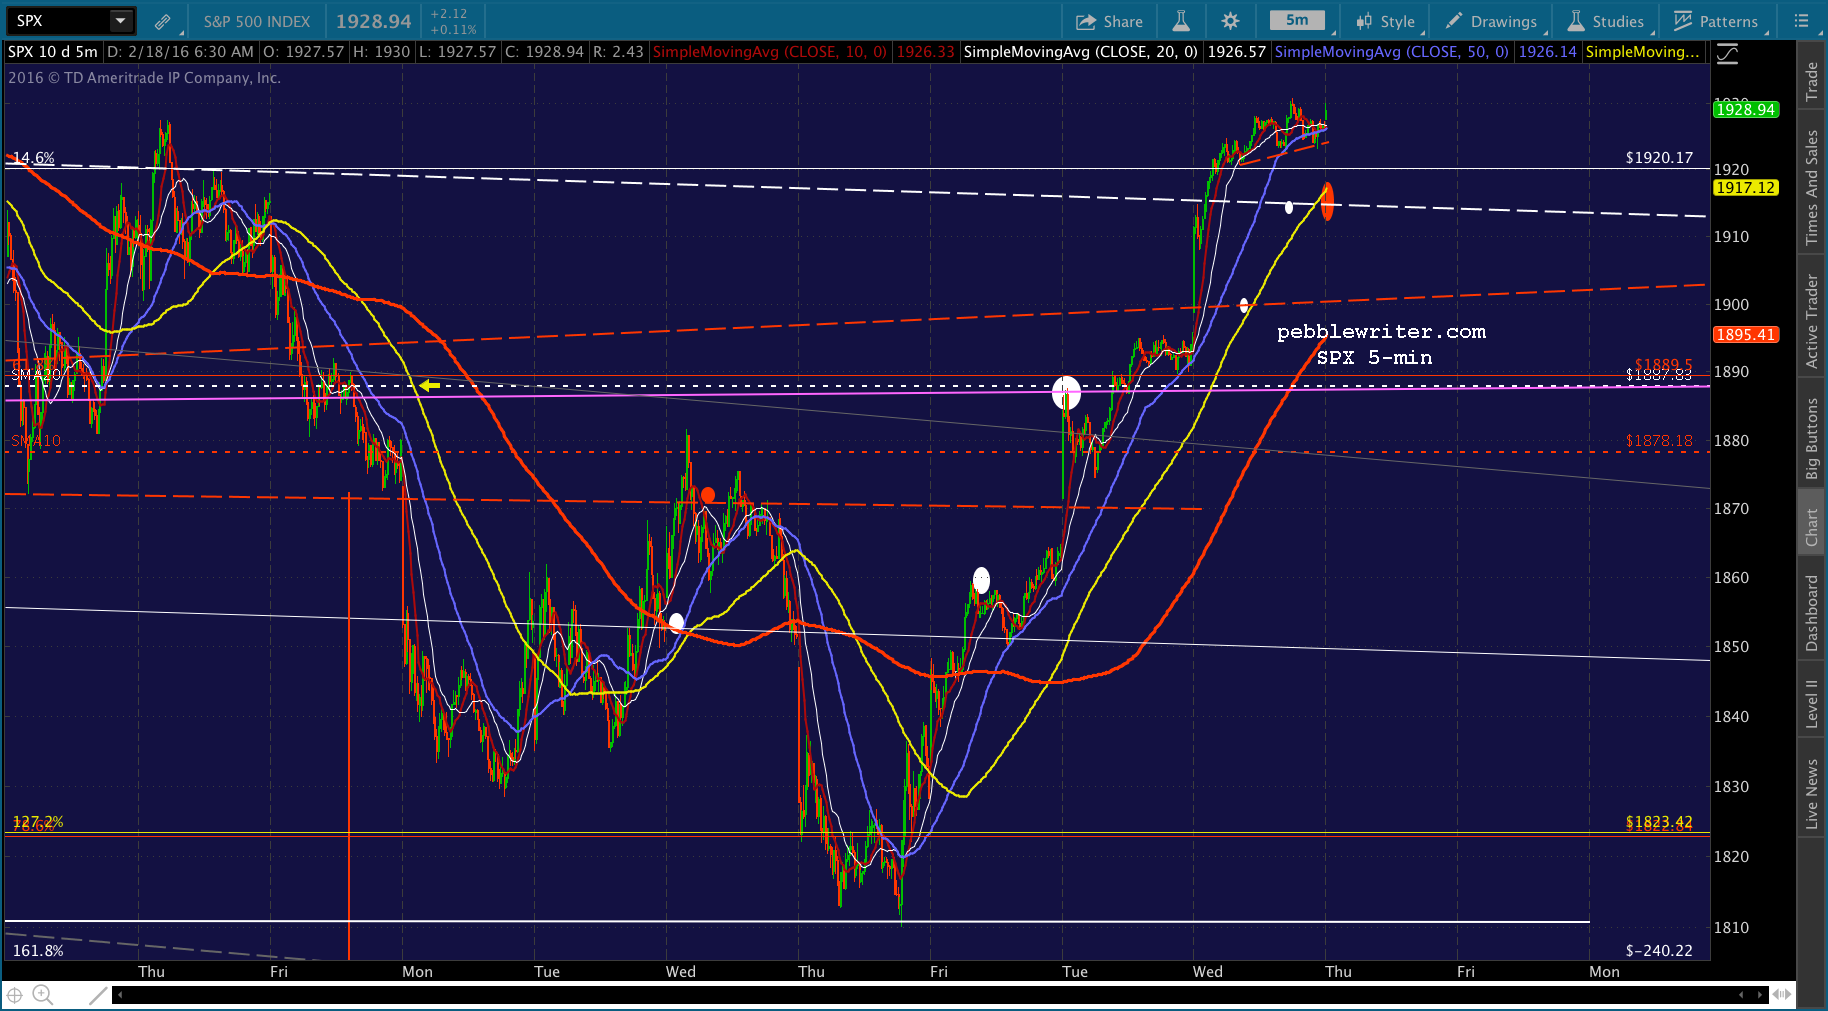
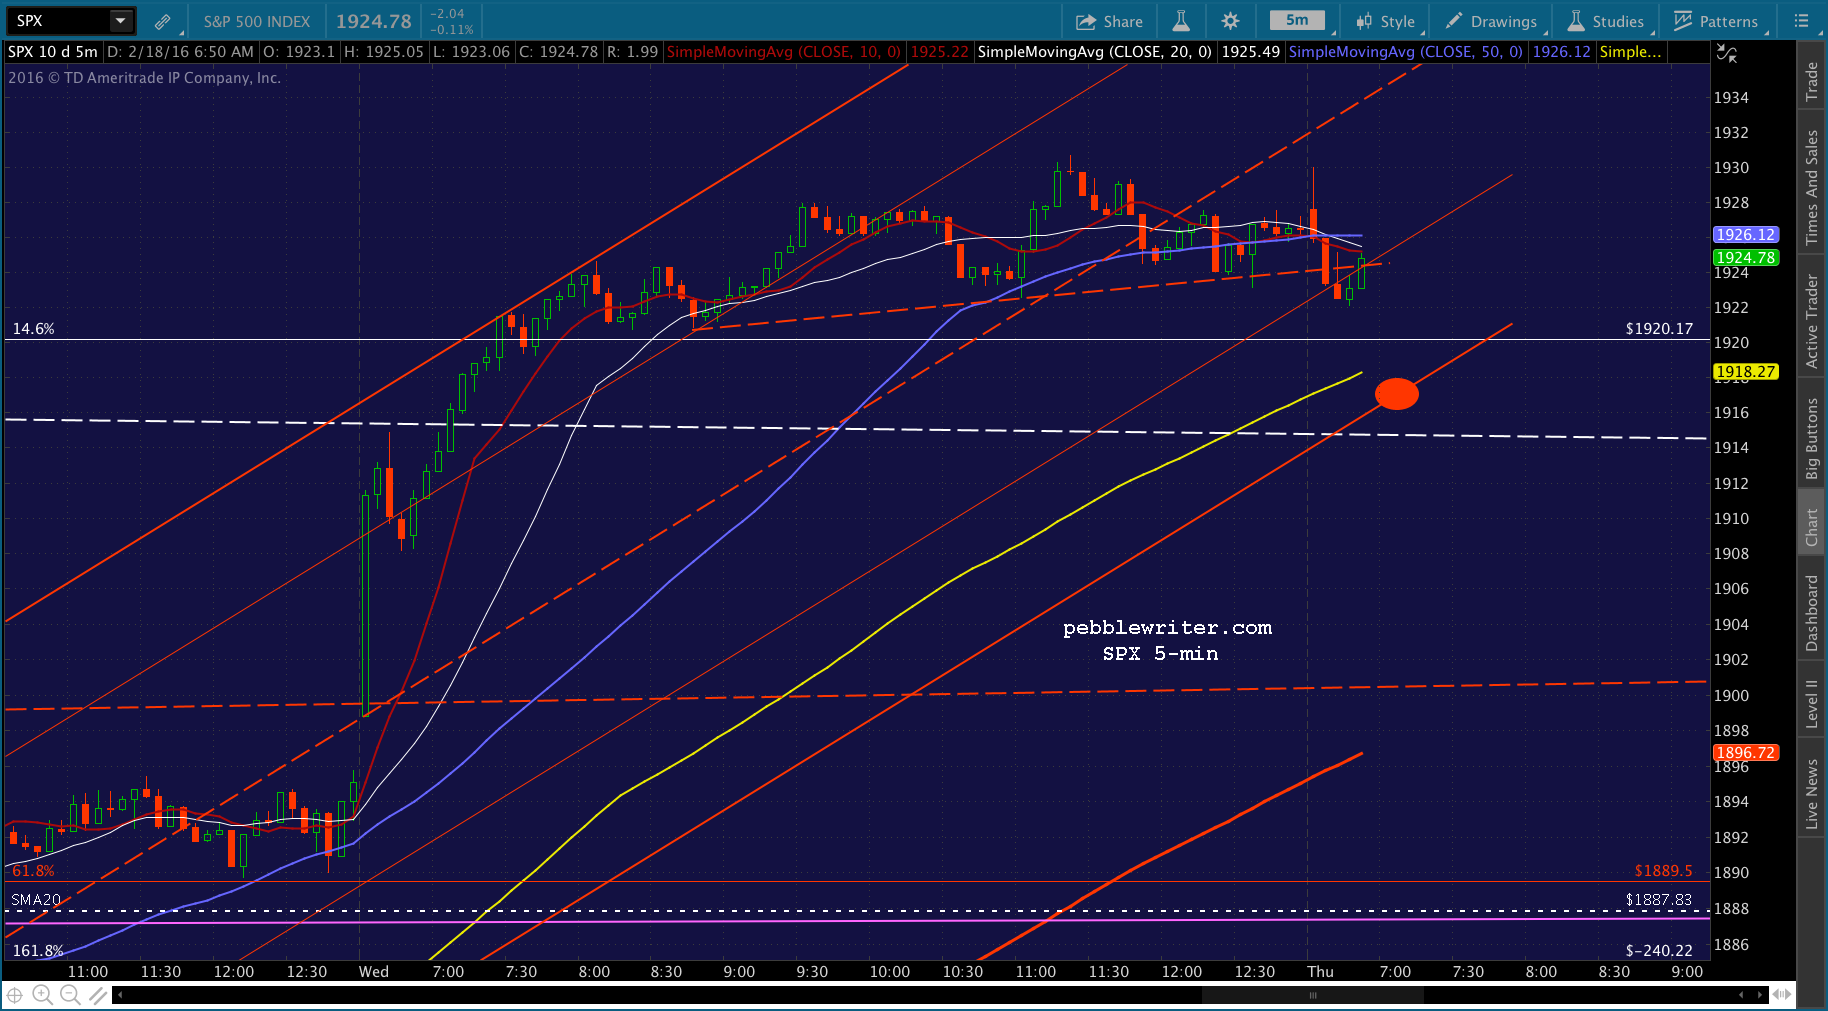
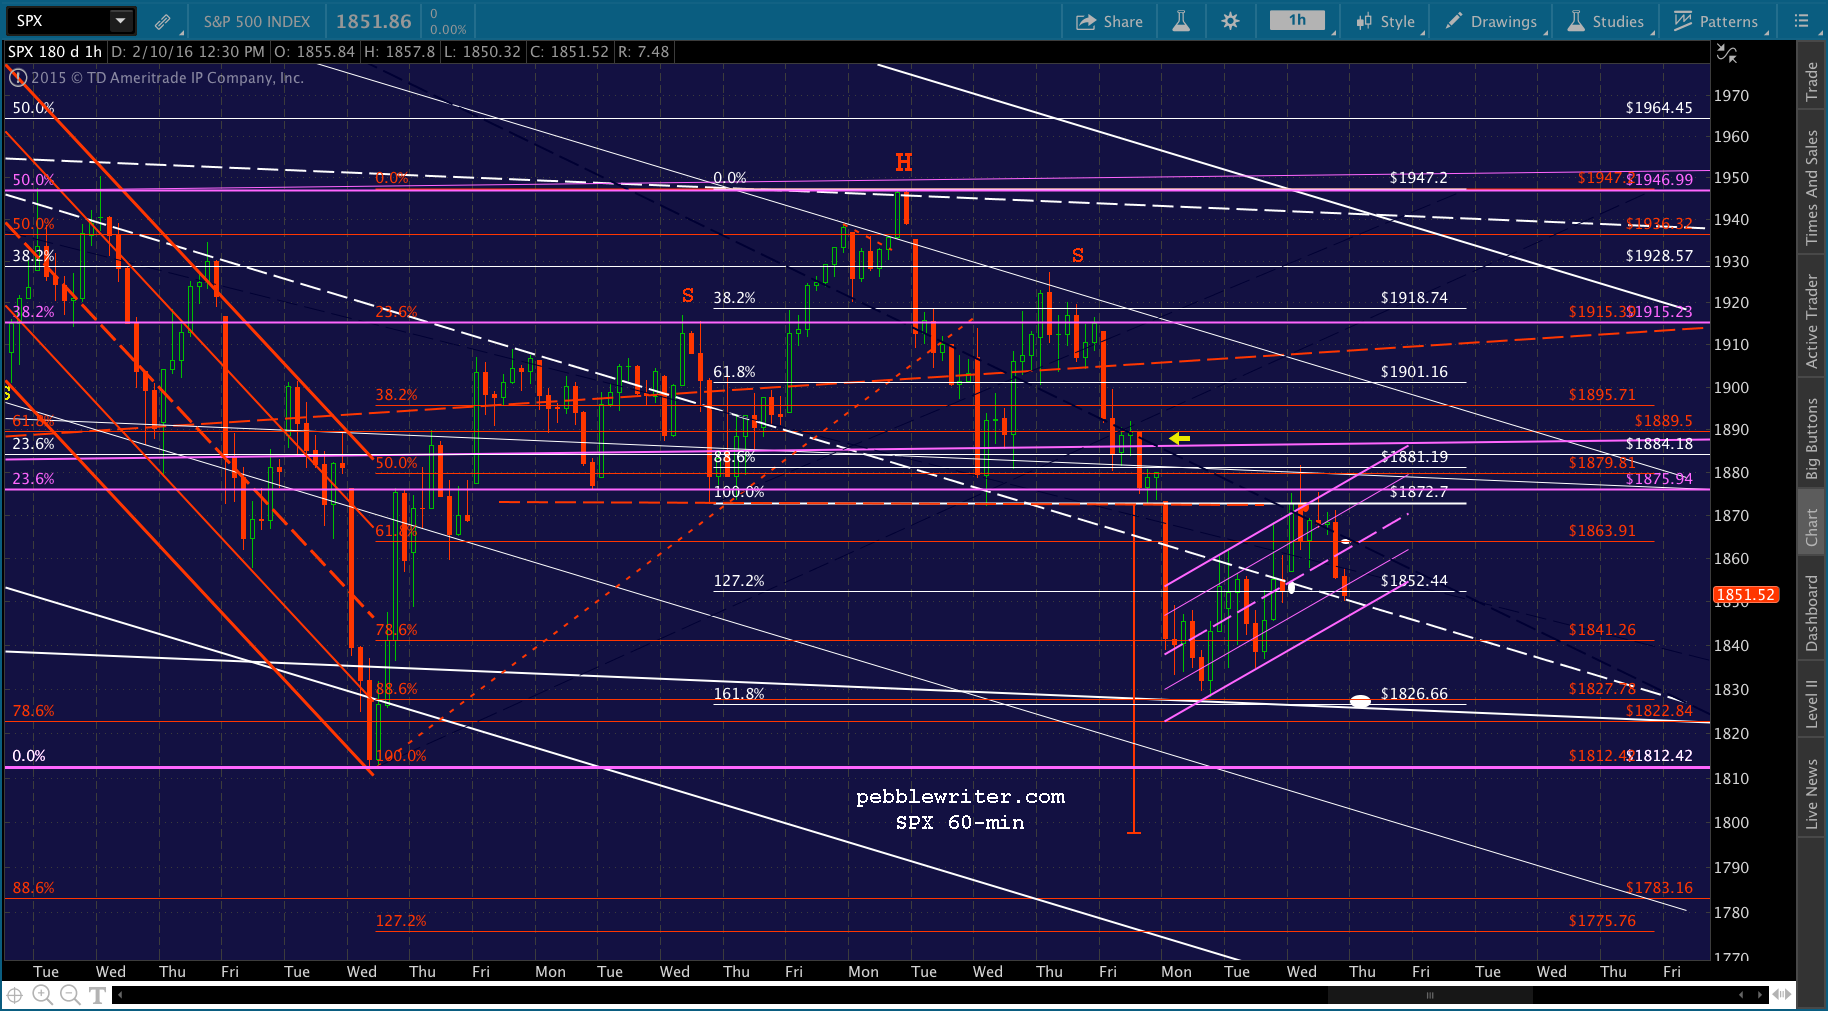
A quick update on stocks, as I’m running a little late this morning… I’m looking for that backtest we never could manage yesterday. Perhaps SPX 1914-1917. Much of it depends on USDJPY, which is again threatening to break out.
 UPDATE: 9:31 AM
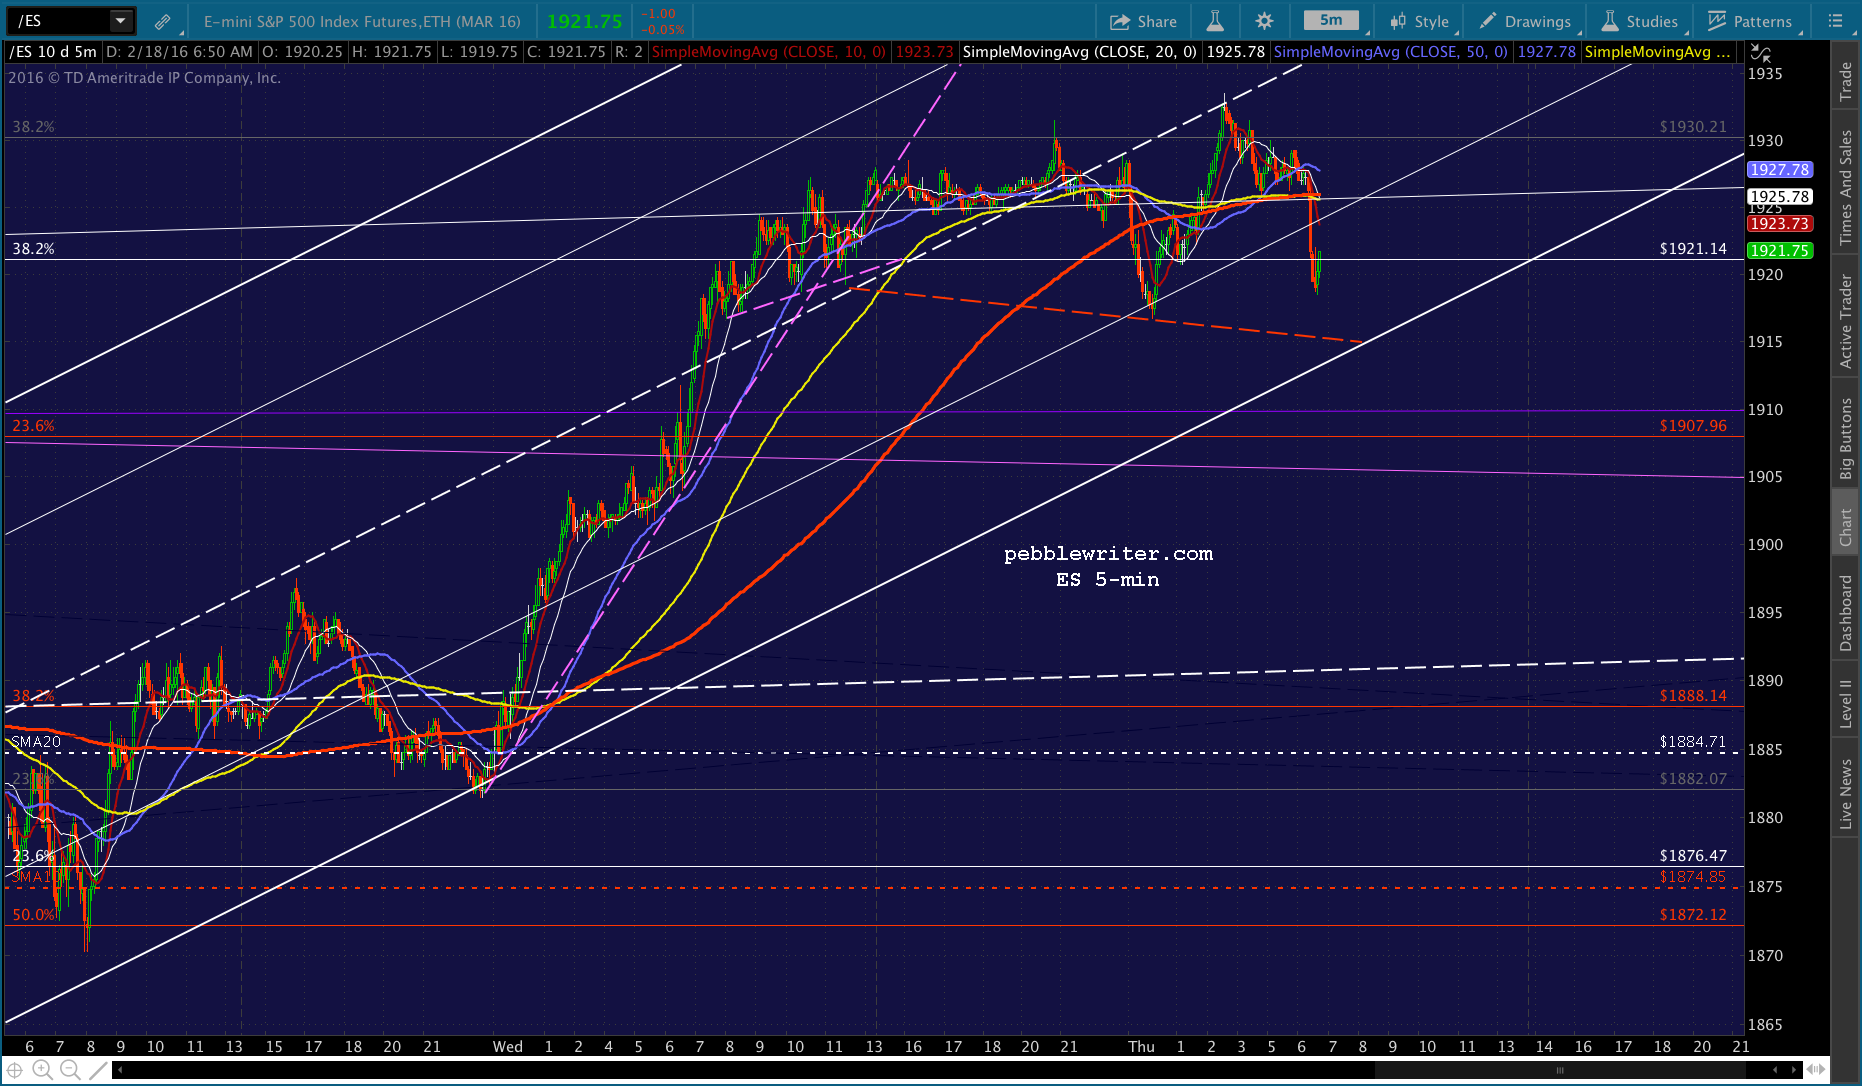
I’d short here at 1928.94 for the drop referenced above. The SMA5 100, currently at 1917.32, is rising to meet it, and this drop could be limited to 1920 or so. If I’m right, USDJPY should drop through the purple TL.
 One slightly bearish chart to watch today: NKD, which is backtesting the broken purple channel.
 UPDATE: 9:53 AM
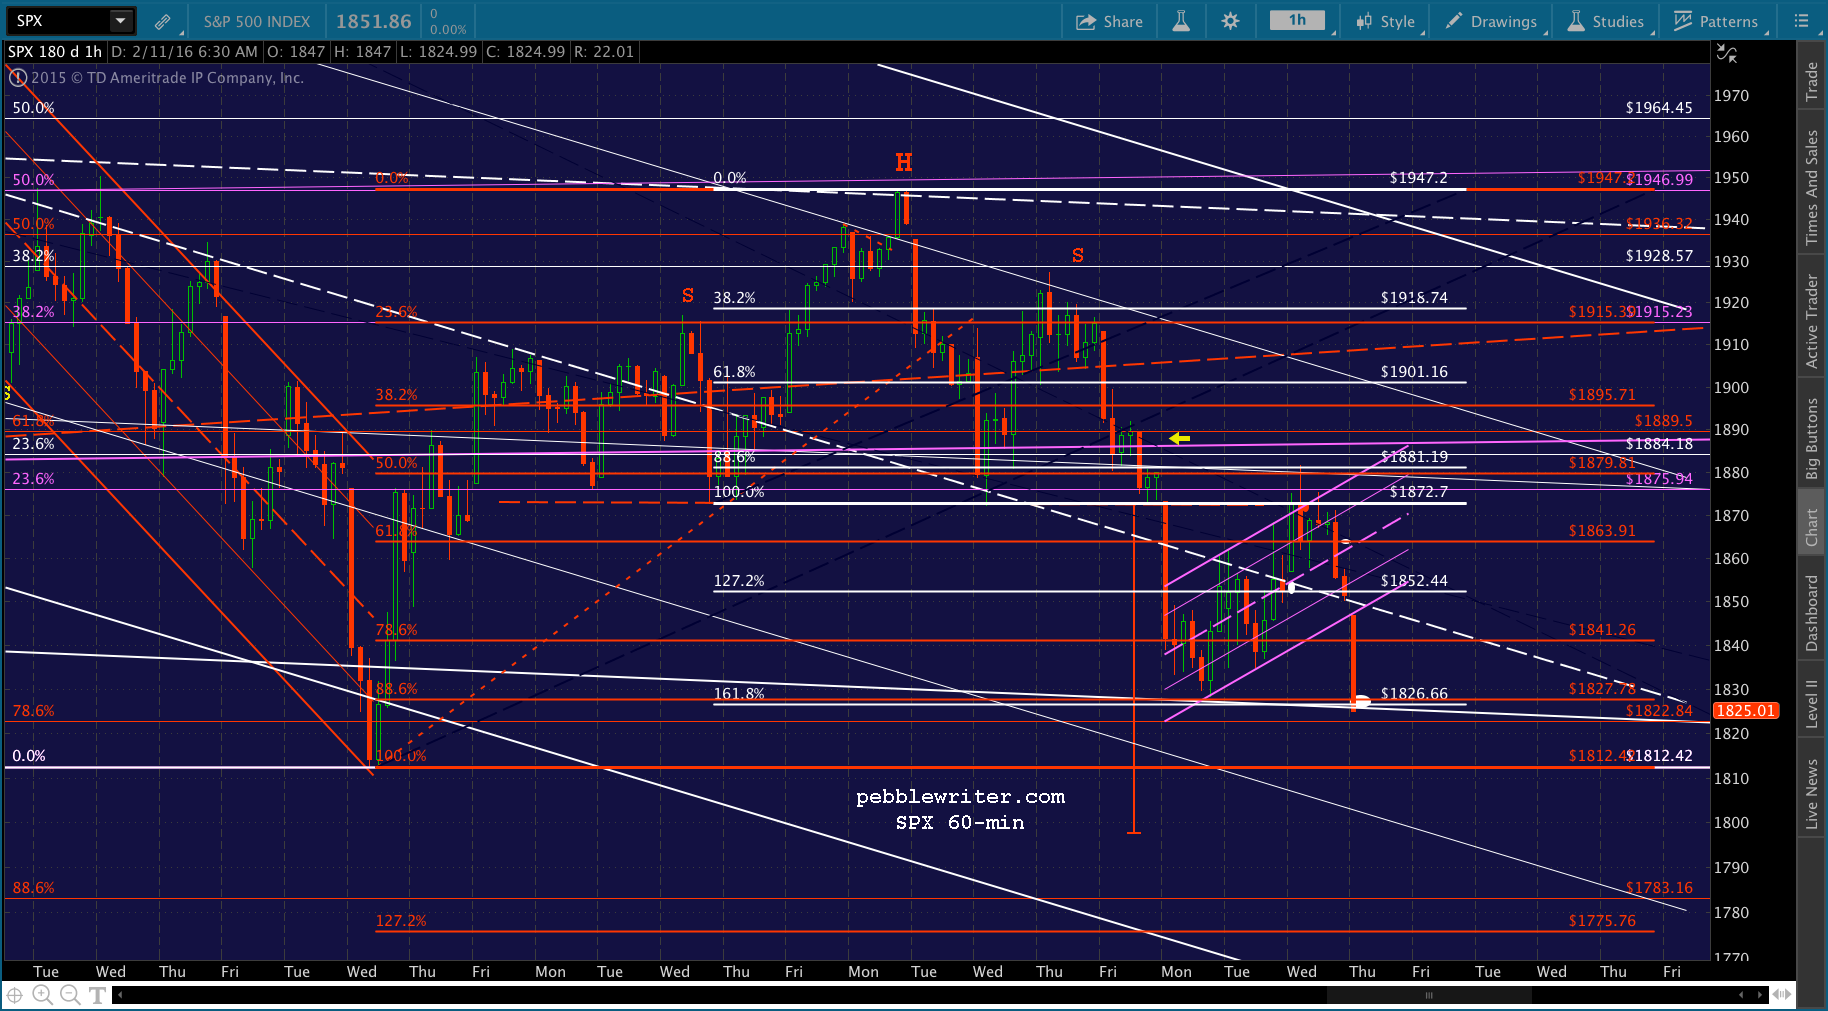
Quick progress report… I believe they’ll use a CL drop to or through the SMA5 100 and 200 intersection at 33.56-33.60 to effect whatever drop they have in store. Might be holding out for SPX’s SMA5 100 to reach the .146 Fib at 1920.17 around 10:30. But, a quick drop to the white channel midline at 1914.80ish would also be nice.
I hope ES is off a little, as it suggests 1915 around 11:30. 90 minutes is a long time to wait for a 6-pt additional drop. Having said that, the red TL is somewhat arbitrary. No reason to think it’s THE ONE.


 I’m continuing this thread on the daily post: Charts I’m Watching: Feb 18, 2016. See you over there…


 continued for members… (more…)