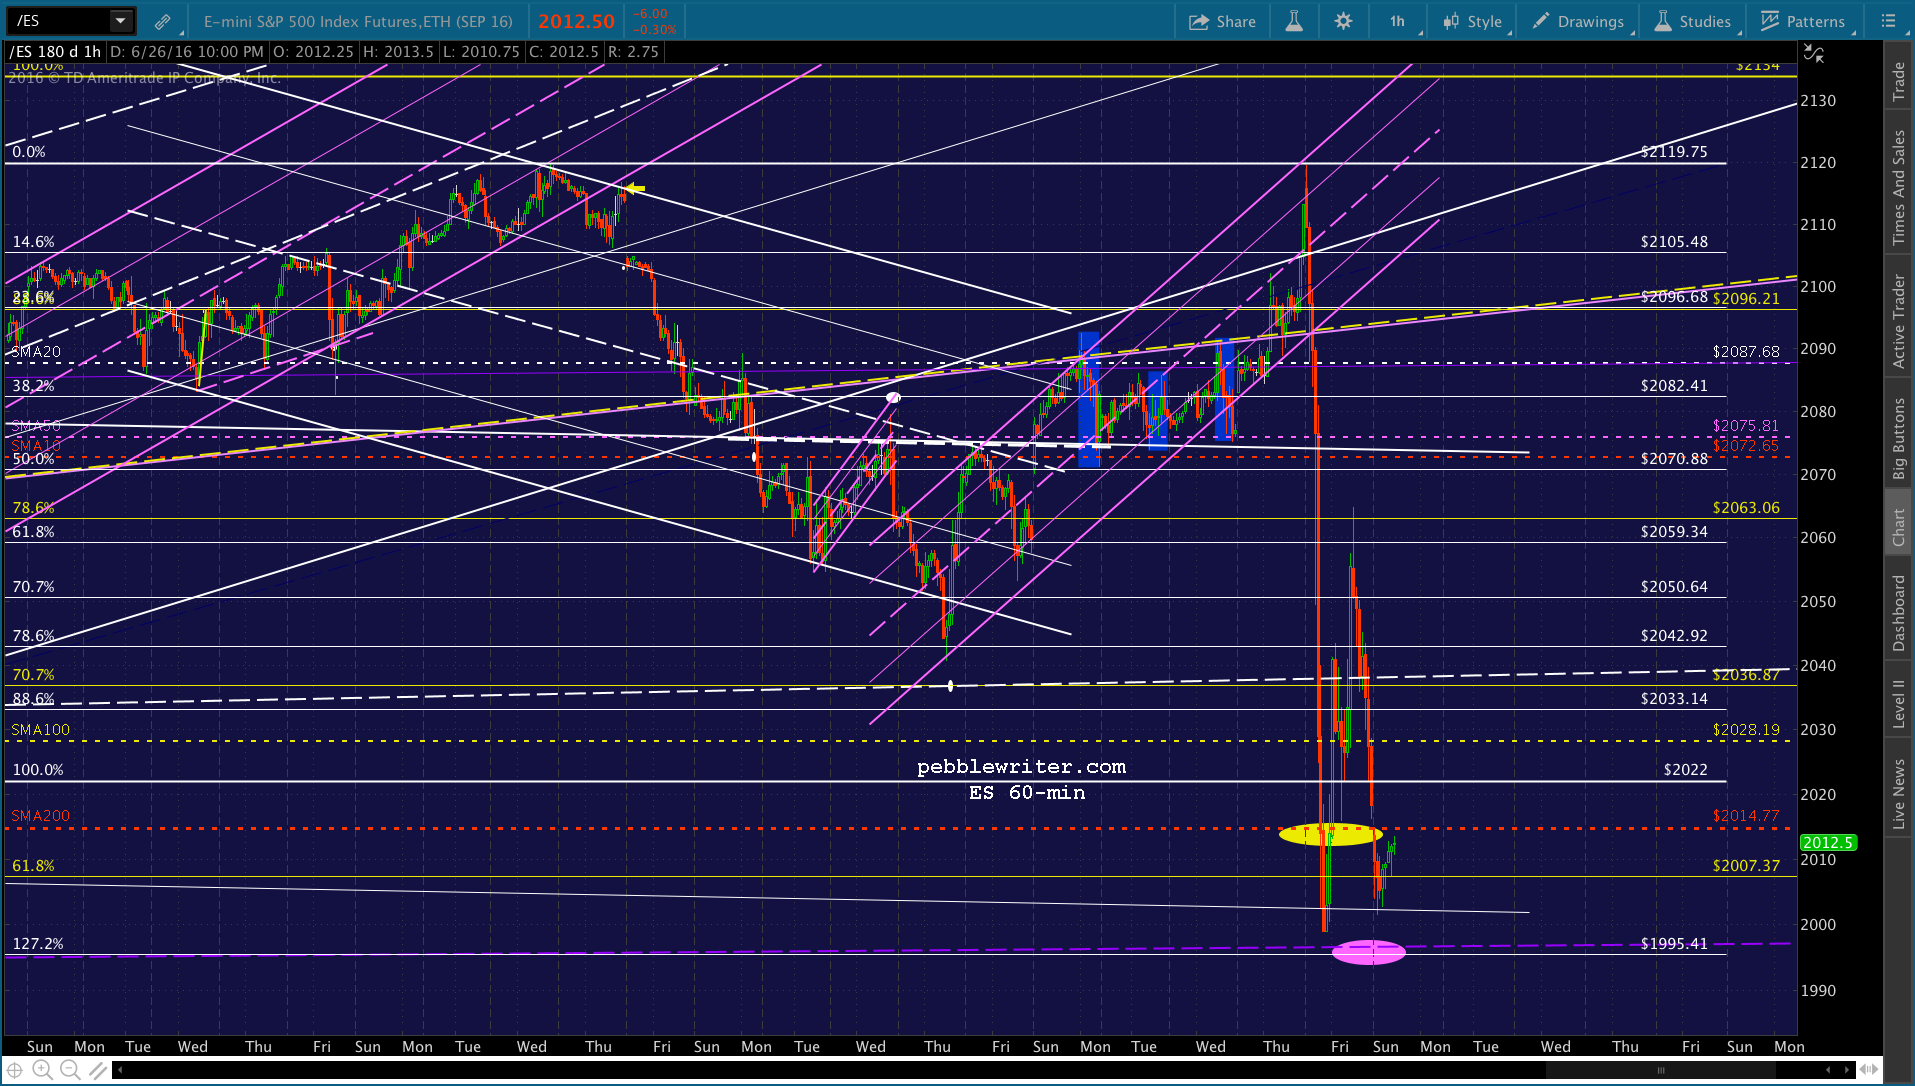
Update Jun 23, 11:53 PM:
BBC, Sky and ITV have all called it. The Brexit prevailed, and markets are none too happy.
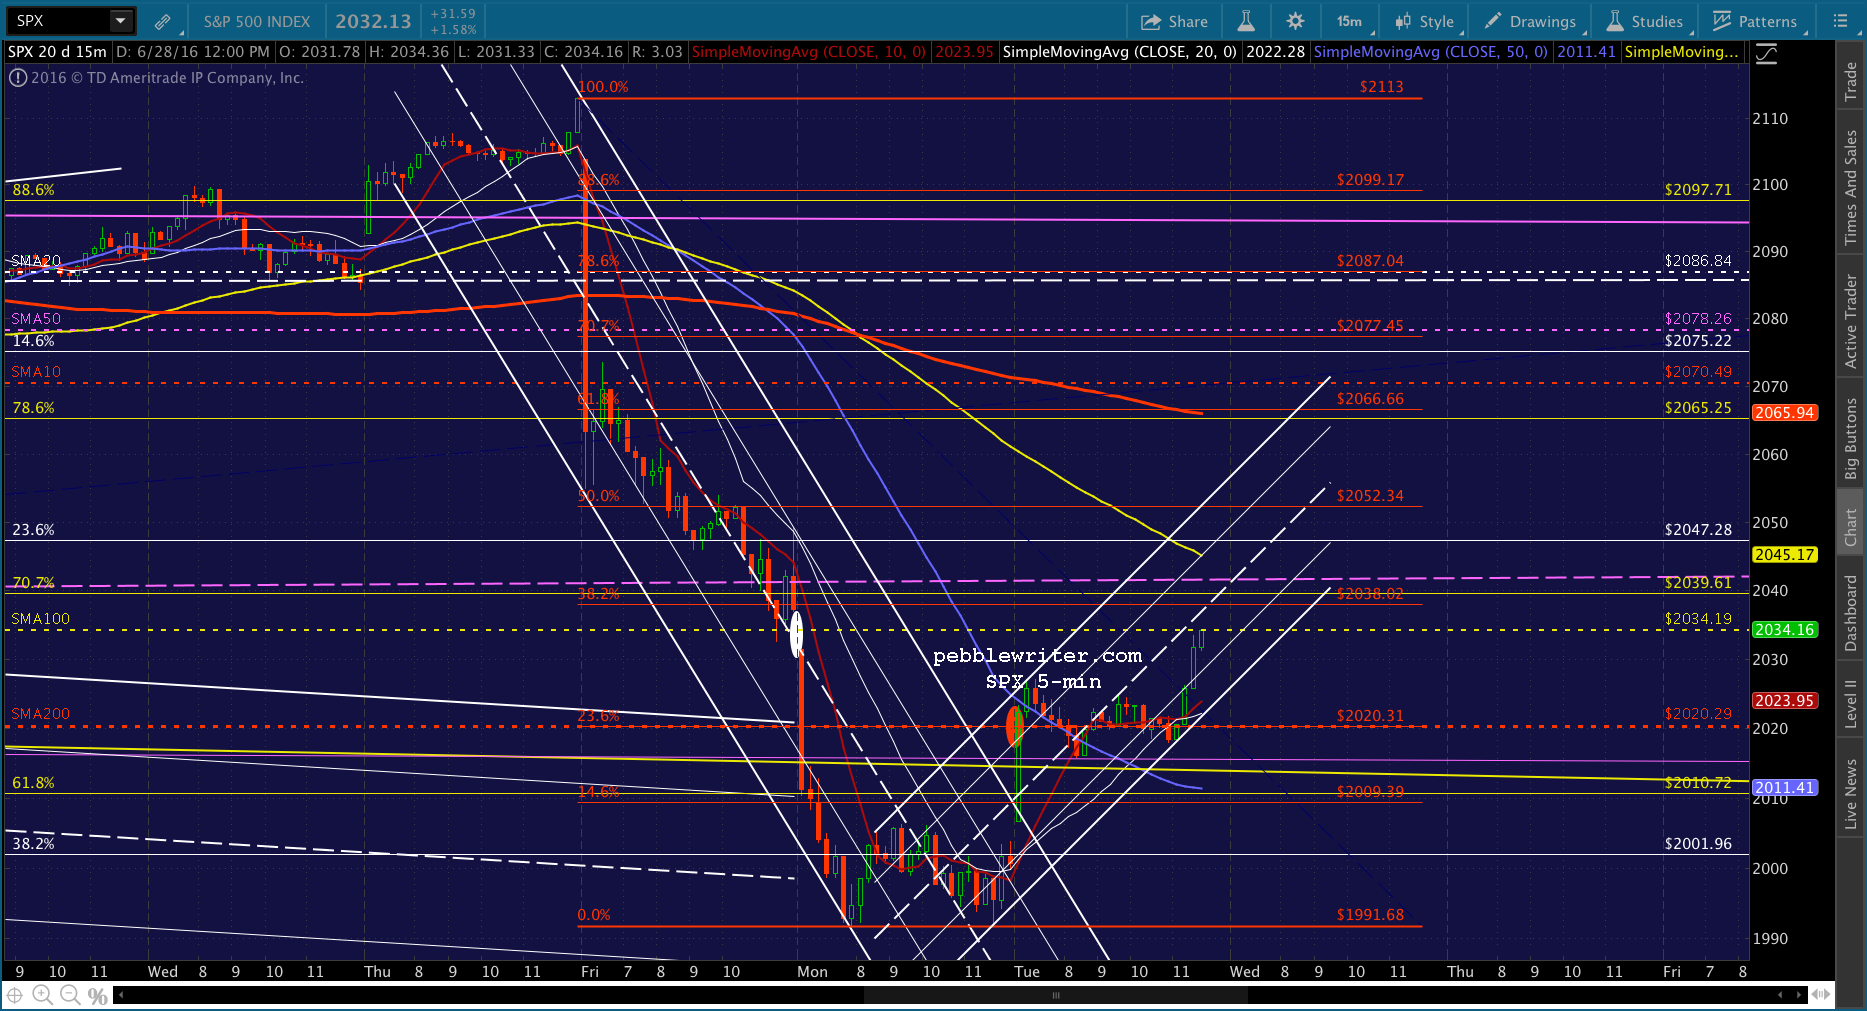
Nikkei futures tumbled over 10%…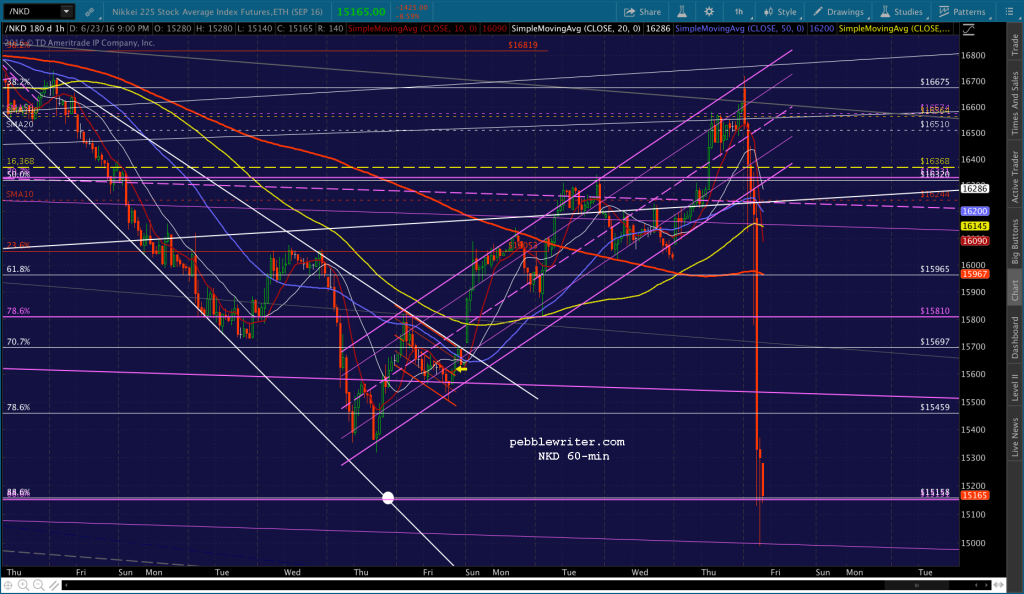 …while S&P 500 futures fell about 5.5%, easily reaching our first downside target and very likely to nail our second.
 Even oil futures were off an impressive 7.4% before going into damage control mode.
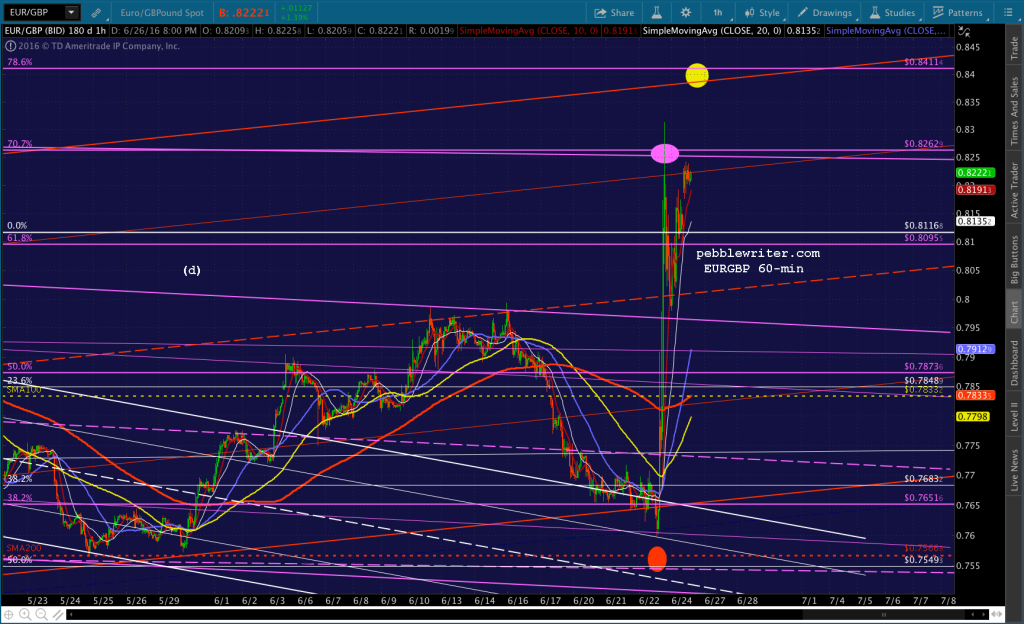
 EURGBP, the most telling of the currency pairs and the one we’ve focused on the last several days, is approaching our initial upside target and will likely tag the next.
Unless we get a massive bounce overnight, look for SPX to tag the downside target laid out earlier today in The Eve of Destruction – Part II and of course back on Jun 14 in our last Big Picture Update. Stay tuned, and trade safe.
UPDATE: 9:15 AM
Remember May 19, when SPX bounced sharply, going up to bust out of the falling white channel to new highs? I suspected it would, but was disappointed that it couldn’t manage a little lower in order to tag the yellow .618 at 2010 — also the level of the SMA200 at the time. CL, which had just reached the .618 retracement of its drop from 62.58 in May 2015 to 26.05 in Feb 2016, was almost solely responsible. It shot back up above the .618 (the yellow arrow) and spent the next month ramping SPX higher in a series of bizarre channels that defy all reason.
 I wondered at the time what the end game was. Now, it’s crystal clear. By breaking SPX out of the falling channel and extending the rising white channel an extra month, they were able to force it 110 points higher. If SPX were to lose 100 points from Brexit, it would be net ahead of where it was.
It’s a much better outcome for central planners than losing 100 points from 2010. If successful, they will have maintained the breakout from the falling yellow channel dating back to 2015’s highs — ideally with another (the 8th? 10th?) backtest of that channel and a bounce off the SMA200.
Sad, of course, that our “markets” are now so heavily manipulated that they require quote marks. But, it’s a smart strategy, and one that might just work.
* * * * *
There are a couple of ways to play this for those who were on the sidelines last night. First, since this is Friday, be extremely cautious of anything that requires you to hold over the weekend.
Second, it goes without saying that TPTB will pull out the usual stops to try and stem the tide. Yes, this means USDJPY and (especially) CL should see some strong rebounds as SPX approaches our downside target.
Simply put: if CL isn’t spiking higher, SPX isn’t done falling.
continued for members…
USDJPY has already rebounded quite a bit.

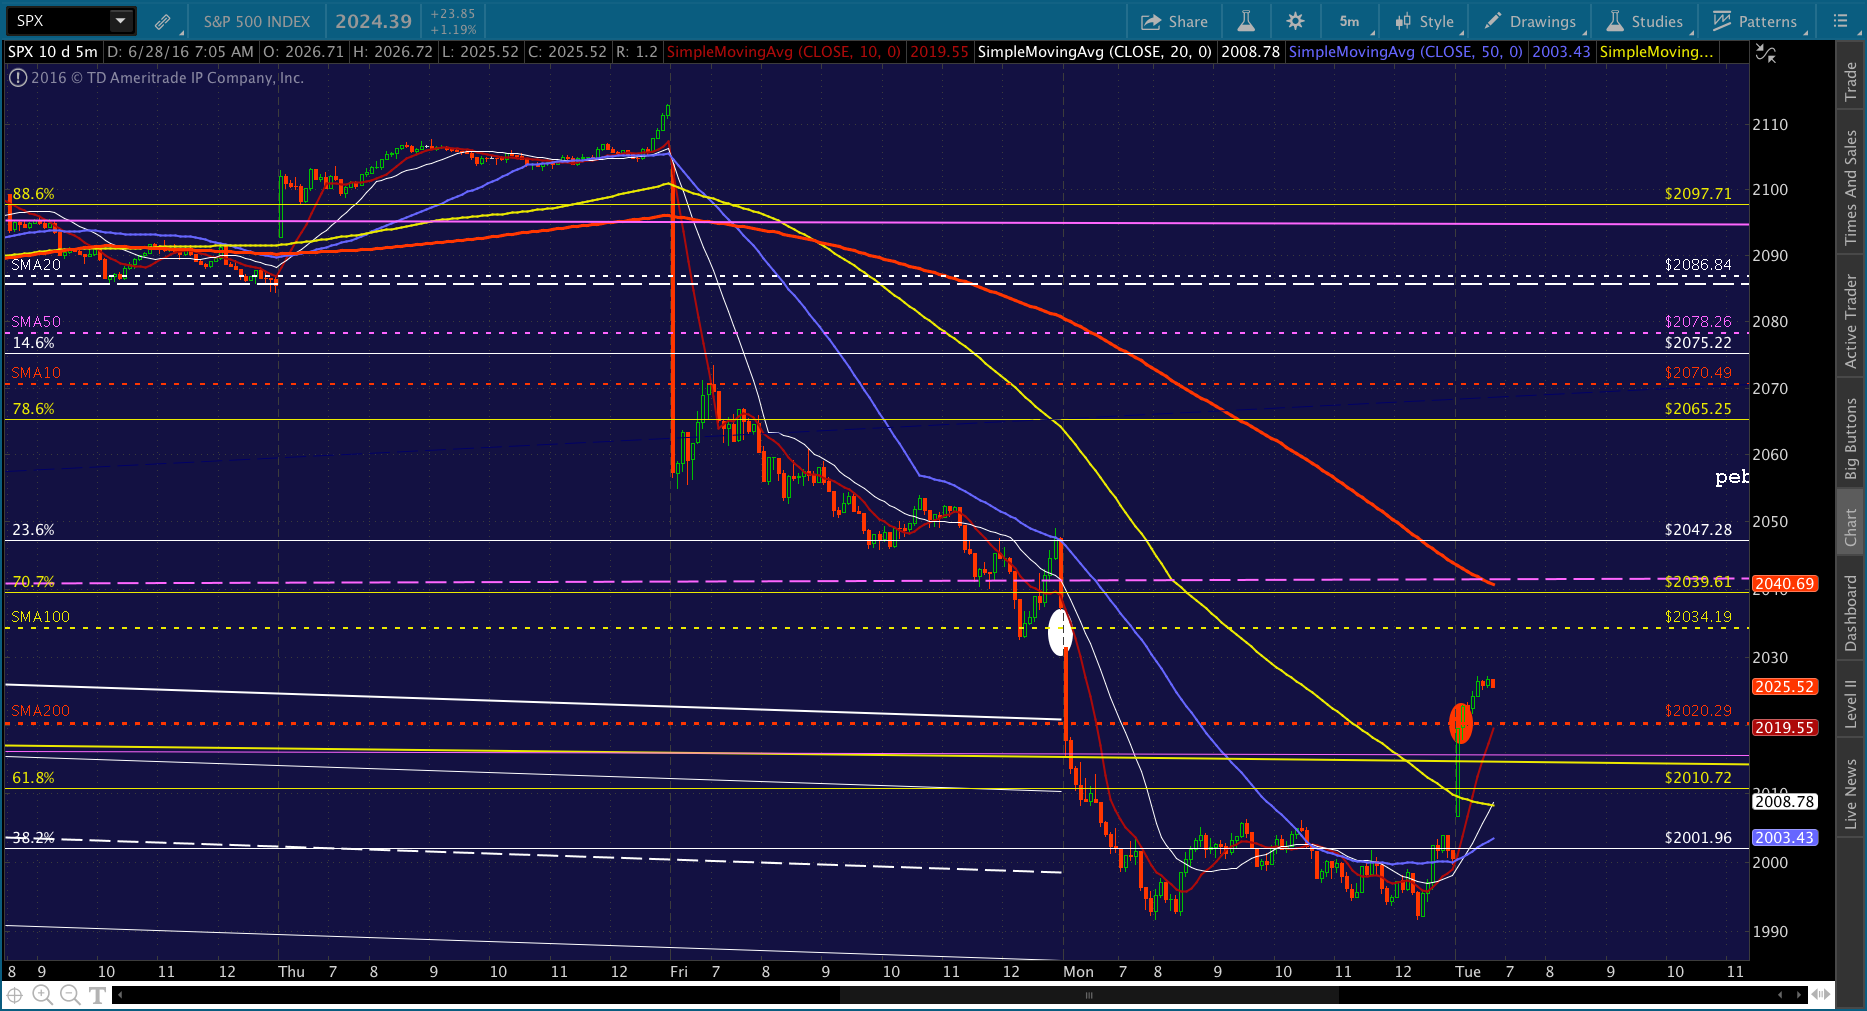
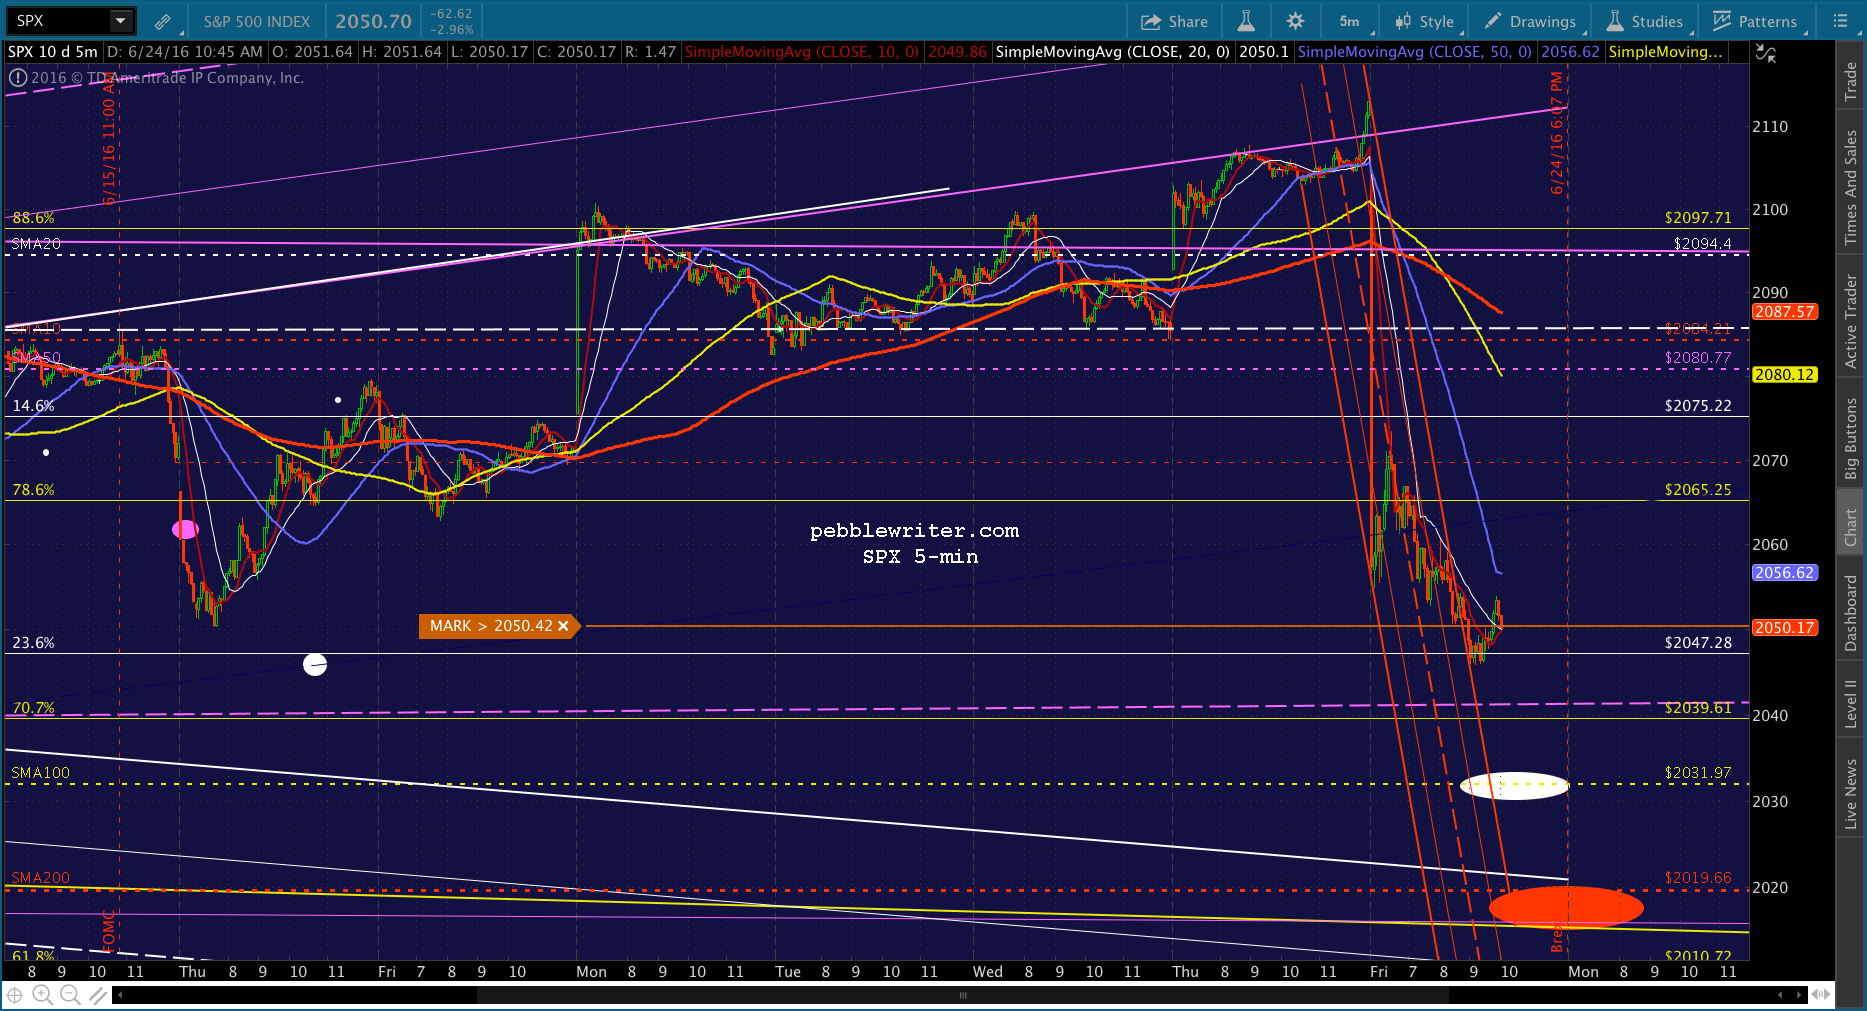
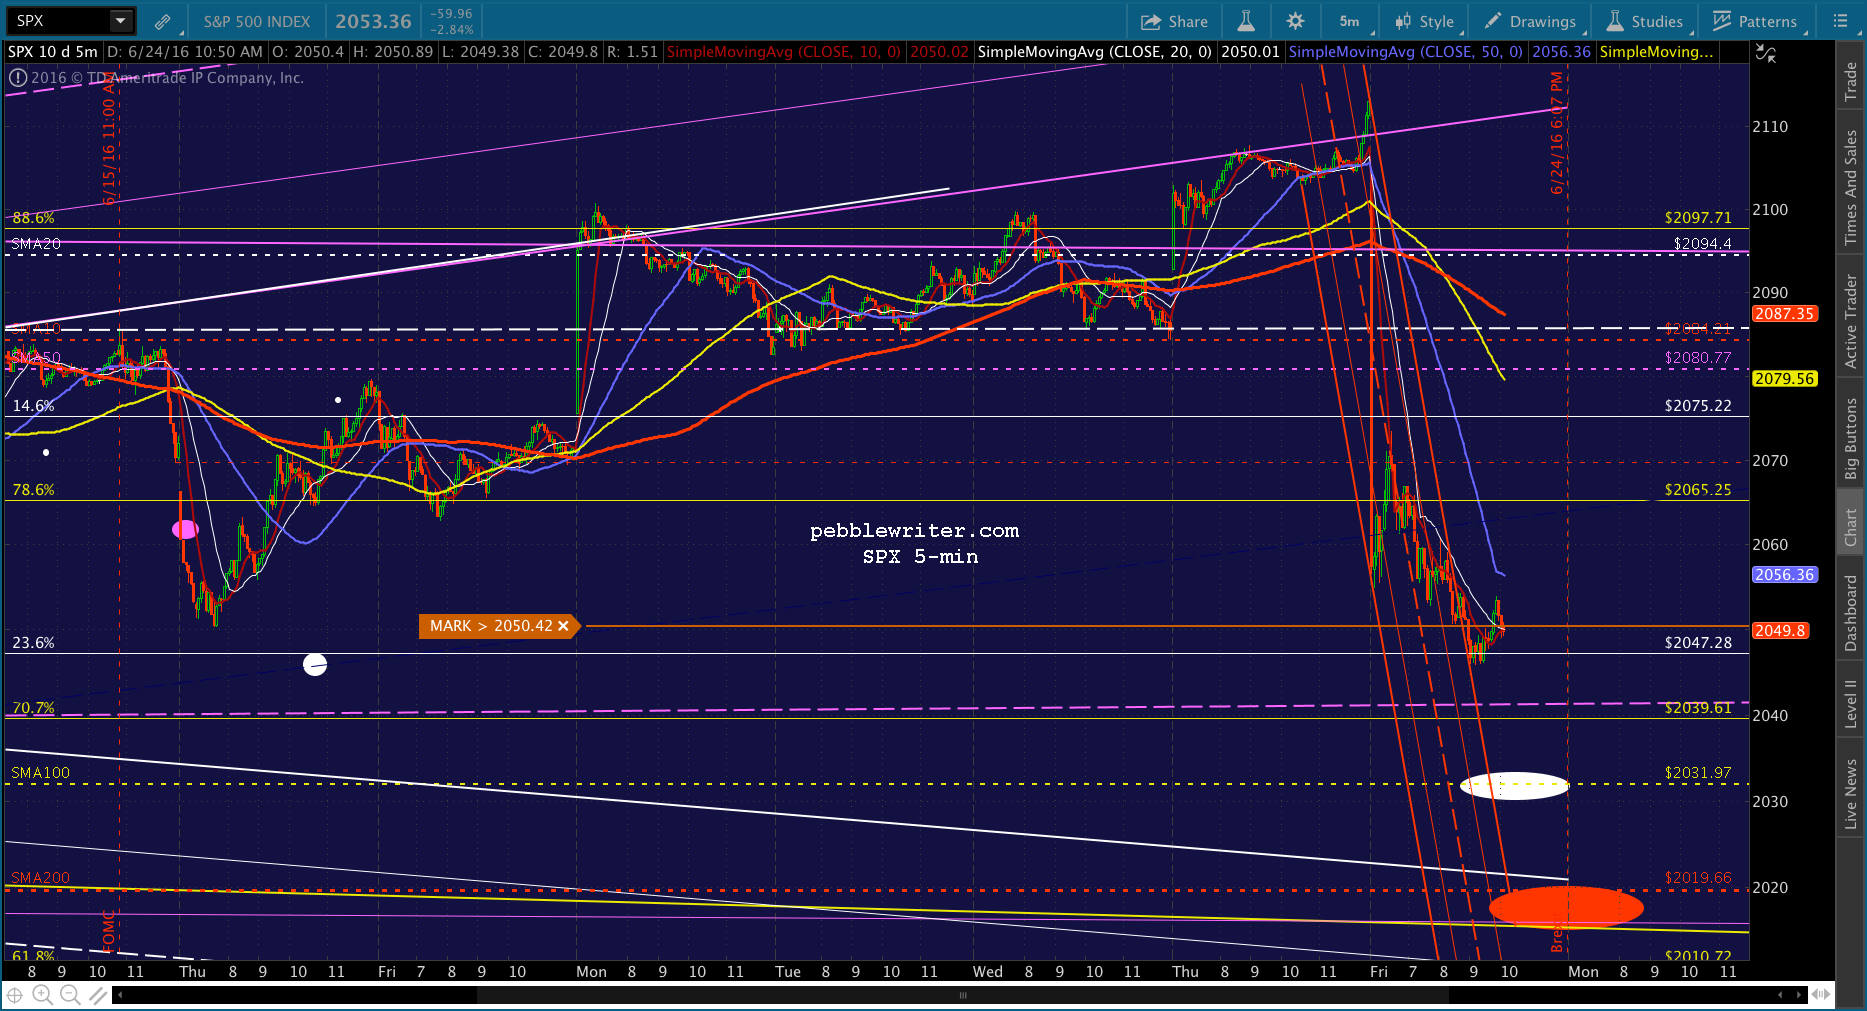
 Recall our downside targets for SPX…it could come in anywhere from 2010 (the yellow .618 and yellow channel top) to 2020 (the SMA200.) So, picking an exact bounce spot will be tricky. By all means, ride the index down to the vicinity of our targets. But, it’ll get very sloppy at that point, with plenty of false starts and head fakes.
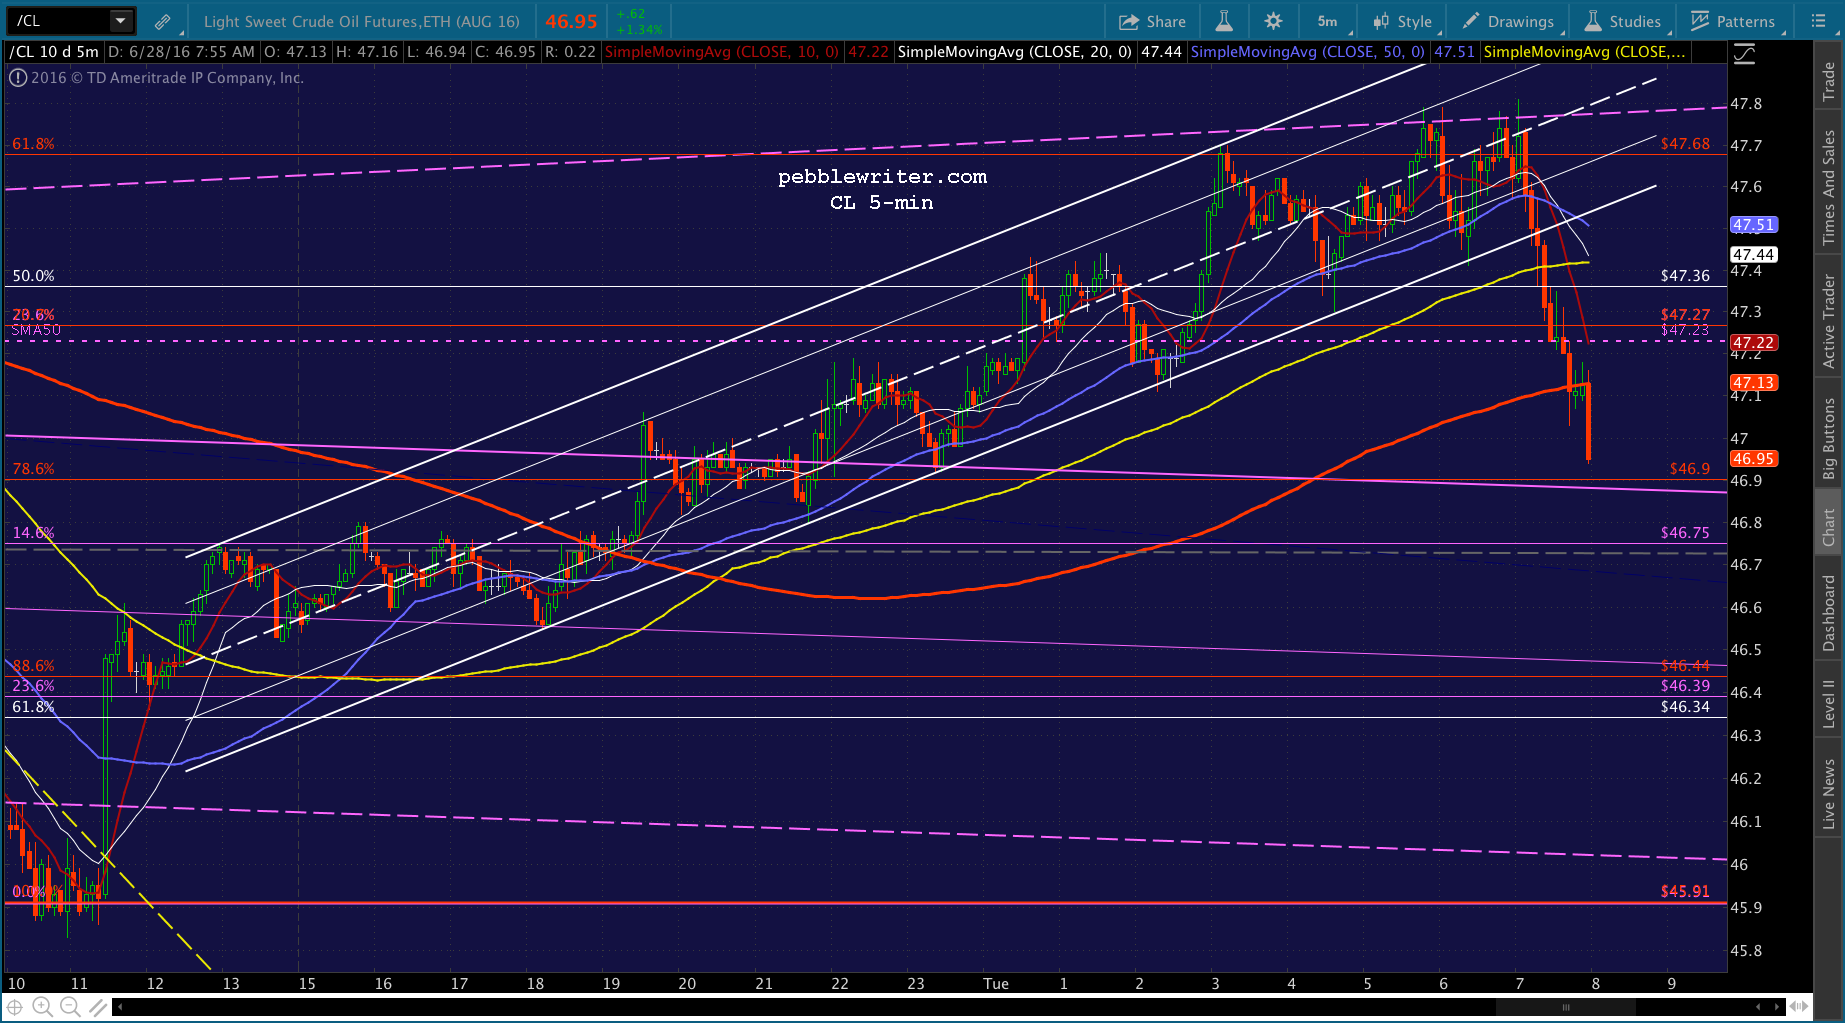
 A safer bet, once we reach the vicinity, is to look for CL to start ramping and jump on board. It tested its SMA50 overnight, and its purple channel midline seems to be holding.
 UPDATE: 11:48 AM
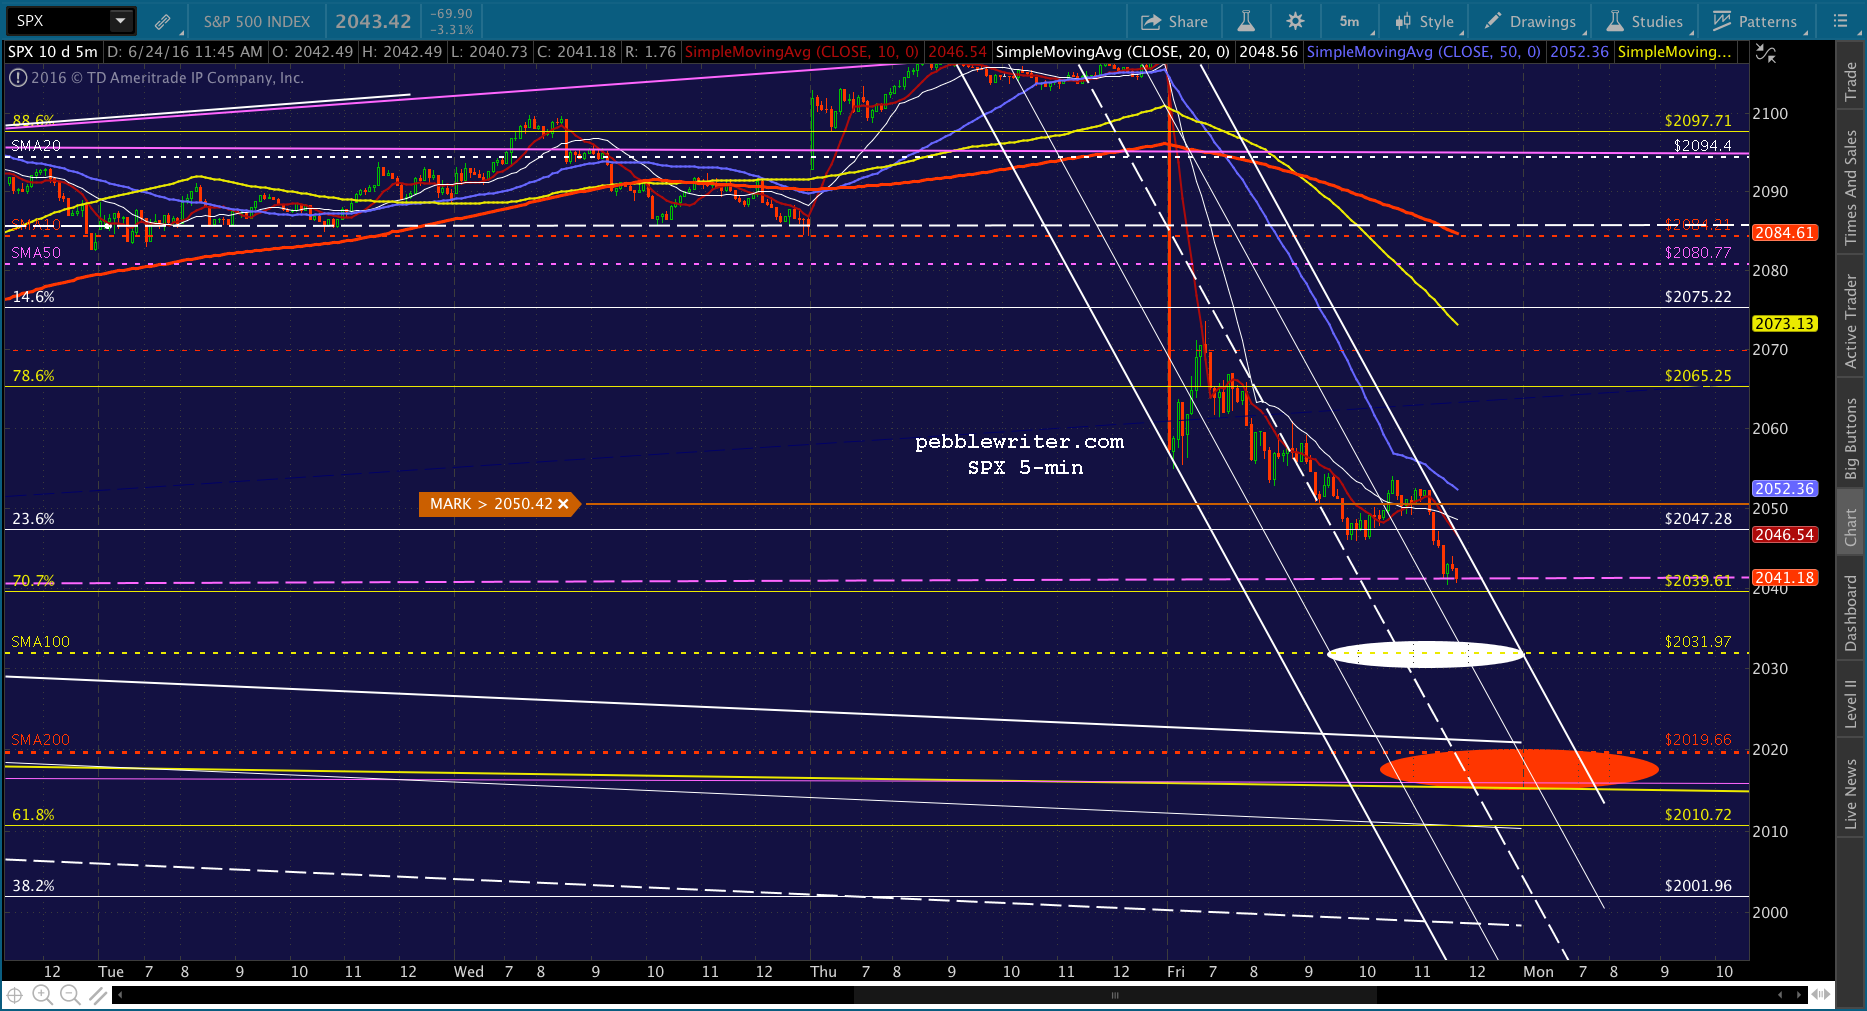
Quick update… Things are looking on track for SMA100 or SMA200 by the close, or first thing Monday morning.


 UPDATE: 12:42 PM
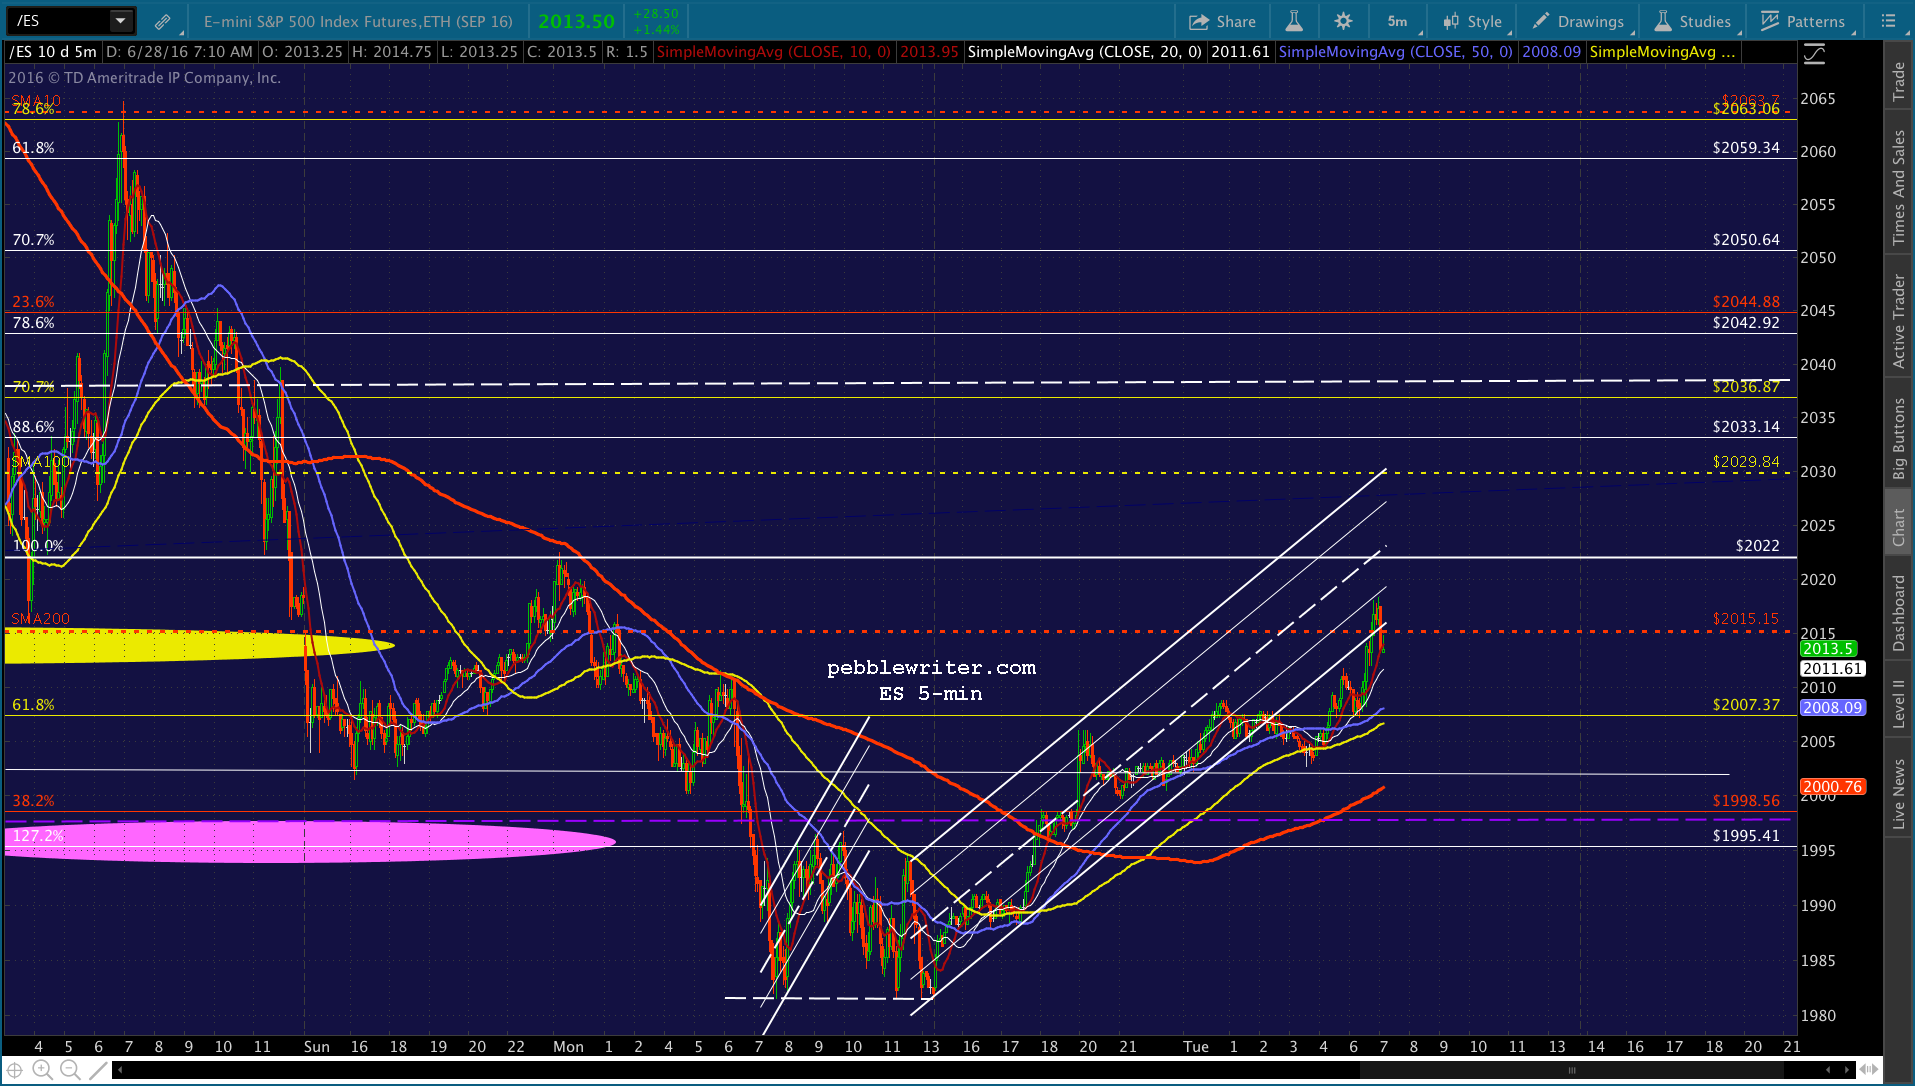
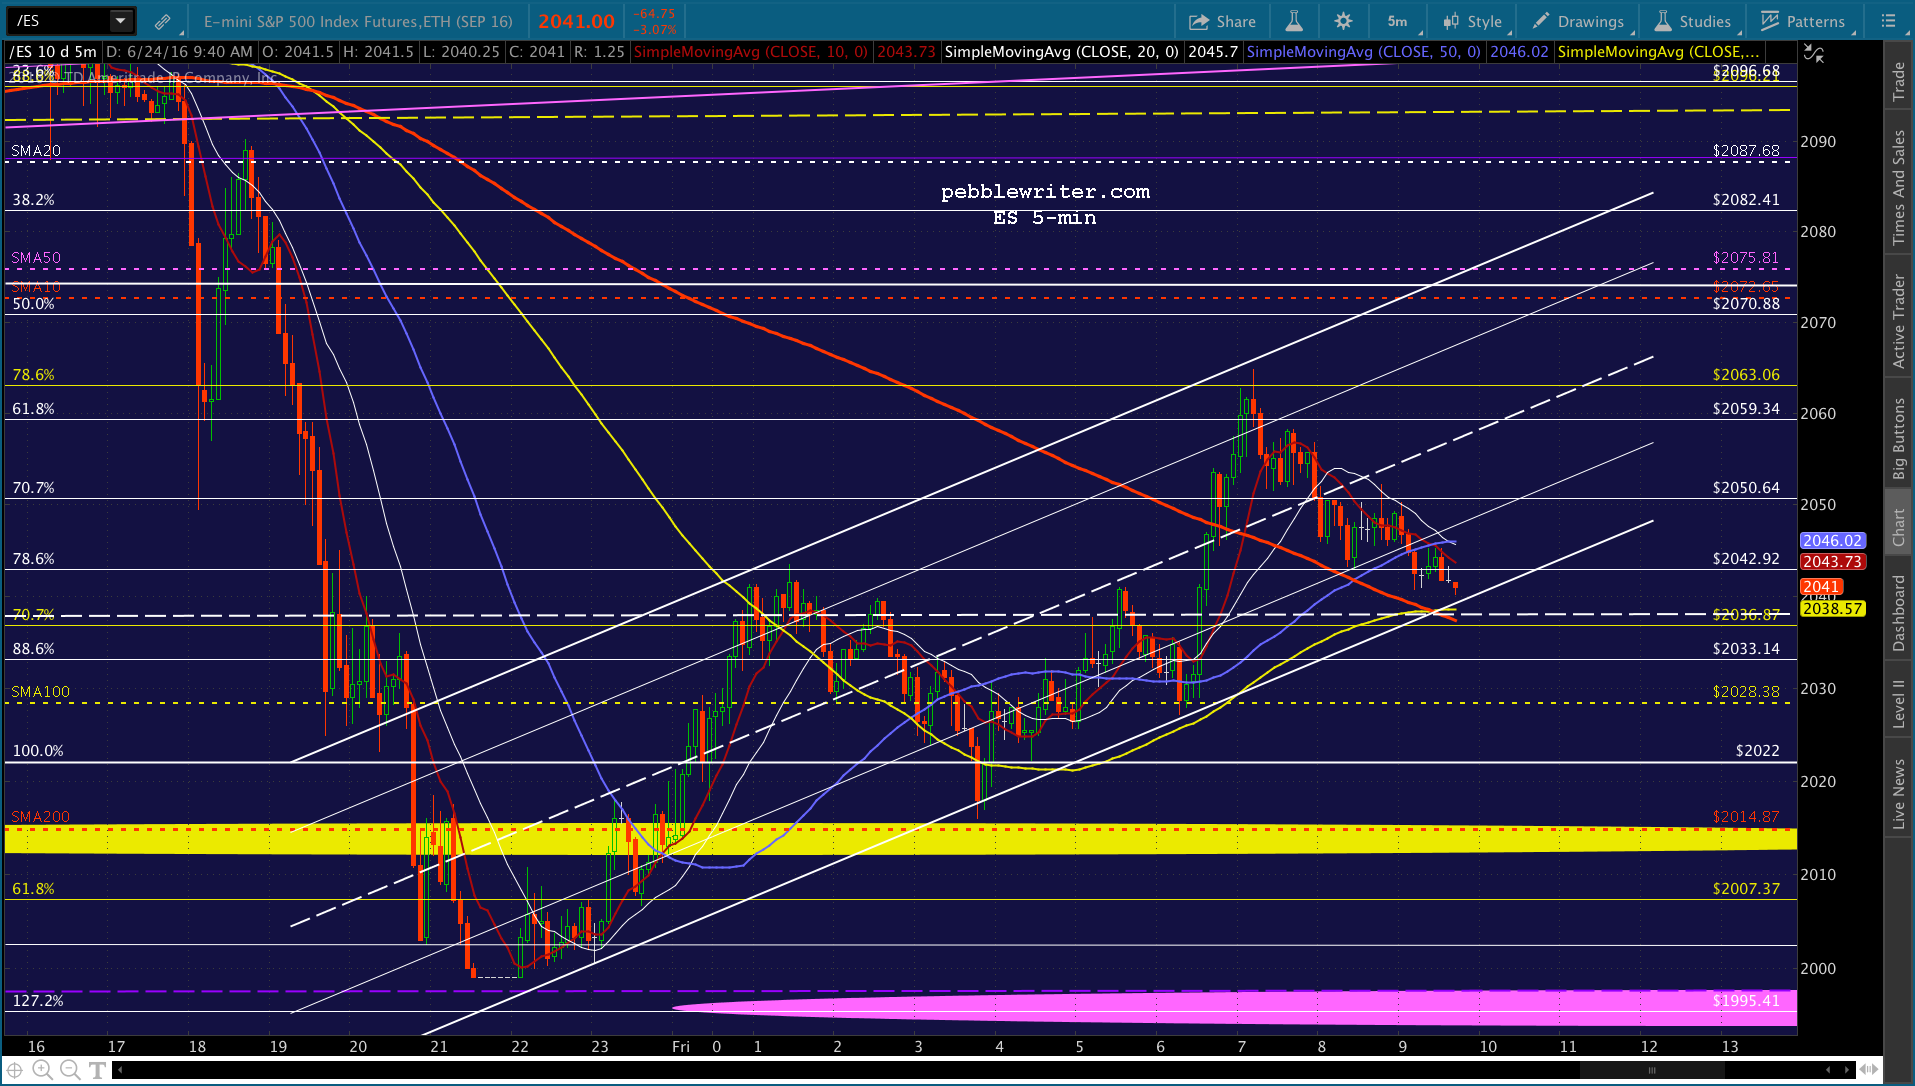
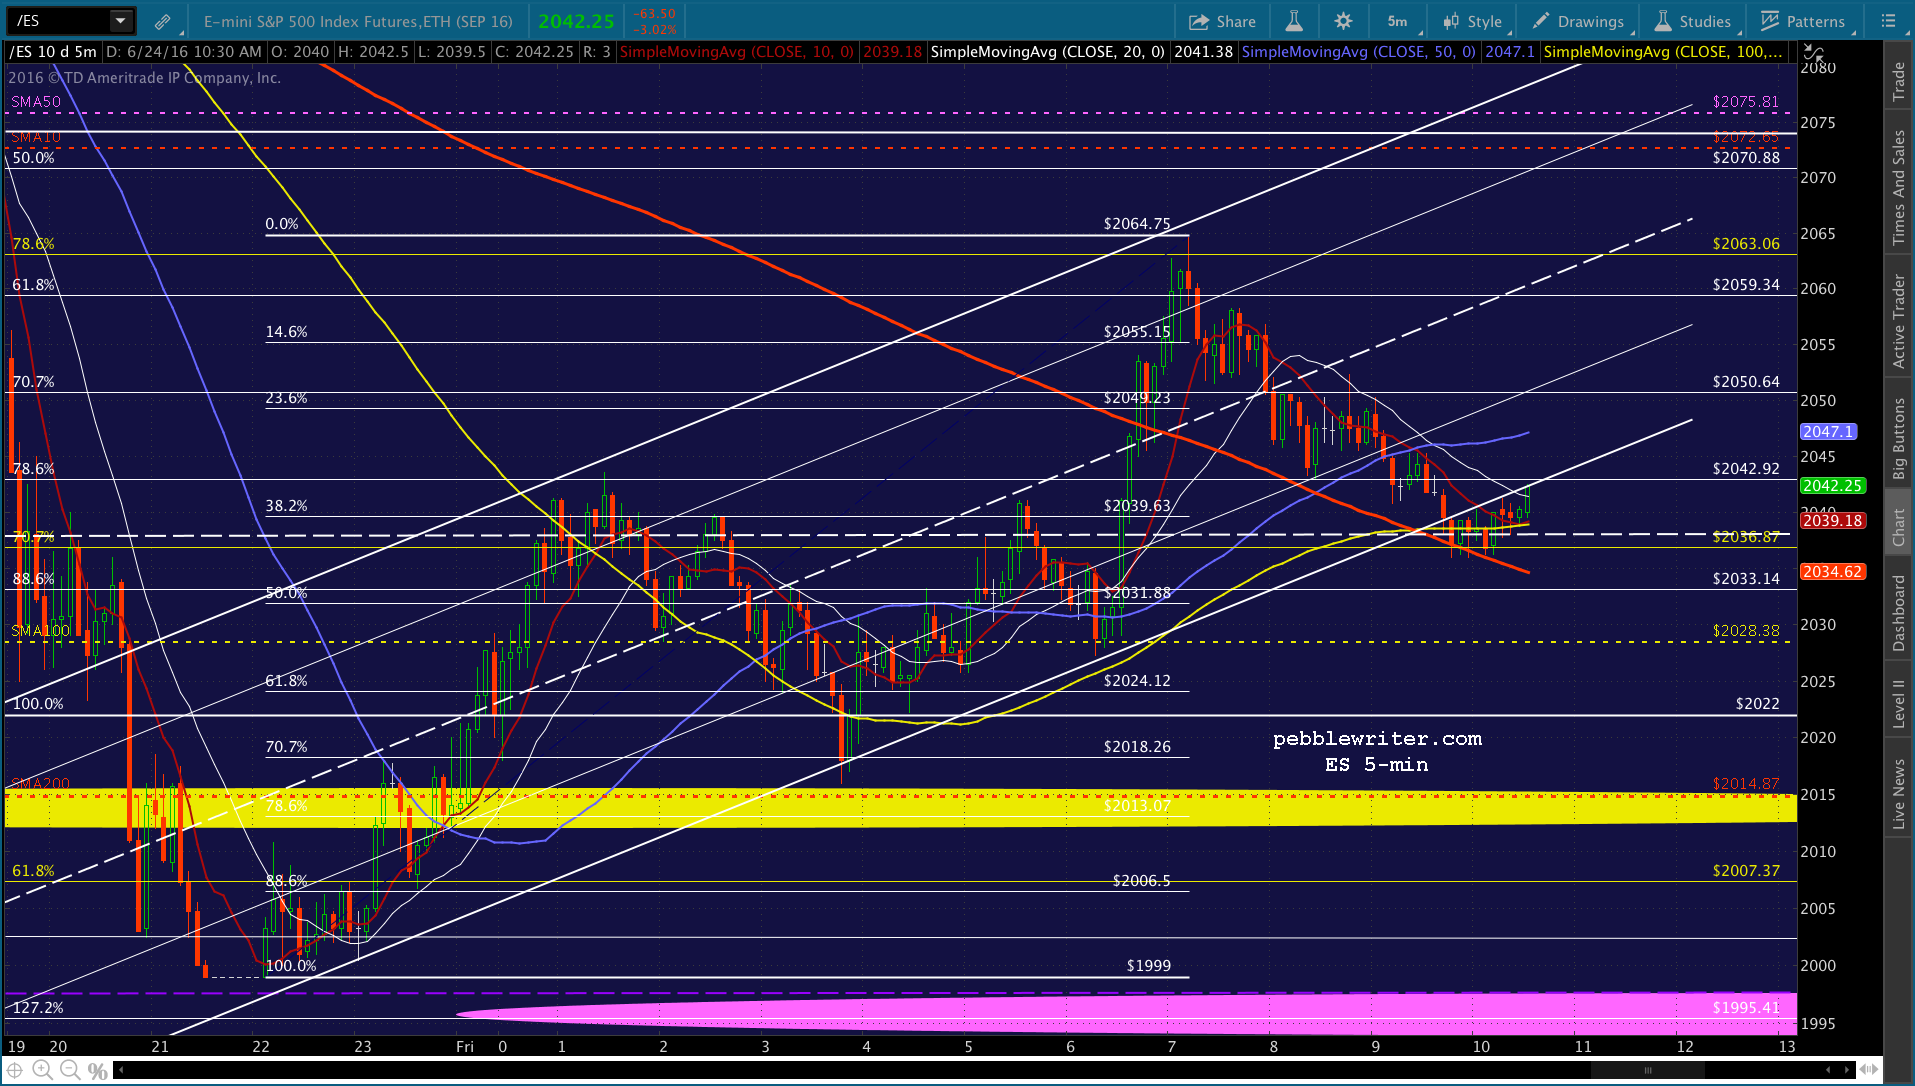
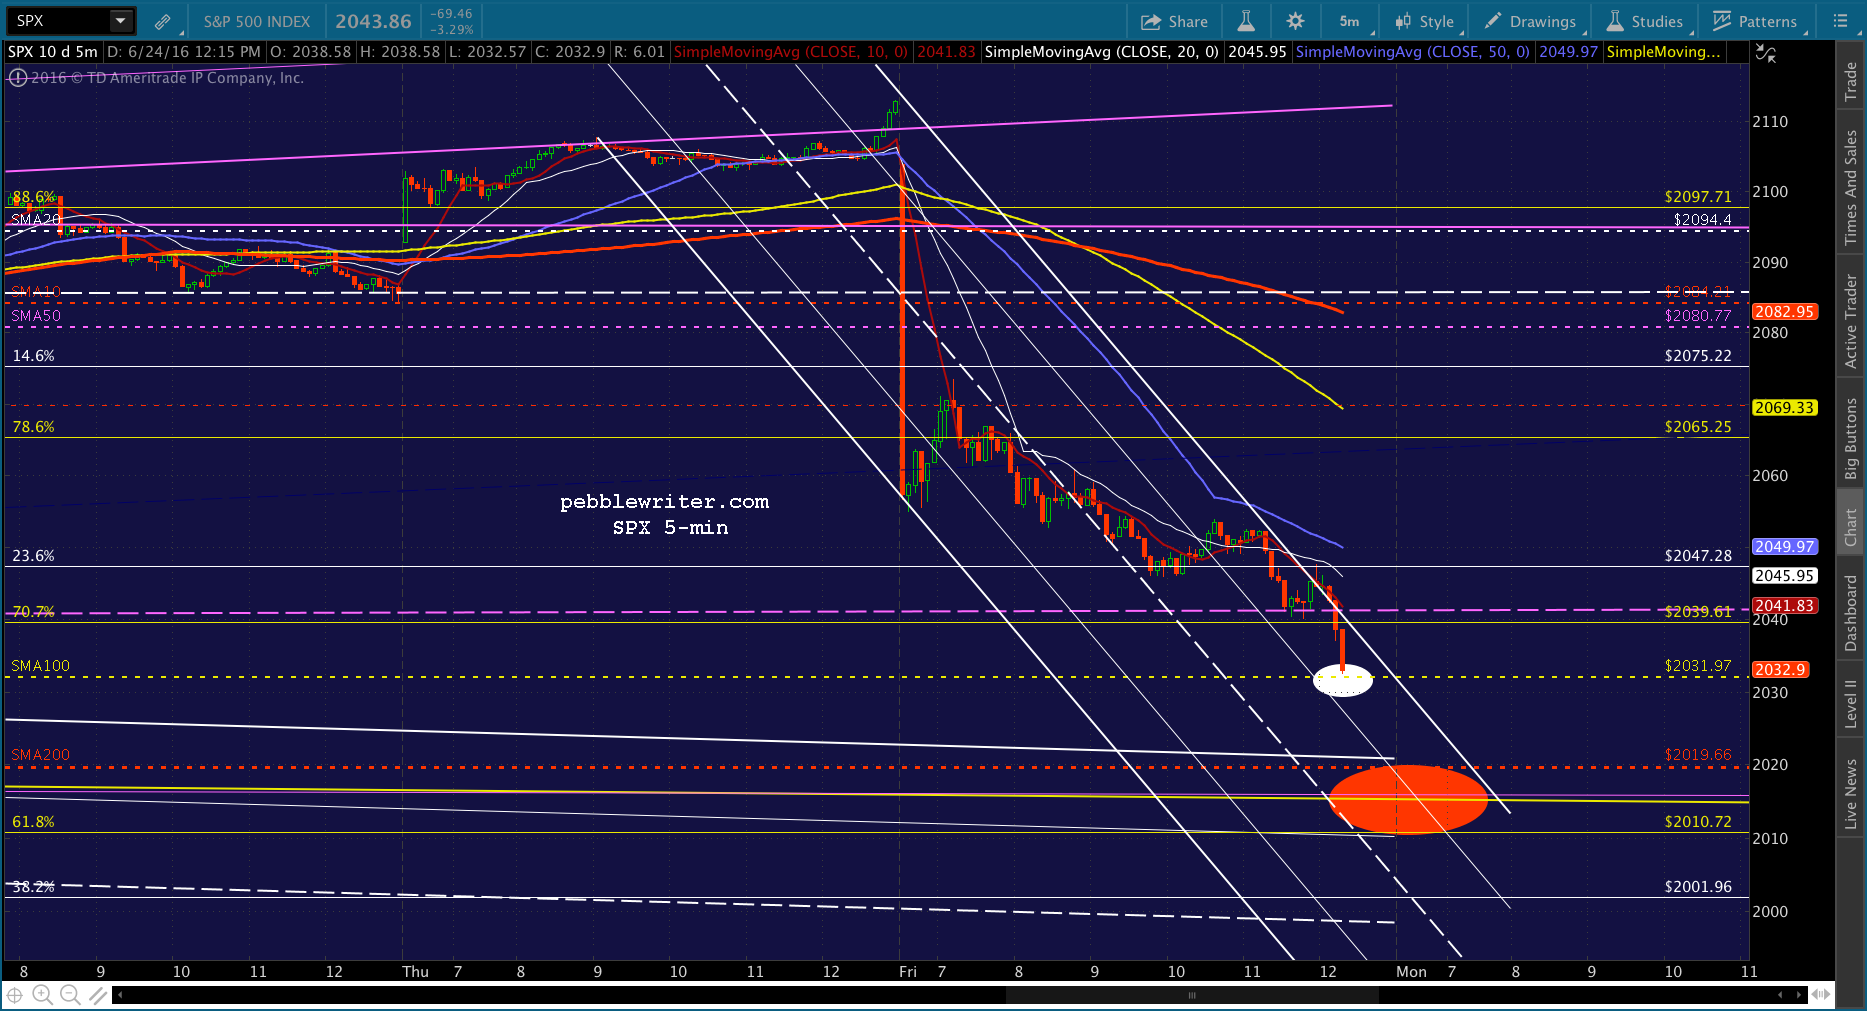
Coming up on a potential bounce point in ES. Watch your stops if you’re day trading.
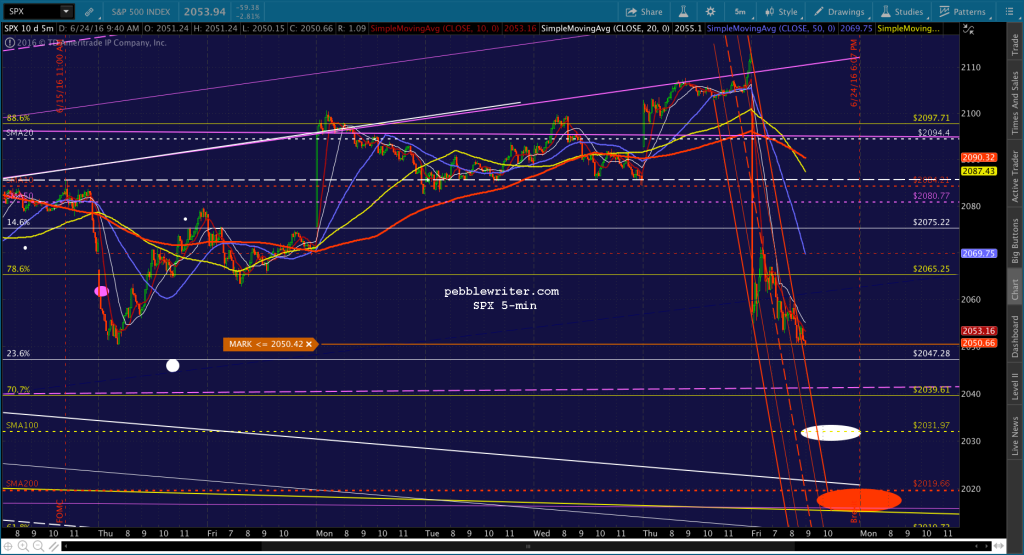

 UPDATE: 12:50 PM
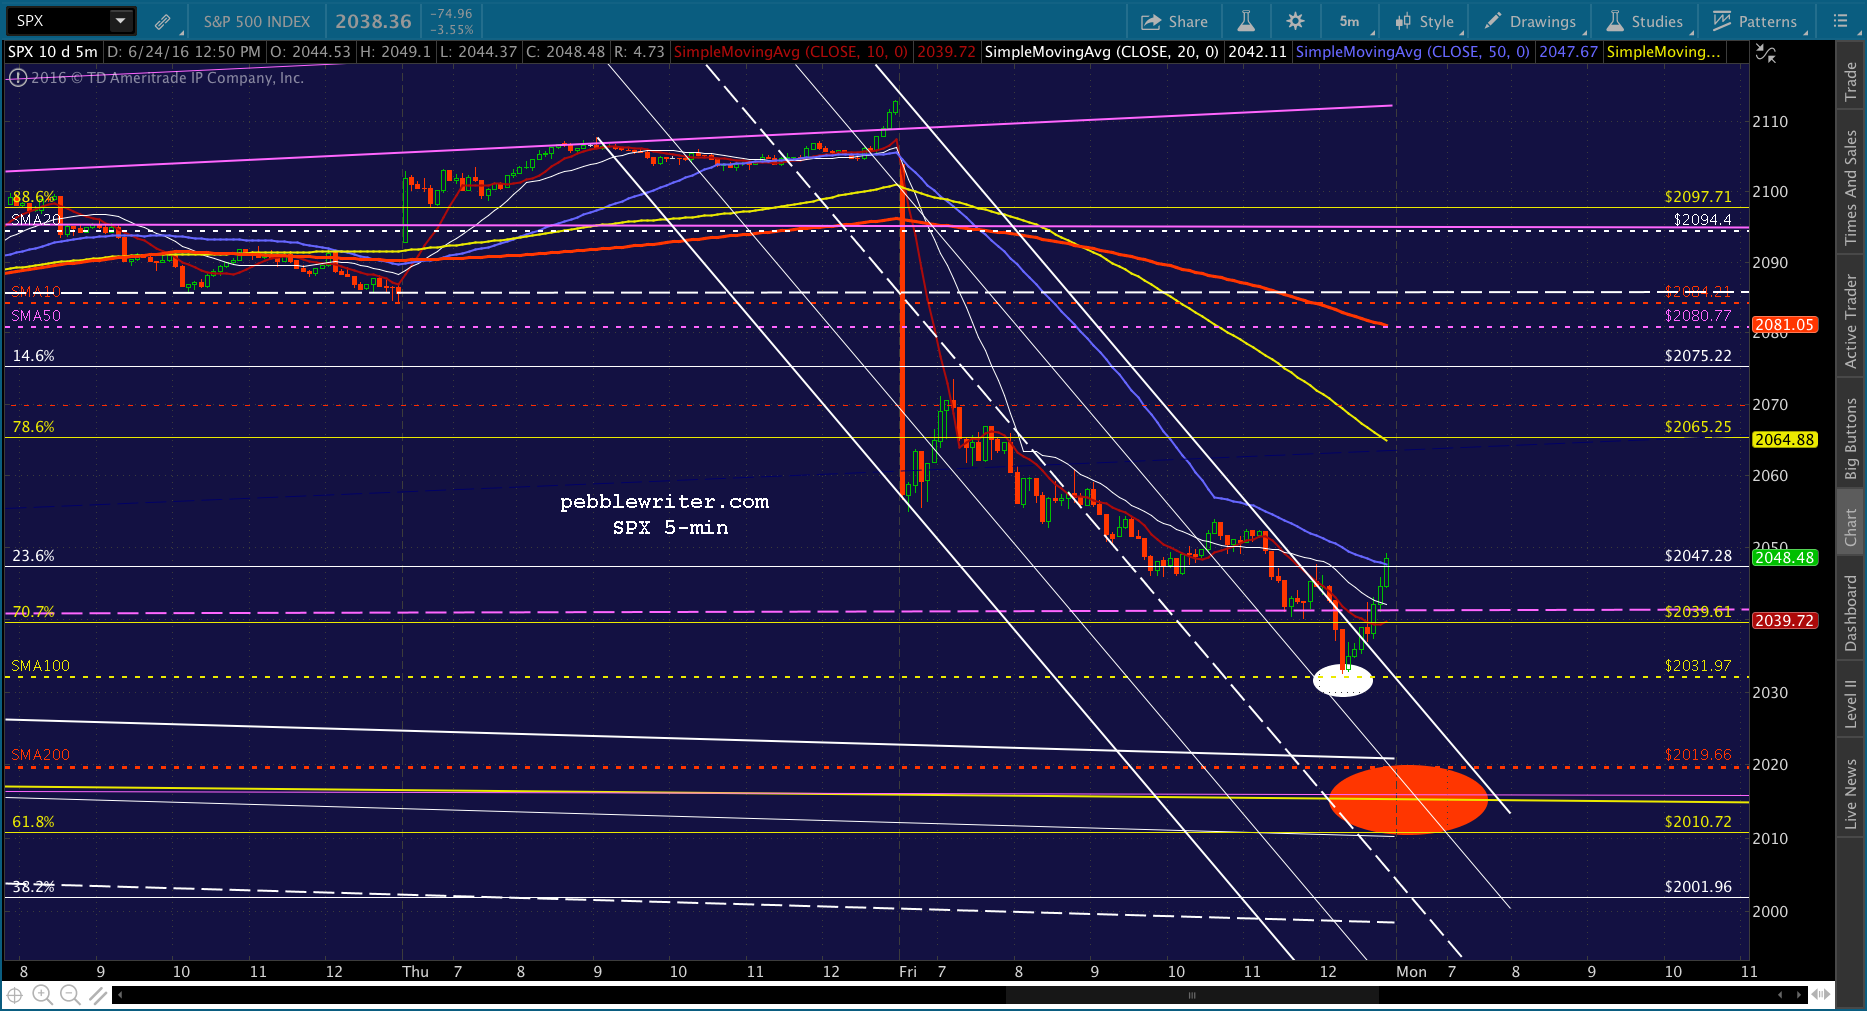
It should bounce here if it’s going to. SPX has no real support here, so it’s all on ES.
 UPDATE: 1:33 PM
Looks like they’re going for something a little more substantial. I think swing traders will be fine holding short, but short-timers might want to cover on any sustained push above the SMA5 20 at 2050.77.
 EURGBP certainly hasn’t broken down.
 Though CL is threatening higher.
 UPDATE: 1:53 PM
Looks like it’s setting up for a tag of the falling SMA5 50, probably around 2056. But, any sustained move through the SMA5 20 should be shorted. EURGBP could be heading for its SMA5 200 at .8077.


 UPDATE: 2:45 PM
CL’s channel broke down, which allowed SPX to slip below the SMA5 20.  But, things start to get interesting in here. There’s a channel midline coming into play just above the SMA100. It’s the dashed, purple line in the charts below. It’s the sort of thing that could cause a delay until Monday. On the other hand, we could still see an intraday push to the SMAs and a rebound to this level by the close.
We’ll see what happens when the SMA5 10 catches down to SPX. Traders will want to consider covering on any sustained move up through it. Swing traders will want to give it more leeway.

 Also, before I forget, remember that the red target at 2010-2020 is support — not only the SMA200 at 2019.66 and the .618 Fib at 2010.72, but that yellow channel top. TPTB have worked very hard to get SPX back over it. So, a close at the lows would have to at least be considered a reversible move. The usual caveats about holding over a weekend will definitely apply.
UPDATE: 3:20 PM
Tagging the SMA100 here. Could easily get a bounce, though USDJPY and CL aren’t suggesting it just yet. In fact, NKD dropped a bit below its rising white TL. Nervous types might want to take profits here and short again if it drops through. I’m 70:30 sure about lower lows — particularly as we come up on 3:34pm. But, as discussed, that could easily wait unitl Monday. UPDATE: 3:54 PM
SPX just tagged the SMA5 50 that never got tagged earlier. I think I’d take profits from this bounce and return to cash or, if you’re holding short over the weekend, go ahead and short here.
For new folks, I only advise holding short overnight or over a weekend only if you can (1) deal with a potential gap higher, (2) hedge your position, or (3) watch it very closely. Obviously, watching it while it’s closed on Saturday won’t help much, so that leaves the other two. If neither of those works for you, then you should take profits and enjoy a carefree weekend!
 I feel pretty good about the downside from here, but you never know when a central banker is going to panic and do something that sends SPX higher by 20-30 points overnight.
UPDATE: EOD
Nice weak close. I have to run a bunch of errands for the next hour or so, but will try to post more after I return.


 UPDATE: JUN 27 1:40 AM
Updating a few charts, here. Still looking for a tag of the SMA200 at 2020 in the morning. Odds of an overshoot are high, as the yellow channel top passes through about 2015.