The past two weeks has been a delicate balancing act between a declining USDJPY and rising CL. Several times, TPTB have had the opportunity to break stocks out of the falling white channel from last November, but have passed — choosing instead to merely keep SPX in a relatively tight trading range.
Just yesterday, CL came within 0.45 of its SMA200. Instead of dashing across the goal line, it punted — only to face an even closer call this morning. And, like yesterday, USDJPY is rallying in the preopening hour, but without really making any serious headway. Will this be the fourth day of no follow-through, or are stocks actually ready to backtest a little?
On Friday, SPX successfully spiked back above the neckline of a bearish H&S Pattern, then spent the rest of the day backtesting it. With USDJPY and CL both on the rise this morning, look for SPX to try once again to break out of the topping pattern it’s been in for the past week.
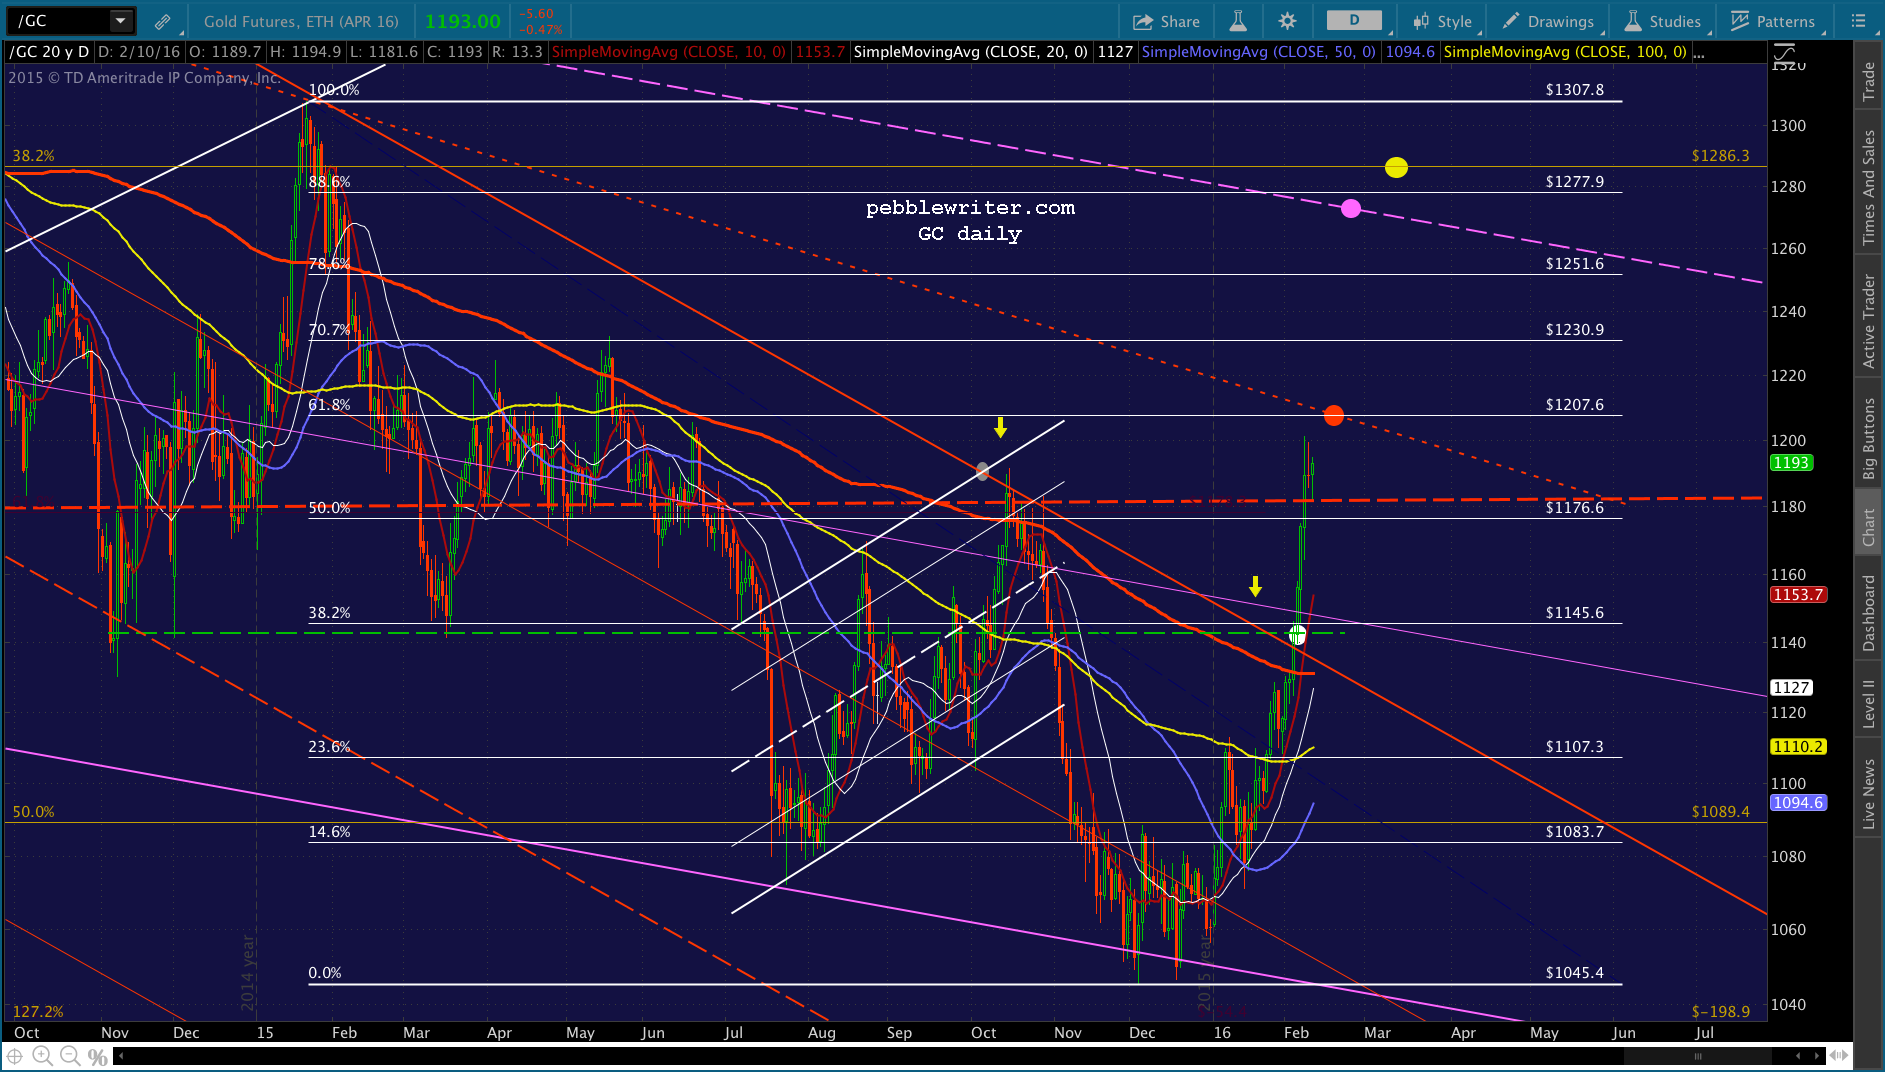
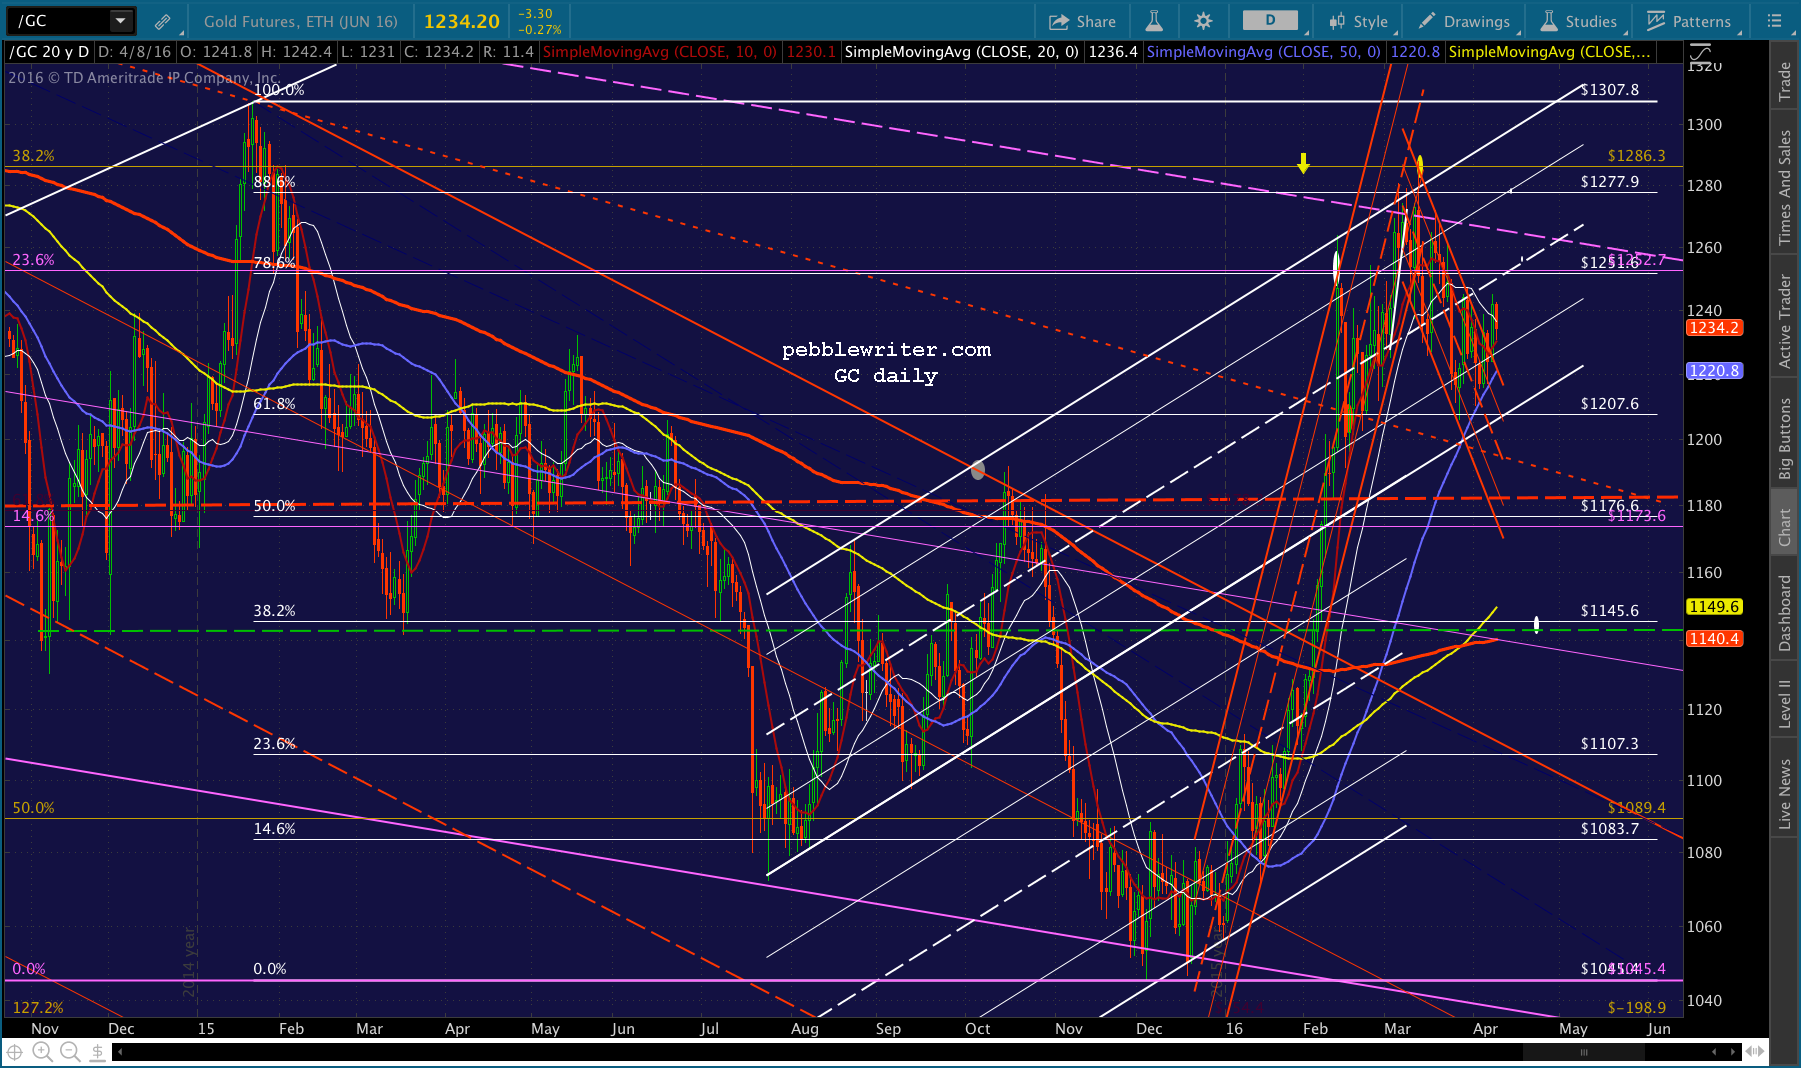
In our Mar 4 Update on Gold, we identified 1286 as an important turning point. It was one of two upside targets we had assigned on Feb 10, when gold closed at 1197.
Feb 10, 2016
GC topped out six days later at 1287.80, presenting a nice shorting opportunity. By the end of March, it had tumbled a respectable 6.3%.
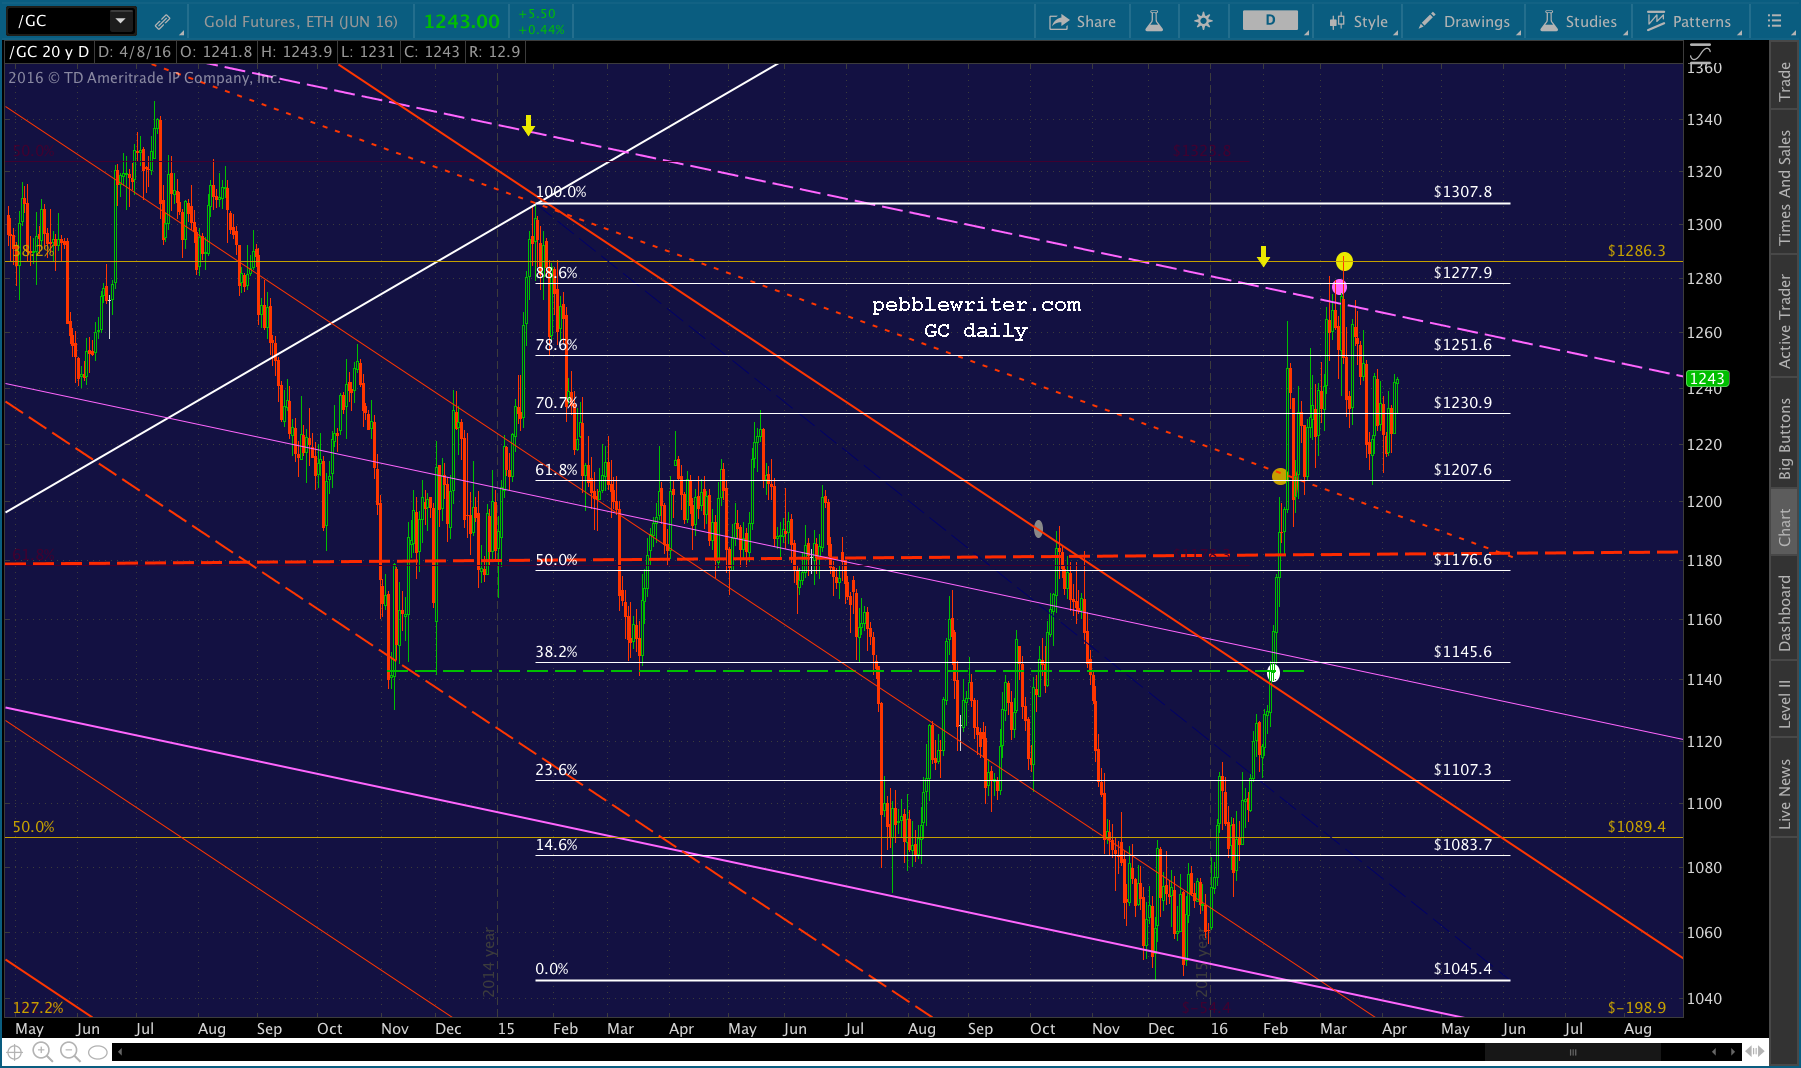
Apr 8, 2016
Since then, however, it has climbed steadily higher. It begs the question: is this just a bounce in the midst of the drop, or are higher prices in store?
continued for members…
This is currently one of those situations that’s too close to call. GC has retraced .886 of an .886 of a .500 of an .886. It is a hair’s breath from breaking out, even though it’s in the midst of a downturn.
I’ll explain. The white grid above is nestled within the red grid below which is nestled in the larger purple grid below. And, it’s the purple grid that matters most.
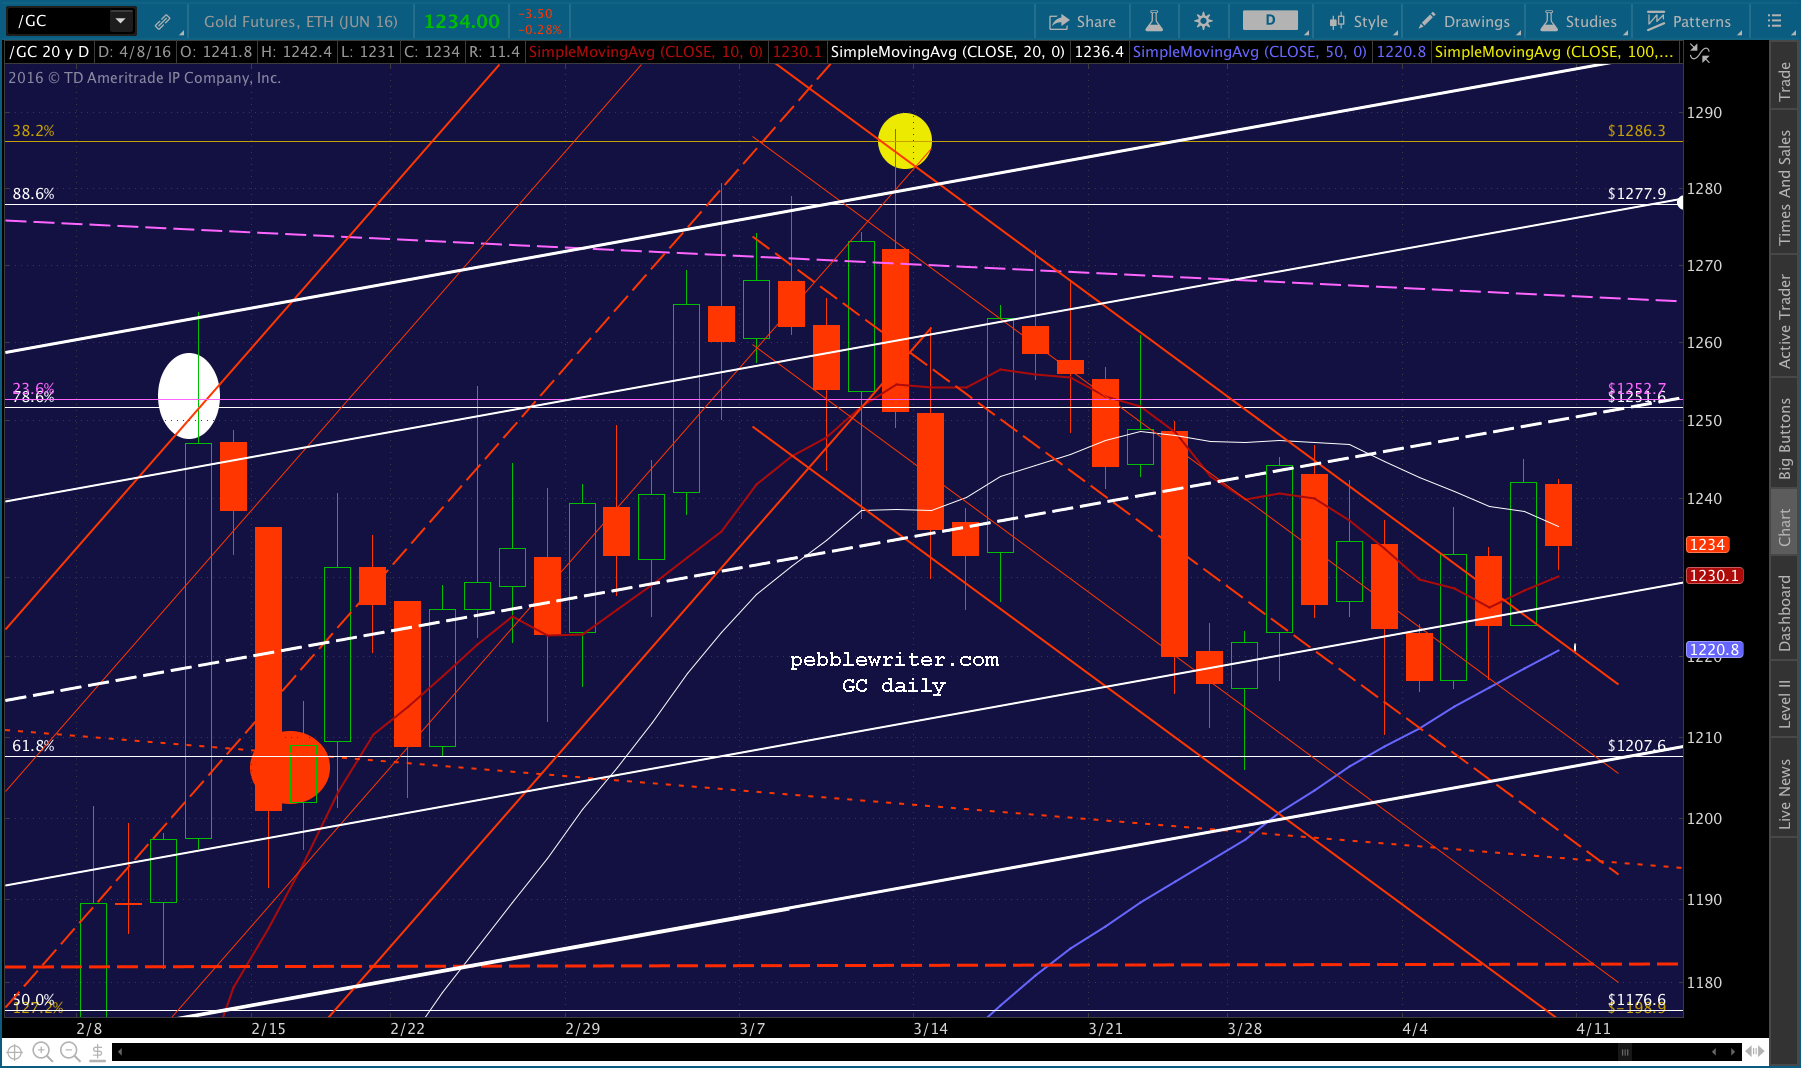
The drop from 1287 fell from the white .886 to the white .618. We draw the purple grid there, and note that the bounce to 1246 on Mar 30 represented a .500 retracement. Some corrective waves, that’s all you get.
But, the subsequent drop (to a higher low) sets up a potential Bat Pattern to the purple .886 at 1278.50 — also a reasonable bounce for a corrective wave.
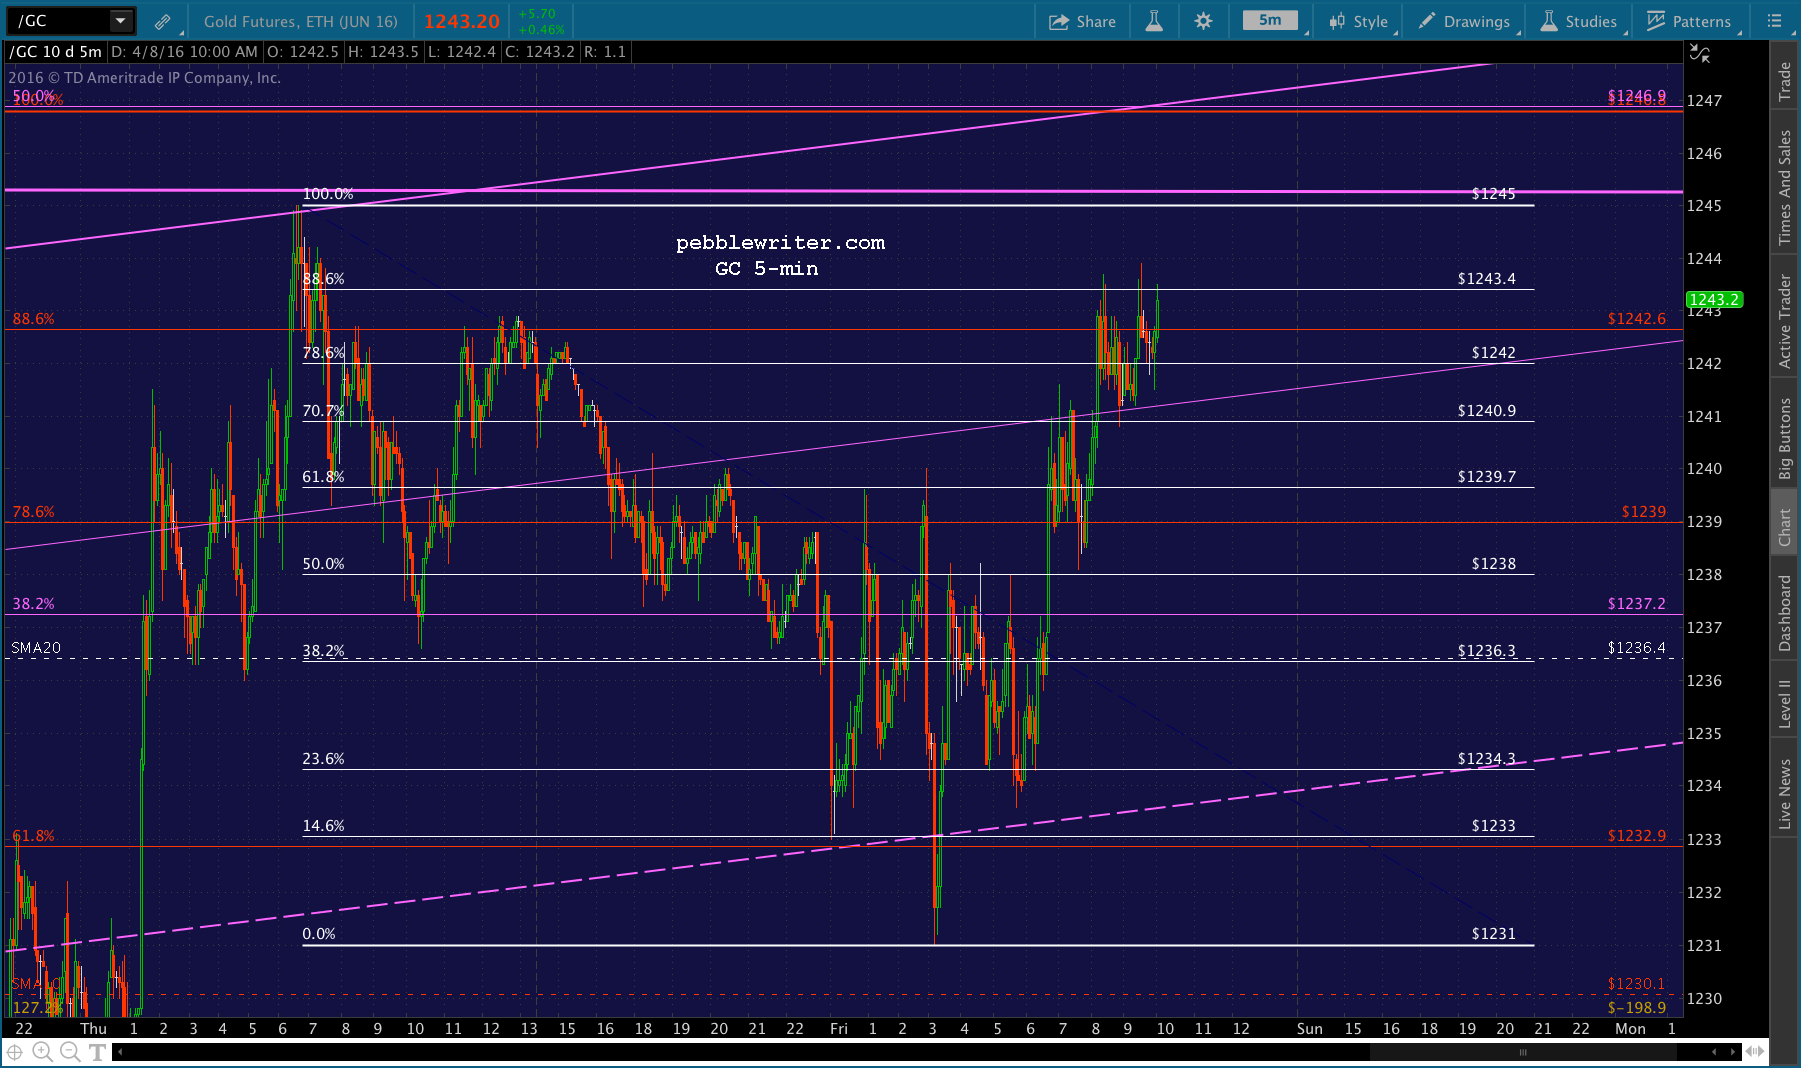
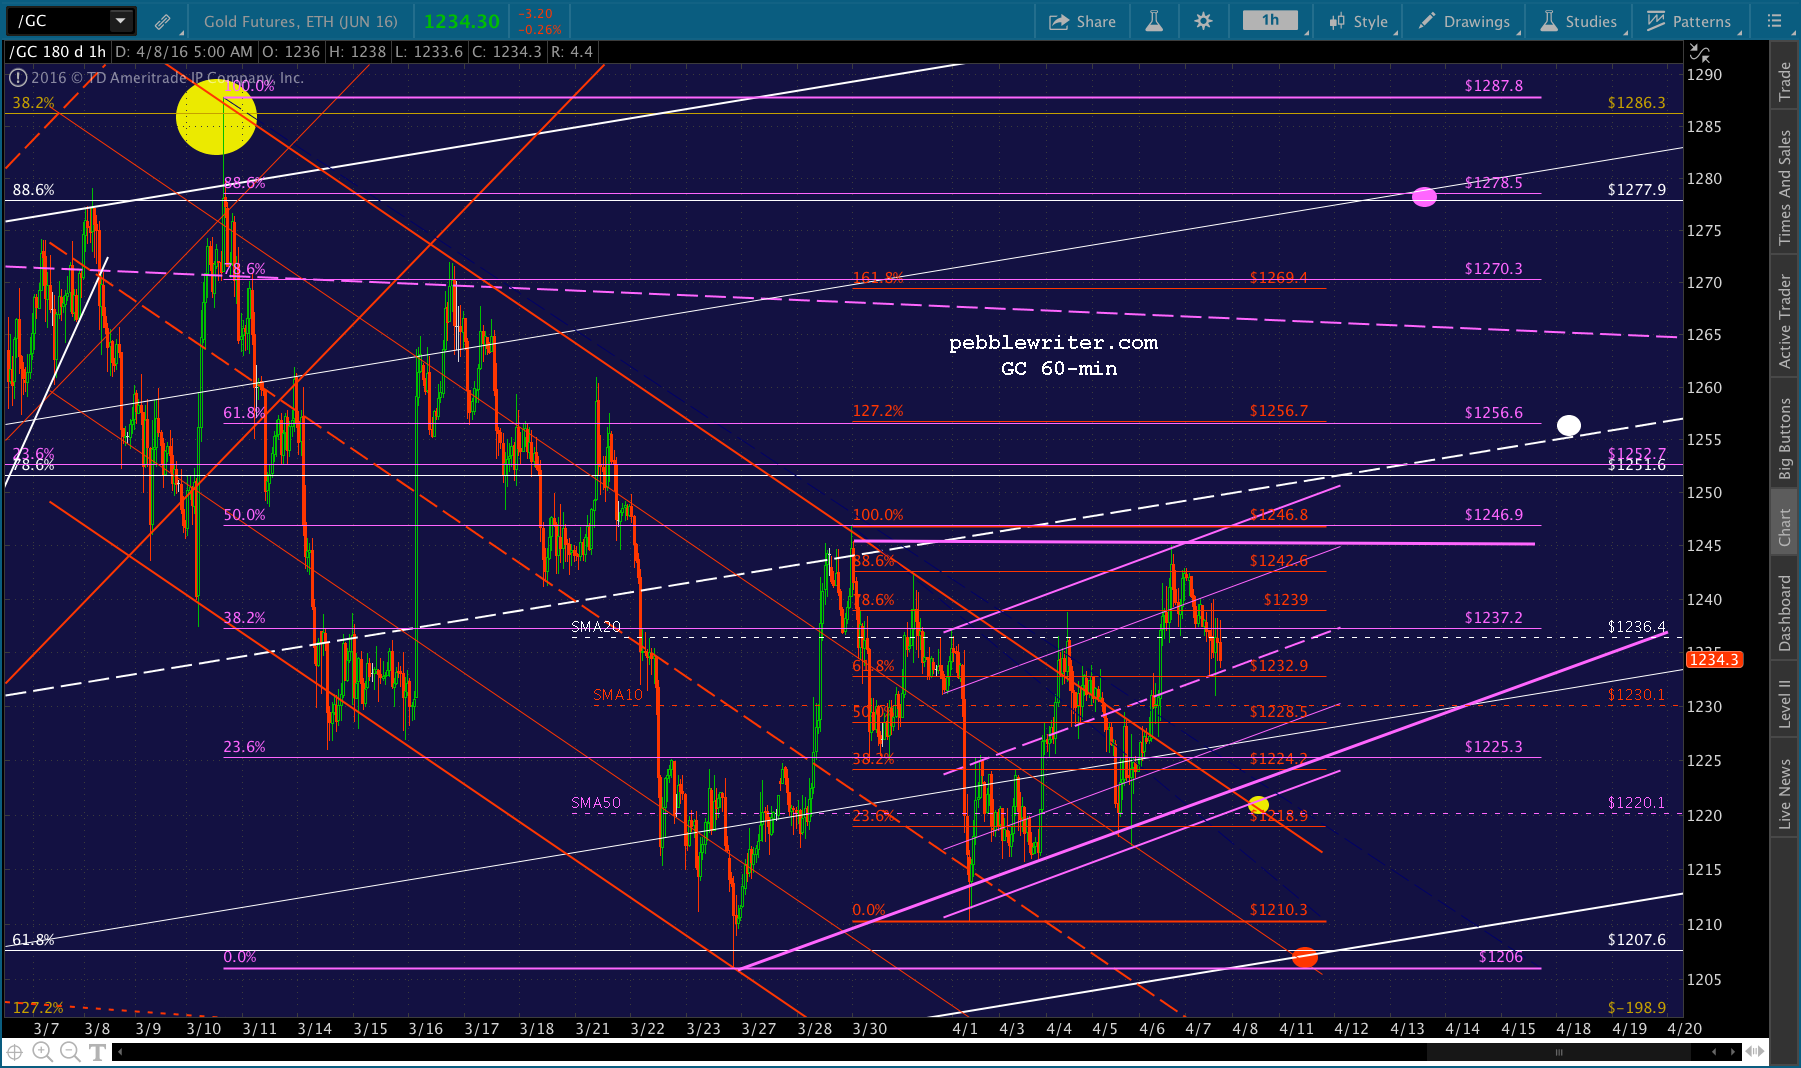
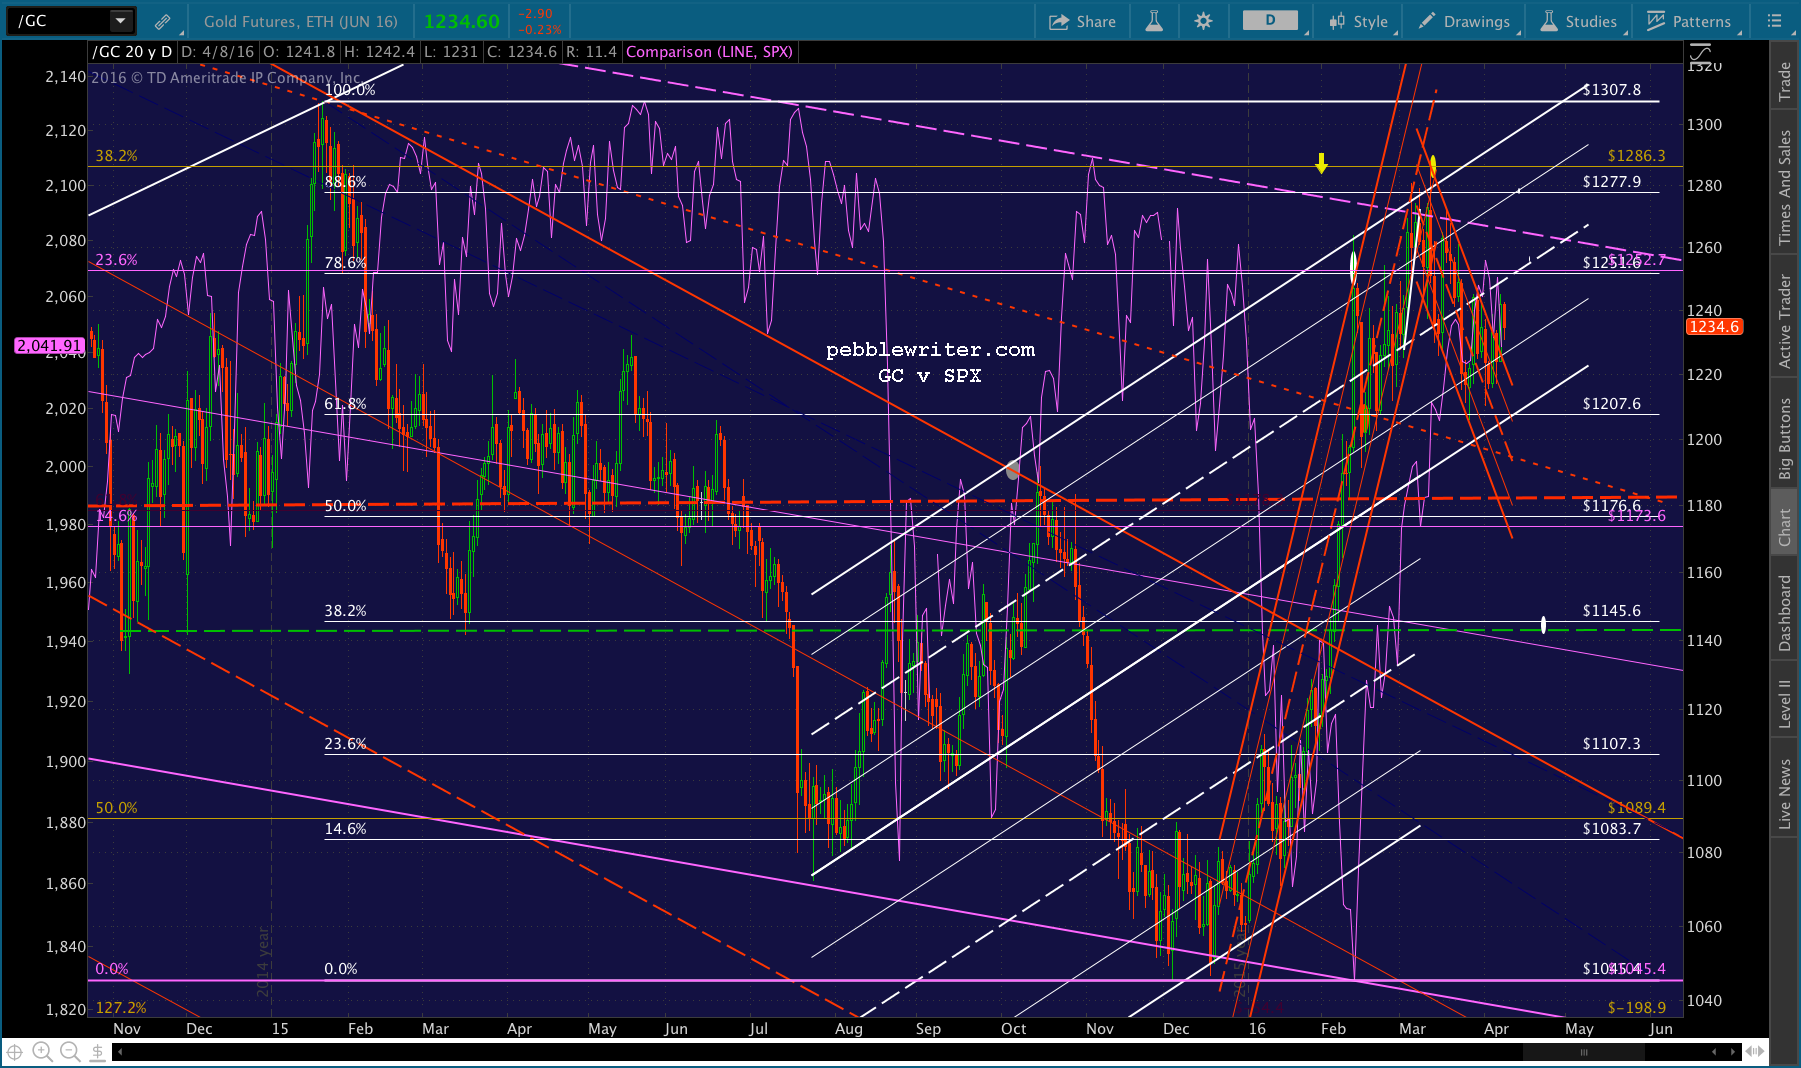
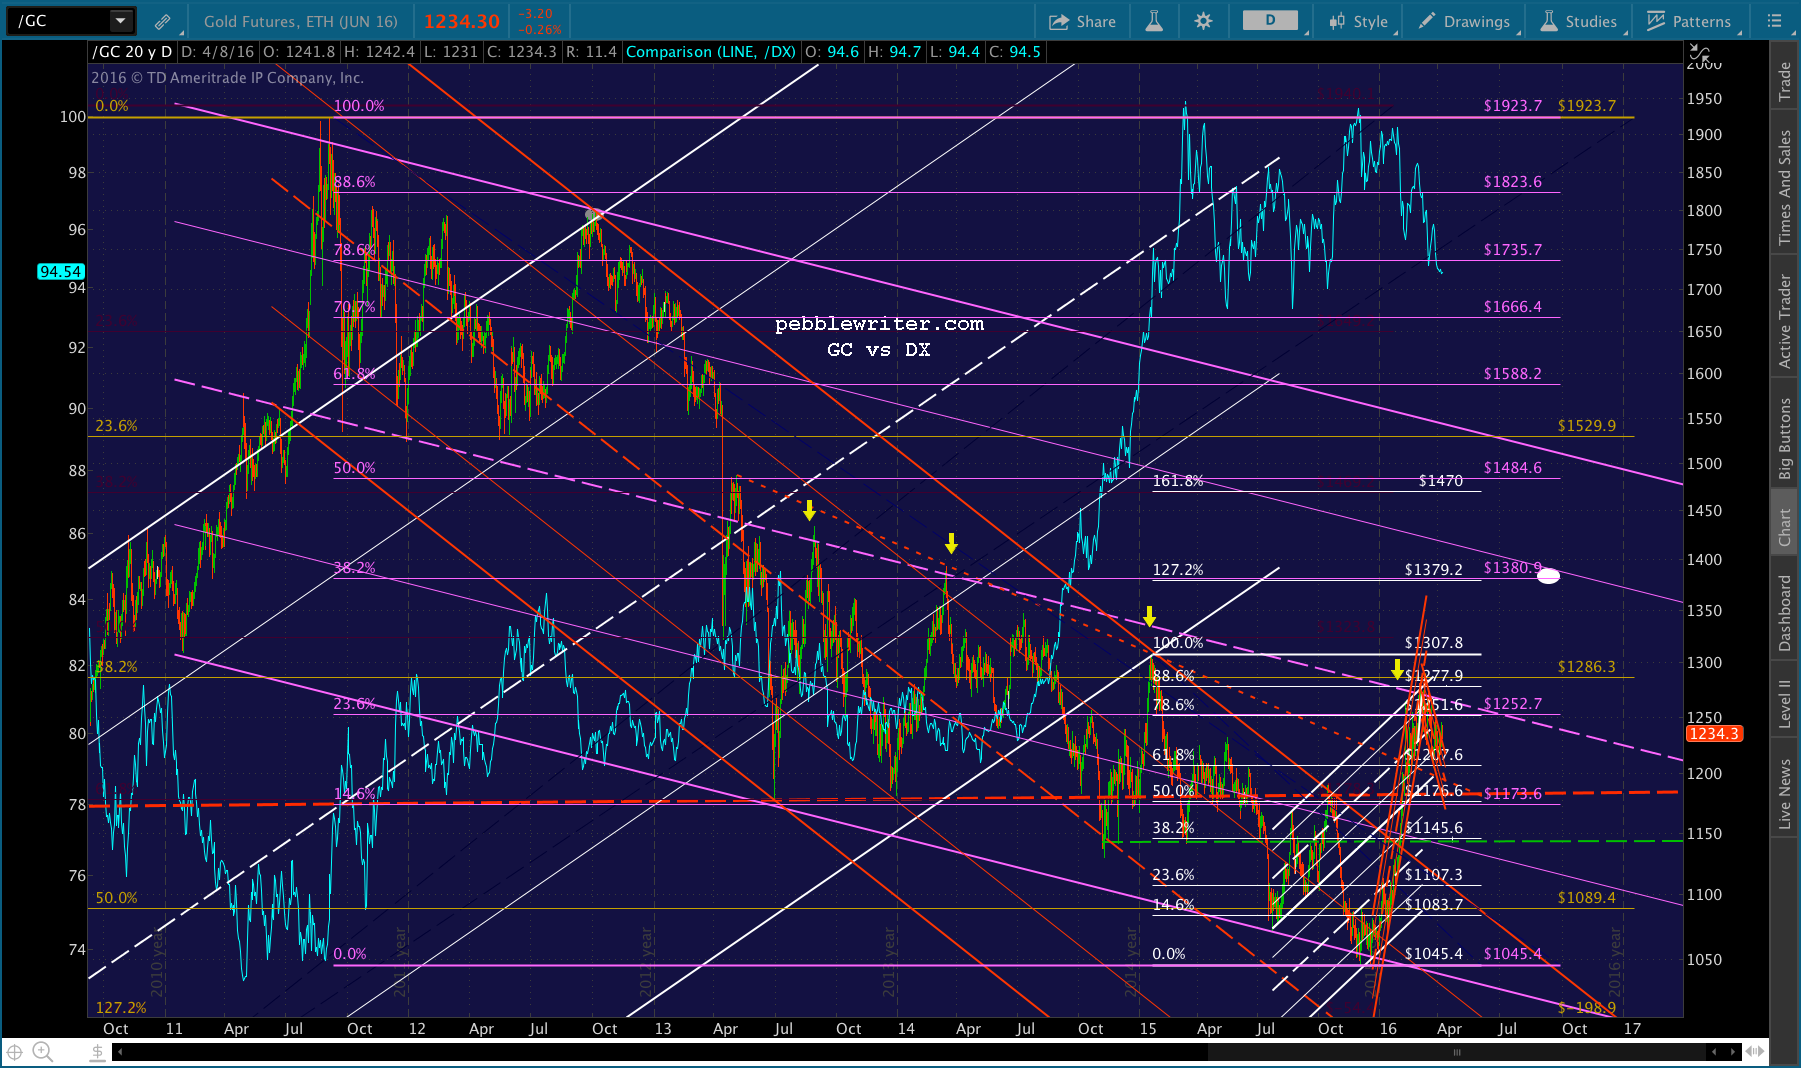
GC frequently trades in the same direction of stocks — the “all one market” theory. But, lately, it’s maintained an inverse relationship — a result of growing fear. So, it’s not surprising that it’s in the same situation as SPX — on the brink of a breakout or breakdown.If it breaks above 1246, then the purple .618 at 1257 is a gimme. From there, we have potential resistance at 1270, which is also about where the purple midline currently resides.If it breaks above the purple midline, then 1379-1380 is the next logical target, perhaps in Sep/Oct. So far, it’s been doing a nice job of rising the rising moving averages, with the SMA50 around 1220 coming into play the last few days.Note that the SMA50 would also represent a backtest of the red channel it recently broke out of. If that doesn’t hold, then the white channel bottom around 1207 makes sense.
Is it any surprise that CL and USDJPY have rallied sharply in response to yesterday’s mini-meltdown in stocks? After ES and SPX both completed H&S Patterns that might have sent them down to backtest (horrors!) their SMA200s, CL is up 7.3% and USDJPY 1.3% off yesterday’s lows.
News or fundamentals? Nope. Just talk…aimed at averting a negative outcome for equities. The BoJ is talking more QQE or even more negative rates since they’ve both been so successful (not!) in turning around the Japanese economy. And, oil? What can I say? If there’s a limit to this manipulation insanity, we haven’t found it yet.
Depending on your affinity for conspiracy theories, the BoJ has either failed to keep a lid on the value of the yen, or has allowed it to appreciate to the point where it now compensates for the 60% increase in the cost of oil since Feb 11. Regular readers know where I stand.
Regardless, USDJPY’s flat red channel from Nov 2014 broke down long ago. The falling white channel from December 2014 has broken down. And, the rising purple channel from 2011 is now officially dead.
It hasn’t mattered all that much to the “market” yet, as CL has taken over as the most important driver of day to day equity ramps.But, at some point, the other 3-4 trillion in equity investments that rode the yen carry trade up from 2011, money that might not be tied in to the CL carry trade — or, might have some well-placed reservations about its long-term viability — are going to wonder if USDJPY is well and truly dead.
Not to worry. I believe the BoJ has a plan. And, since all their other plans are working out so well, what could go wrong?
Yesterday marked an epic battle between algos driven by CL and those driven by USDJPY. CL won. As USDJPY melted down to lows not seen since Halloween 2014, SPX refused to budge — not until CL announced it wouldn’t bounce any higher.
We won’t mourn the impending death of the yen carry trade, as we’ve seen too many resurrections over the past year to assume it’s truly toast. Besides, this latest turn of events gives it the freedom it needs to reach the next lower target on our list.
But, we’ll focus more on CL, and how reversals like yesterday’s can impact intraday swings. Hint: there will be more, and they will be even wilder.
Today is the last day of our membership promotion. Including a $100 rebate, Annual Memberships are $700 off. To sign up now, CLICK HERE.
* * * * *
So much attention has been focused on CL, lately, that USDJPY’s oscillations have gone largely unnoticed, until last night. It reached levels last night not seen since Oct 31, 2014 — the day that Kuroda surprised the markets with a massive expansion of QQE (days after promising it wouldn’t happen.)
USDJPY spiked 3.26 higher that day, and 12.64 over the next 5 weeks. Thanks to the wonders of the yen carry trade [what’s this?], SPX rallied to new highs, tacking on 220 points from its October lows.In other words, from 110 to 125 and back again. SPX had reached the same level as of February when CL’s 63% spike fed a different set of algos. But, CL topped out a couple of weeks ago.
The trickiest part of harmonic chart is the area between the .786/.886 Fib retracements and a former high. Even in unrigged markets, this area could mark anything from a prelude to new highs to a slight overshoot of a corrective wave.
SPX has reached this, our upside target, with little trouble, largely on the back on CL’s 63% spike since Feb 11. Now that we’re here, it makes sense to be a little more cautious. The manipulation that has been the hallmark of the past six weeks is about to get much worse.
Originally posted privately for a retainer client: Apr 3, 2016
Silver looks pretty dicey as a short to me. Here’s my take. There are two possible major channels that are quite bearish using log scale……and a nice, supportive TL using arithmetic scale.Either way you look at it, SI has tested and reversed off its white .786 at 13.817. It hasn’t broken out of the falling purple channel yet……but, it’s working on a rising white channel that’s aiming at a breakout… …and, has tested and bounced off its SMA200 at the bottom of that channel. Even if the white channel and SMA200 broke down, you’ve got support at 14.623 – only 2 1/2% below current levels. Not worth the aggravation.
This is not a great setup for a short, and I wouldn’t advise pursuing one at this time.
Bottom line, there are much more interesting setups to pursue, such as if/when USDJPY or CL reverses higher the next time in order to save the day.
When we last examined USDJPY, it was spurting up above the bottom of the broken purple channel which had guided its rise from 75 in 2011. It looked like USDJPY was going to reassert itself as the principle driver of stock prices. But, it topped out 4 sessions later at a lower high that reinforced a falling channel that’s almost two months old.


 Will this be the fourth day of no follow-through, or are stocks actually ready to backtest a little?