Author: pebblewriter

  • Live by the Algo…

    When you live by the algo, you have to be prepared to die by the algo.  With only 10% of daily equity volume being driven by fundamental, discretionary, carbon-based investors, 90% of the volume is subject to the whims of the silicon-based traders.

    This morning, we have the S&P 500 trying very hard to hold 2500, but VIX and the JPY are both creeping higher due to geopolitical risks (a hydrogen bomb, now?)  There’s only one tool left in the algo shed: CL.  And, unless it settles back down tout de suite we’ll see September CPI pop above 2% — not exactly on the central planners’ play list.

    So, what’s more important — holding 2500 or averting inflationary headlines?

    continued for members(more…)

  • Say It Isn’t So!

    When the Fed, which employs hundreds of economists and PhD’s says they don’t understand inflation, is there any hope left for humanity?

    Come on, guys.  It’s pretty straightforward…wouldn’t you say?  On the one hand, there’s the fairly significant $14 trillion in financial assets you’ve bought up over the past few years.

    Then, there’s basic commodities like oil and gas which are bid up to support stocks (but, have nasty side effects.)

    Bottom line, there are plenty of charts that could help explain inflation if the Fed is really stumped. Or, maybe it’s just that Central Bankers, chock full of ex-Goldmanites, are more worried about charts like this one.continued for members(more…)

  • Update on Gold: Sep 20, 2017

    I consider gold a good indicator of the inflation fever out there.  Note that it recently broke down from its latest rising channel (white.)  So, it would be easy to say it’s done, that there’s little chance of it reaching 1380.  Readers will recall I suggested bowing out at 1348.60 [the yellow arrow, see: Sep 6 Update on Gold.]

    Personally, I’d close or trim back my long position here, or at least set some stops at this level. Every tick higher from here brings with it the risk of a sudden dump — one that need not be precipitated by news or events.

    GC punched above 1348.60 for all of two days before succumbing.  Its slide, since then, has correlated with that of the US Dollar — which understandably has gold traders’ knickers in a bunch.  With the Fed’s inflation outlook due out shortly, does it still have potential to go higher?

    continued for members(more…)

  • FOMC Day: Sep 20, 2017

    Welcome to another FOMC day.  If you read yesterday’s post, there is absolutely nothing new to report today.  SPX, DJIA, COMP, NDX and NYA are all at or near all-time highs, while XLF and RUT are at important resistance.

    As usual, there has been much speculation regarding the Fed’s future plans.  As usual, the FOMC will do its very best to not upset the markets.  What does this mean?

    While they would love to see a steeper yield curve, more robust growth and higher inflation, everyone knows we can’t afford higher rates — hence the US dollar’s steady decline and an unwritten policy to keep inflation near, but no higher than, 2%.

    Since the dollar has been in a funk, the yen carry trade hasn’t worked so well of late.  And, since higher oil and gas prices could push CPI above 2%, that particular avenue has been of limited use.  Fortunately for bulls, hammering VIX has done an excellent job of driving algorithms and the 90% of share volume that they steer.

    Chances are, today’s the day we find out whether or not our assumptions regarding interest rates, inflation, currencies and equity prices make any sense.

    continued for members... (more…)

  • Update on RUT: Sep 19, 2017

    In our last update on RUT [see: Feb 13 Update] I noted that RUT had returned to test an important Fib level at 1392 and the top of a long-term channel after a very modest setback the first time around a few months earlier.  The path forward was a little murky, so I laid out both sides of the ledger.

    Head fake, or a sign of weakness? The next few days are very important, as RUT has an opportunity to break above the yellow channel that dates back over 20 years… At this point, support is up to 1330 and, after that, at 1296.  If it can break 1400, it will leave the rising yellow channel in the rear view and won’t face overhead resistance until the purple 2.24 at 1493 and the 1.618 at 1514.09. The latest IH&S targets 1444, which is in the middle of nowhere.

    As it turns out, I was fairly close on the targets — RUT found support at 1335 and rallied as high as 1452 — but, things aren’t all that much clearer.

    RUT pushed above 1392 the very next day, but couldn’t make any headway.  Thirteen sessions later, it was back below 1392, tumbling 5.6% to make new lows.It mounted another effort in late April.  Again, the rally failed and it fell 5.2% (but, to higher lows.)  More failed rallies followed in June and July, with the last producing a 7% decline.  Every time RUT rallied, it produced a higher high.  And, every time it slid, it produced a higher low — except the last.  The Aug 18 low was slightly lower than the May 18 low.

    It might not matter, but that decline also represented a breakdown of the rising white channel which had been guiding prices higher since Feb 11, 2016 (yep, the day oil bottomed) and also produced a rare drop through the SMA200.

    The SMA200 was since recovered, but RUT has now reached a key Fib retracement of the latest drop and is…drum roll please…back at the top of the rising yellow channel.  At the risk of repeating myself: “head fake, or a sign of weakness?”

    continued for members(more…)

  • The Big Picture: Sep 19, 2017

    SPX came within 2 points of our upside target yesterday in a VIX-inspired meltup that was focused on getting and keeping the index above the 2500 mark.  While VIX has already staged obvious breakdowns of its rising yellow TL and rising purple channel, it has managed to keep stocks on the rise by simply drifting… Lower. Every. Day.

    With ES up only 1.75 at present, it appears we’re not going to be presented with a reason to reverse just yet.

    continued for members(more…)

  • A Shift in Our Focus

    When I first started pebblewriter.com over six years ago bad news was bad news, dips sometimes developed into routs, and there was good money to be made from directional bets.  We profited handsomely from shorting in July 2011, September 2012, May 2015, and November 2015.

    But, central bankers have become increasingly involved in propping up stocks.  As a result of their heavy intervention, “buy the f-ing dip” has gone from a laugh line to a legitimate investment strategy.

    Early on, QE, QQE and APP were used to prop equities up — but at considerable cost and with limited ability to fine tune.  Between 2011-2015, the yen carry trade provided most of the impetus but entailed significant currency-related side effects.  In 2016, a sharp recovery in oil prices fueled algorithms but drove inflation higher.  And, post-Brexit and the US election, VIX manipulation has become a force to be reckoned with.

    Six months ago [see: Why the Trump Rally is a Fraud] I noted that manipulation had become so ubiquitous that it’s become difficult to profit from directional trades.  I needn’t remind members that we frequently had 5-10 false alarms before a plunge was finally allowed to occur — if it was at all.

    I’ve mentioned to many clients that it’s become easier to trade USDJPY, CL and VIX themselves rather than equities. As tools, their individual actions are much easier to forecast than their combined effects.

    It’s nearly impossible, for example, to know when VIX will suddenly be pounded into the sand.  It is much easier, however, to predict when the BoJ will crush the yen, oil will ignore inventory data and spike higher, the US dollar will plunge in response to Fed inaction, and gold will react to the latest machinations.

    Last week, in The Case for Active Trading, I presented the results from our oil forecasts.  Not that this will ever be repeated, but our 36 calls since Oct 2014 averaged 16%.  If one were to have participated in each (averaging one trade/month) and rolled their profits from each trade into the next (compounding), an investment of $100 would have grown to roughly $23,000.

    We’ve also had very good results in gold.  We’ve been much less active, with only eight calls since Dec 2015. Even so, as of our most recent Update on Gold: Sep 6, we have averaged 9.4% per call, meaning $100 would have grown to $204 with very little trading.

    I’ve yet to tally the results, but I believe our track record in USDJPY, DX and RB has been comparable.  Why, then, spend a lot of time trying to outwit the algos in trading equities?  Why, indeed.

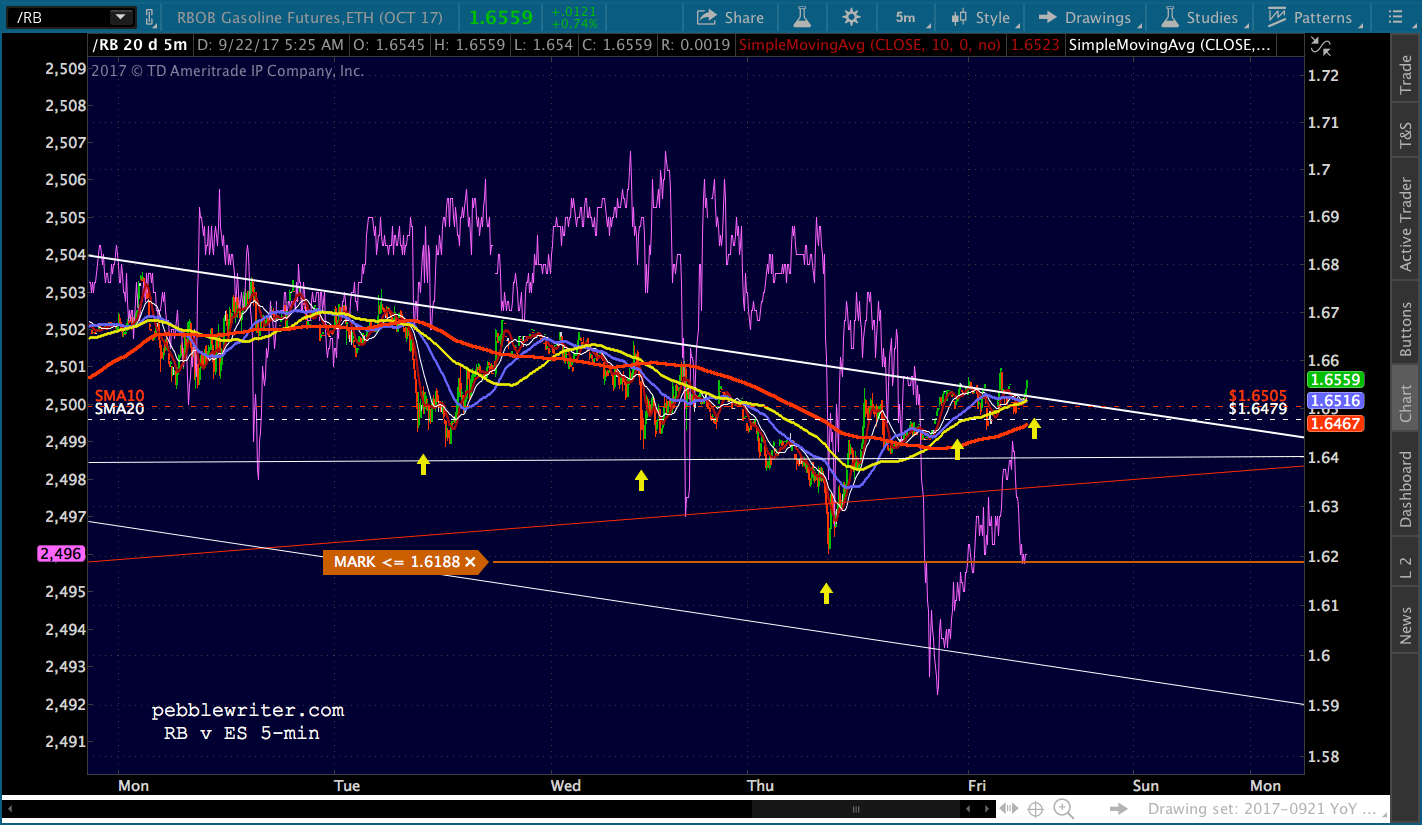
    Going forward, I will post the same charts I always post, continuing to provide daily target prices when possible and a mid- to longer-term forecast as it evolves.  But, for the time being, I will only make note of specific opportunities in equities when there’s a clear breakout or breakdown (e.g. go long on the breakout past 2490.87, target 2510.87, trailing stops at the SMA5 200.)  Traders determined to play the squiggles should have plenty of ammunition.

    Those who don’t want to be glued to their computer all day and/or would like to trade much less frequently can follow my thoughts on USDJPY, DXY, CL, RB, VIX, EURUSD, etc.  I’ll update each as often as necessary, with the pages dedicated to each serving as info central.  Currently, we have trade ideas outstanding in DXY and CL/RB.  We recently closed out a profitable trade in gold.

    I will dedicate the Current Forecast page to summarizing all the recommended positions so members can get a quick summary of where we are and where we’re going.

    As members know, these forecasts and trade suggestions are not made with your particular circumstances in mind.  Some of you are quite conservative and merely wish to avoid the next downdraft (not to worry, this will continue to be covered.)

    Others of you are quite aggressive and love to trade each recommendation as soon as it’s posted.  While you might suffer withdrawal symptoms from the reduced pace of recommendations, I believe this is a more sane approach to trading.  In the long run, I expect most of you will favor this shift in focus.

    As always, recommendations will be made and results calculated on an unleveraged basis (i.e. cash-on-cash.)  If you choose to use leverage to amplify your returns, be aware that you increase your risk at the same time.  Anyone who doesn’t understand exactly what this means should not be trading futures contracts.  Period.

    Although I chart using futures contracts (e.g. CL, which is an abbreviation for Crude Light, West Texas Intermediate Oil futures) there are usually good ETF proxies for those wishing a lower octane approach.  I prefer futures only because trading costs are low and they can be traded nearly 24/7.  And, remember, you can always trade futures without leveraging your position.

    As always, I welcome your feedback.  Please reach out with any comments, questions or suggestions.


  • Charts I’m Watching: Sep 18, 2017

    VIX, USDJPY and CL are all working to keep stocks afloat in the run-up to this week’s FOMC meeting.  Aside from its rising purple channel breaking down, VIX dropped below its recent low of 10.02 on Friday. This is nothing new, as it’s important to central banks that their policies be seen as beneficial to “markets.”  ES is currently up 4 points.

    continued for members(more…)

  • Don’t Worry, Be Happy

    SPX backtested the former highs yesterday, coming within 0.46 of our downside target before being magically levitated by the threat of a drop in VIX and intraday pushes in both DXY and CL.  Unfortunately, for the bulls, those pushes have fizzled as real, live geopolitical concerns have once again bubbled to the surface.continued for members(more…)

  • Charts I’m Watching: Sep 14, 2017

    CPI came in at 1.9%, exactly where we expected and good enough to keep DXY steady…for now.  From Was That It? on Sep 6:

    The EIA is showing a very healthy monthly increase in average gas prices for August (3.9% MoM and 8.4% YoY.) I believe this is understated, but my back of the envelope calculations indicate CPI should come in at 1.9% or higher.

    Futures are off modestly, though.  And, DXY’s initial burst higher seems to be unwinding.  With an FOMC meeting coming up next week, we can expect traders to pay very close attention to how the markets react to the inflation data.

    continued for members(more…)