Some friends of mine recently came into some pretty serious money and asked me about investing. Since I don’t invest other people’s money, I’m a safe person to ask.
There are plenty of good stockbrokers, insurance agents, RIAs and mutual funds out there. But, most of them have one thing in common. Almost without exception, they will recommend that you put your money into whatever it is they happen to offer and leave it there for a long time. If they’re really great at what they do, it’s good advice — right?
Not necessarily. Many studies have shown that the average investment manager underperforms the broad market. But, let’s suppose for a moment that yours is capable of keeping pace year after year, even after fees and taxes. What then?
There’s still the problem of history. Even if you had nerves of steel and didn’t touch the money you invested in October 1929, it would have taken 25 years to get back to breakeven after the initial 89% loss. That’s a very long time for big institutional investors with liabilities into the next century. It’s an unbearably long time for people with bills to pay and retirements to fund.
 Twenty years later, investors were again put the test with the 50% crash beginning in January 1973. This time, it took about 7 1/2 years to recover. But, if you didn’t cash out in 1980-1981, you would have been underwater again till October 1982 — a total of 9 1/2 years. Ouch.
 Most of us remember the most recent crashes. The first began in March 2000 and saw the S&P 500 lose 51% before climbing back to even in July 2007. If you were lucky, you cashed out during the 5 days it topped the 2000 highs instead of watching your portfolio lose 11.9% over the next month.
If you weren’t, perhaps you were lucky enough to hold on and get back to the 2000 highs in October — when you had another 7 days during which you could have broken even. If you breathed a sigh of relief and went on a long vacation instead, your portfolio would have lost 58% over the next 17 months.
It didn’t recover its value until April 2013 — 5 1/2 years after the 2007 peak and 13 years after the first peak in 2000. Admittedly these data don’t reflect the value of dividends, which have averaged about 3.9% since 1929 and 1.7% since 2000. Taxes and fees would have consumed most if not all of that, so we’ll call it a wash.
And, I know very few people who could have sat on their hands while their portfolio lost 20-50%. The average investor would have pulled the plug somewhere along the way, likely producing even worse results.
Is there a better way? Absolutely. Simply selling every time SPX closed below its 200-day moving average and buying when it rose above it would have resulted in much better results. And, there are plenty of models that far outperform such a simple algorithm.
The point is that relying on the market coming back around “because it always does” sounds fine in theory, but at times has involved very long periods of substantial losses. Be sure that your financial plan can accommodate such downturns.
The one thing this market has that past ones haven’t, of course, is the ability to ignore horrible economic news such as this morning’s disappointing retail sales miss. As all the talking heads remind us daily, the retail consumer has been driving the economy and the market. In September…not so much.
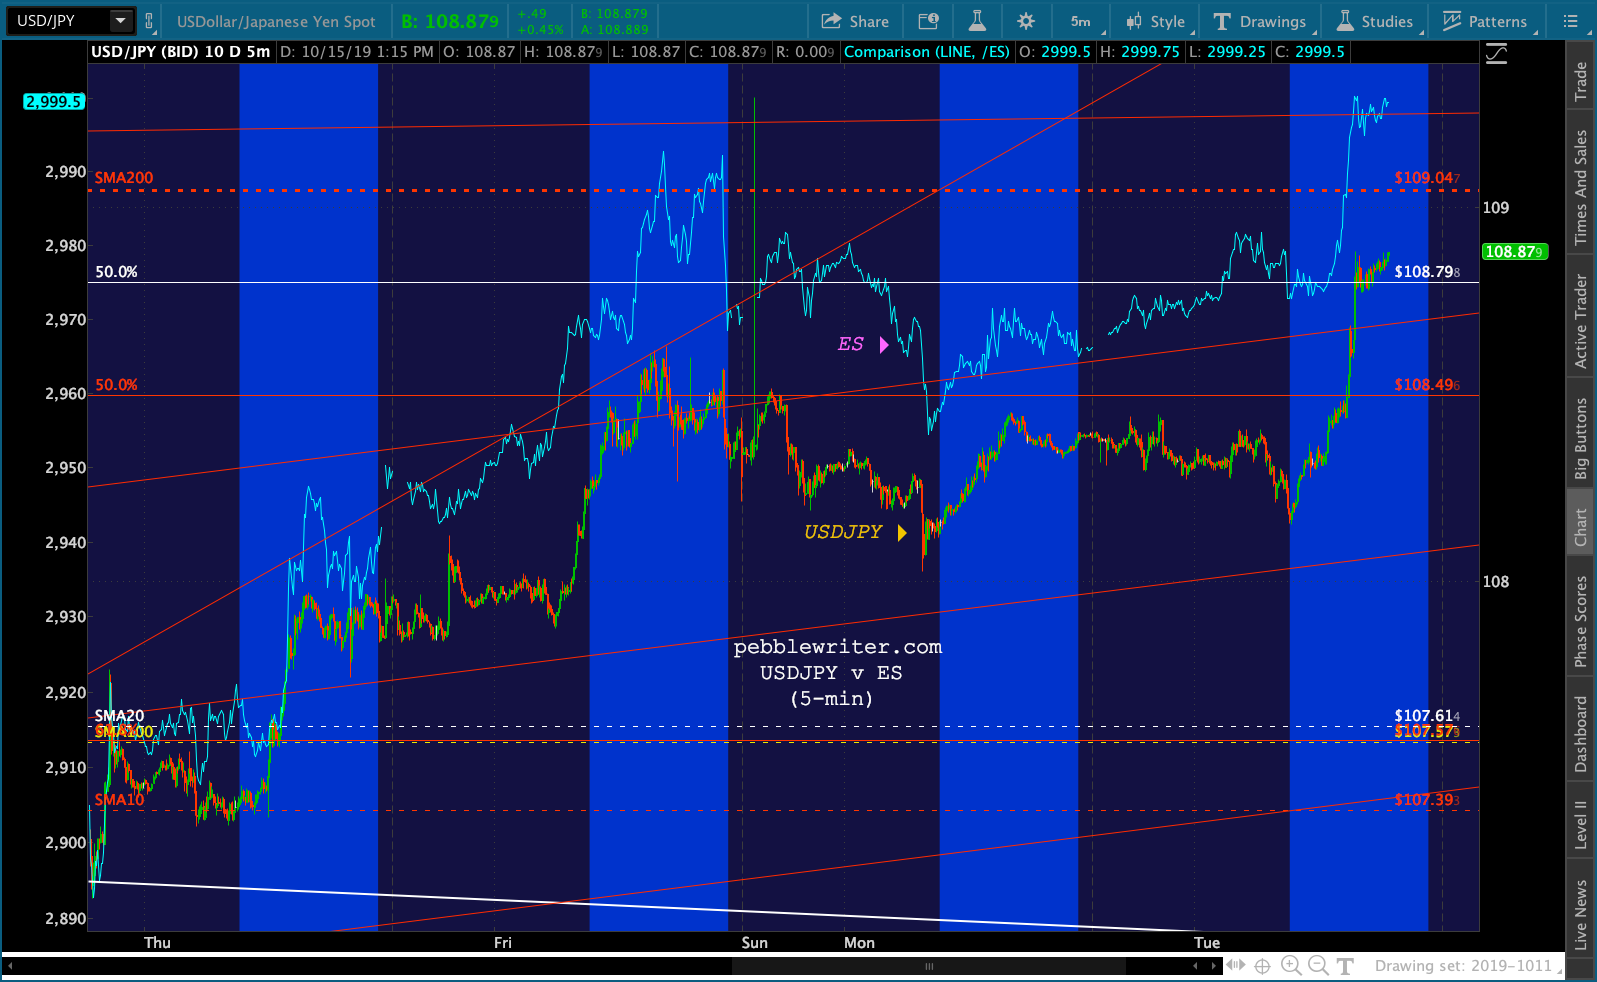
 Looking at ES, you’d never guess that the expected 0.3% gain came in at a 0.3% decline. Will investors care or will they interpret it as an even stronger argument for more rate cuts and QE?
  Naturally, algos will come to the rescue. ES’ only blip below the red TL earlier this morning was instantly resolved by VIX reversing and heading lower.
We’ll see if the algos can pull the same trick if carbon-based discretionary investors, outnumbered as they are, decide that economic data matters.
continued for members…
Today’s charts… The only thing stopping ES from a sharp downturn is OPEX on Friday. If it dips below the red TL again…
 …it will be saved by a further decline in VIX (which is very close to a 10/20 cross in the bulls’ favor)…
 …a bounce for no particular reason by CL…
  …and, off the TL by RB….
  …as well as more ramping by USDJPY…
 …and/or a further “breakout” by NKD.
 Remember, the EIA crude inventory report won’t be released until tomorrow due to the federal holiday on Monday. So, bears shouldn’t expect much help from oil and gas. If we get the downturn the analog suggests, it’ll be because real, live investors get nervous and rein in their equity exposure.
UPDATE: 10:20 AM
VIX just reversed at this little TL which, in an unmanipulated world, would be irrelevant.  But, it’s not that kind of world. ES is backtesting the red TL, now off only 7 points after testing the overnight lows at 2984.75. It’s awaiting further instructions regarding a breakout.
 The way this would usually play out is VIX dips just enough to get ES back on top of its overhead resistance, making it support. Meanwhile, SPX’s SMA5 200 will rise to a level at least as high as this morning’s low of 2985.20 at which point it will become the new floor.
Bears should be concerned at this point as one or two more days of this kind of ramping will result in VIX and SPX both experiencing a 10/20 cross which tends to unleash more buying.
 There have been some notable exceptions since the January 2018 highs: 2/27/18, 5/14/18, 11/9/18 and 12/10/18. It reinforces the notion that we are at an important inflection point. SPX has less immediate downside potential unless it gets started by Monday at the latest. To compound the risk, we are fast approaching the next FOMC meeting on Oct 29-30. As members well know, we typically see a significant ramp job in the runup to these meetings.
Bottom line — another important test for the analog.
UPDATE: 3:55 PM
Lots of noise, but not much resolution yet.
 One of the more interesting charts I’m watching…
 The 25.50ish target represents the intersection of the .382 Fib, two red TLs and the midline of the white channel seen below. If 25.50 should ever be broken, things could get very interesting very quickly.
 GLTA. (more…)


 This is actually the bottom of a channel which has been in place since the 2016 bottom. What’s more, the channel bottom is a smidge below TWTR’s 200-day moving average at 36.93. If it recovers to 36.93 by the end of the day, no problem. If not, things get very interesting.
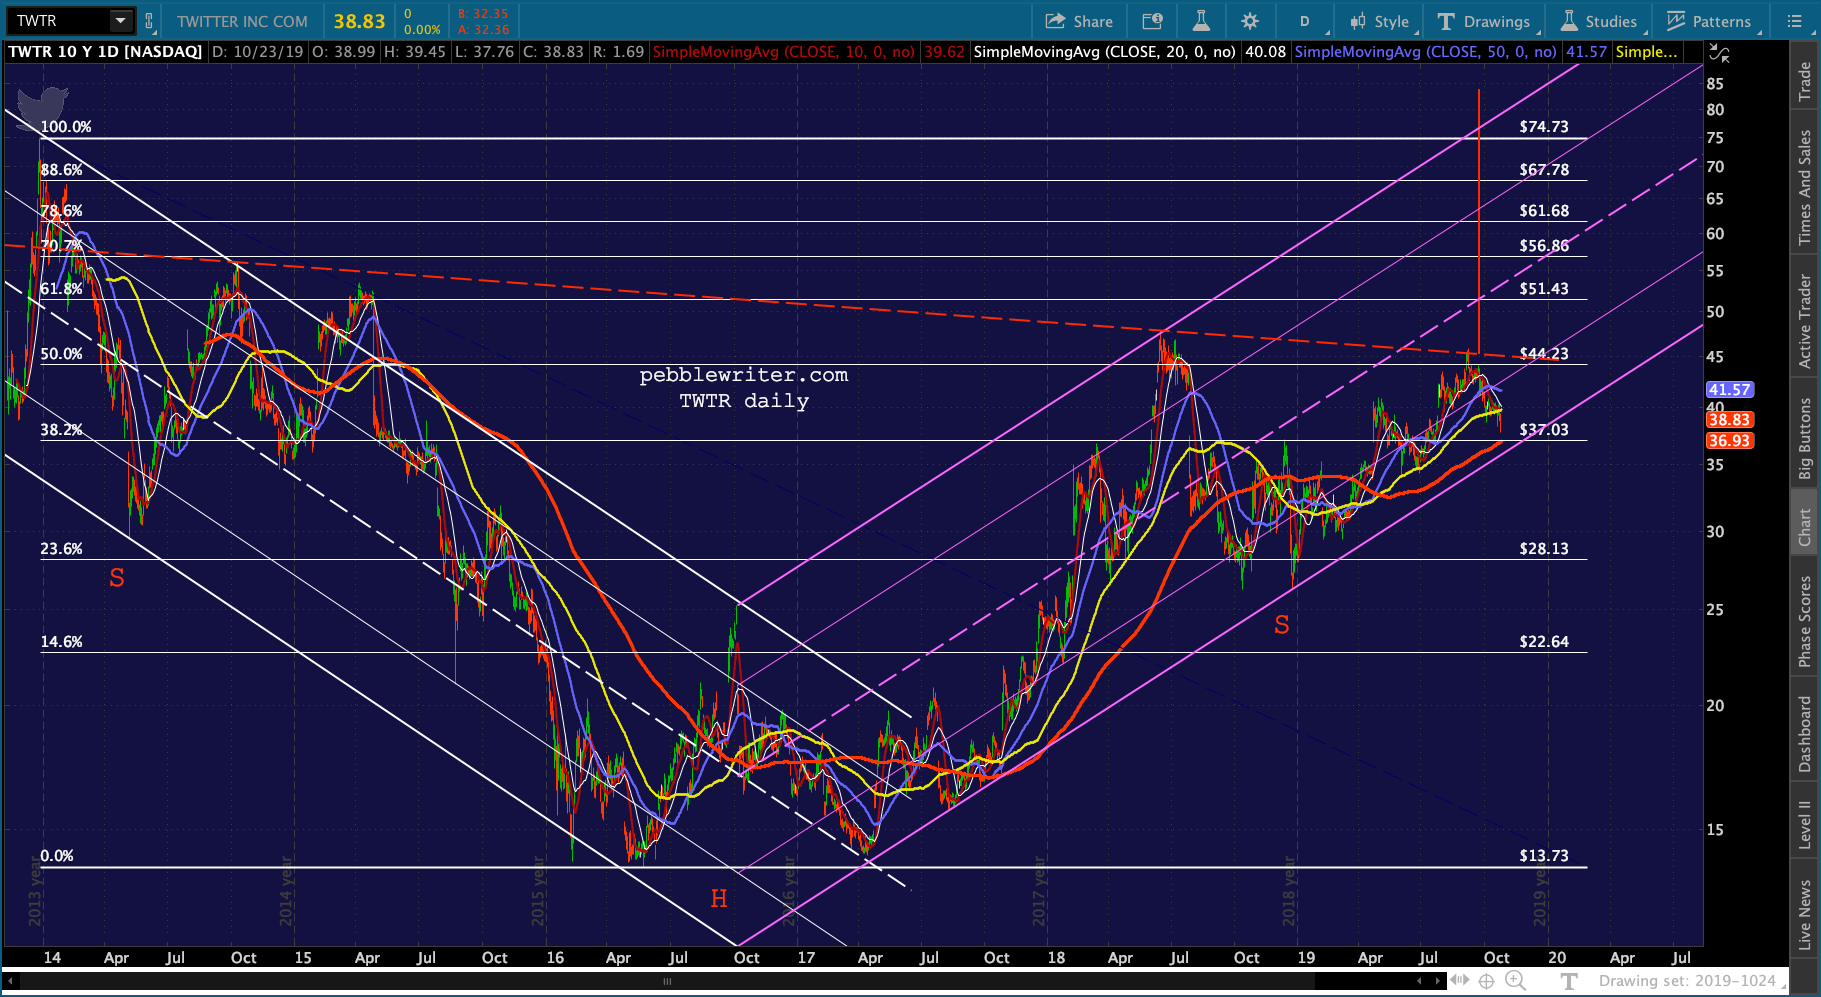 continued for members… (more…)