

Unlike BA and CAT, TWTR is not seeing an immediate bounceback following its dismal earnings, revenues and guidance released earlier this morning. Is this the disaster it seems to be? It depends. Note the purple line running through the middle of the chart. This is actually the bottom of a channel which has been in place since the 2016 bottom. What’s more, the channel bottom is a smidge below TWTR’s 200-day moving average at 36.93. If it recovers to 36.93 by the end of the day, no problem. If not, things get very interesting.
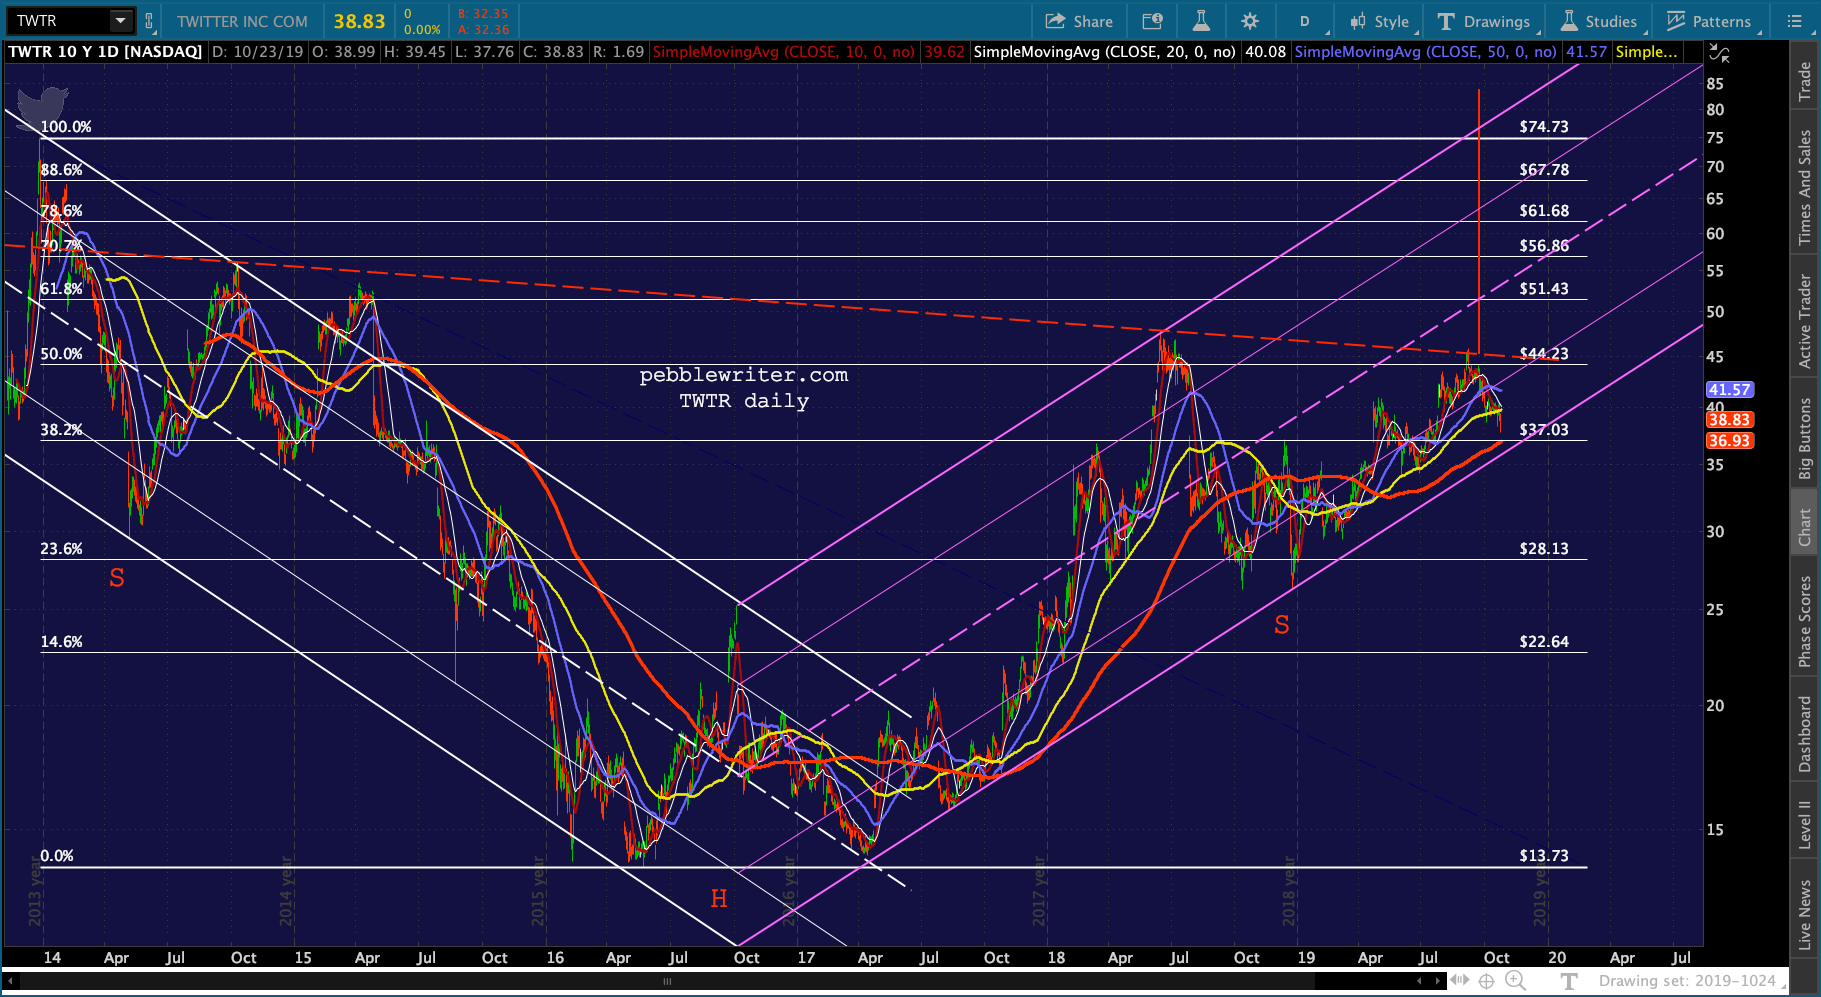 continued for members…If the purple channel fails, there’s another one ready to take its place which offers considerably more downside and would more fully reflect the stock’s recent failure to rise above the neckline of an IH&S which targets 84ish. Keep an eye on this one.
 Meanwhile, the usual ramp is in place and ES is about to push above its recent highs. It has downside support at its SMA5 200 at 3000, followed by the SMA10 and red channel bottom at 2992.58.
 The usual suspects are all in play this morning, which VIX taking the lead in ramping futures higher…
 …despite its rather bearish (for stocks) big picture.
 USDJPY is being supportive by simply not declining yet.
 And, NKD is reinforcing its “sky is the limit” stance.
 Oil and gas did not pull the usual overnight dip and pre-market rip. Both are at or near important resistance.

Our analog called for two dips this week, with the first obviously not happening. The second one is potentially still in play. But, as we discussed last week, there is a very good chance that the current prop job will remain in place for the next week as the FOMC meeting approaches.
We have new home sales coming up at 10AM. I’ll check back in then.
UPDATE: 10:10 AM
New homes sales declined slightly more than expected. The big news, however, is that median sales price dropped 8.8%.
 Stocks are not amused, but so far the SMA15 200 is holding…
 …thanks to VIX’s reticence to rise above its neckline…
  …and USDJPY’s threat to pop above its SMA10.
 I think we’ll probably test ES’ SMA10 by the end of the day.
I’ve spent a great deal of time lately thinking about the analog. It started off pretty well and has gone steadily downhill ever since due to two failures to dip when expected and its failure to reach its downside potential when it does dip.
Let’s say, for the sake of argument, that the analog was and still is someone’s plan. I originally, somewhat tongue in cheek, suggested it might be promulgated by those who didn’t want to risk 4 more years of Trump as POTUS. We’ll call them DS (Deep State) just for fun.
The theory was that DS would tank the market in order to rob Trump of his chief claim to fame: he has been very good for equities. If in the months before the election SPX fell back to 2138 — where it was when he was elected — he’d have a hard time making that claim.
I’ve also heard it said, obviously by Trump supporters (TS), that if Warren or Sanders won the election the market would tank by 25%. Coincidentally, this would also put SPX in the 2100-2200 range.
If this tin foil hat theory of mine were to be true, we might expect the DS would have less and less interest in crashing the market as the odds of Trump being elected declined. Obviously, the odds have declined. And, the odds of him being impeached have increased.
 Here’s a good website to research and track these things if you’re interested: https://projects.fivethirtyeight.com/impeachment-polls/?ex_cid=rrpromo
So, there’s something for everyone in a correction. TS can blame it on the rising chances of a Dem being elected and his detractors can blame it on his mishandling of the economy. Trump himself will obviously blame it on the Fed.
But, the DS’ desire for a correction should presumably wane as Trump’s popularity does (no need.) For their part, TS would absolutely want to put off any decline over the next few months (if his popularity was crashing as the election approached, they would loudly blame any market weakness on both the Fed and the repercussions of a potential changeover.) Either way, there appears to be less need for a correction at this time.
The third major contingency is composed of those who don’t care as much about politics as they do preventing any corrections in the markets. This group would include most banks, investment management firms, (theoretically at least) central banks and their proxies, the majority of hedge funds, etc.
Think of this group as the “undecideds” in an election. They are the middle ground which ends up deciding which way things go. In 2011, they were the fundamentally-driven investors who felt that US debt being downgraded was a big enough deal that they should sell everything that wasn’t nailed down.
IMO, this group has been propping up stocks at every turn. They should probably be expected to continue doing so to the best of their abilities — meaning that a big enough shock to the system might overwhelm them. Big shocks could include Fed action, official entry into a recession, another downgrade, a shooting war in the Middle East, etc.
They are especially vigilant around important market, economic and monetary events such as OPEX, earnings week, and FOMC meetings. Last week we saw the effects of OPEX which, so far, looks to be meshed with the upcoming FOMC meeting for protection purposes.
It’s important to note that this group need not be cohesive. That is, the BoJ could unilaterally decide to ramp USDJPY and CL and short VIX in order to preserve the new support under NKD. They might be more amenable to a pullback if they’re backtesting important new support and the cost isn’t too high. But, in general, the higher the better — unless they find a reason to join the DS or the TS.
To sum up, neither the DS, the TS, nor the undecideds have a strong incentive to unleash a correction right now. This reduces the odds of one occurring.
If my analysis is correct, stocks will probably hold current levels through at least the FOMC decision. After today, there are only 4 trading days between now and then. If so, ES should trade in a range of 2984 – 3015, though I wouldn’t be too surprised to see slightly higher highs in order to stop out some weak bears.
If stocks hold up through October 31, then we could finally see a sell-off in the days afterward. There has been plenty of ugly economic and earnings news, and a disappointment from the Fed could touch off a decline. There is also a boatload of economic news coming out next week. Would a selloff reach the most extreme analog target? Probably not. My gut tells me it would be limited to the SMA200 or thereabouts.
Currently, SPX’s SMA200 is at 2875ish, very close to the red .886 on the chart below. It’s also in the vicinity of the yellow neckline of a large H&S Pattern targeting 2700ish. The bulls would not want this H&S to play out. If it overshoots, there’s support from the 2850.02 C=A and the gray .886 at 2844. It that failed, there is a bunch of support at 2764-2768 and several points below.
Since the 2.618 is up at 3047.34, we can’t write it off as a potential target. It would trash the analog, but would stop out the largest number of people so shouldn’t be discounted.
 I have to be out of the office tomorrow for a minor medical procedure. I should be able to post in the morning, but I suspect there won’t be anything particularly exciting going on.
GLTA.