

Judging from the market’s reaction yesterday, the Fed should raise rates more often.
Obviously, it wasn’t the market’s reaction. It was algos responding to the “bullish” signals thrown at them, all at the same time, and all before Powell had moved past his opening remarks to say anything of substance that wasn’t already known.
It’s a common ploy in the lead up to major economic news, options expiration (tomorrow) and, especially, FOMC decisions. The purpose is to convey the notion that whatever is being announced is actually bullish.
Remember, the Fed is simply catching up with what the bond market has already done. And, they won’t actually start shrinking the balance sheet for another two months. In the meantime, they will go on propping up stocks as best they can. They’re obviously better at that than they are at forecasting inflation or ensuring price stability.


 USDJPY had already broken out and was thus already cheerleading the rebound before it even started. The BoJ prefers to take no chances.
NKD came within 220 of its pre-COVID highs on Mar 10 – much too close for comfort. continued for members…The equity picture shows ES and SPX near their channel tops. It wasn’t a breakout, but it came fairly close. This raises the possibility that they’ve drawn the line in the sand and it is the white 1.618 at 4153.62. I still like the 3.618 better.
 ES breaking back above the SMA20 and into the already broken down white flag pattern is obviously a complicating factor. But, again, tomorrow is OPEX…


 The currency picture is still OPEX-ish, with USDJPY still broken out and apparently heading toward the IH&S neckline at 121.25.

 EURUSD is, for the moment at least, resuming its .886 bounce…
 …which has DXY heading for a backtest of its .618. Again…for the moment.
 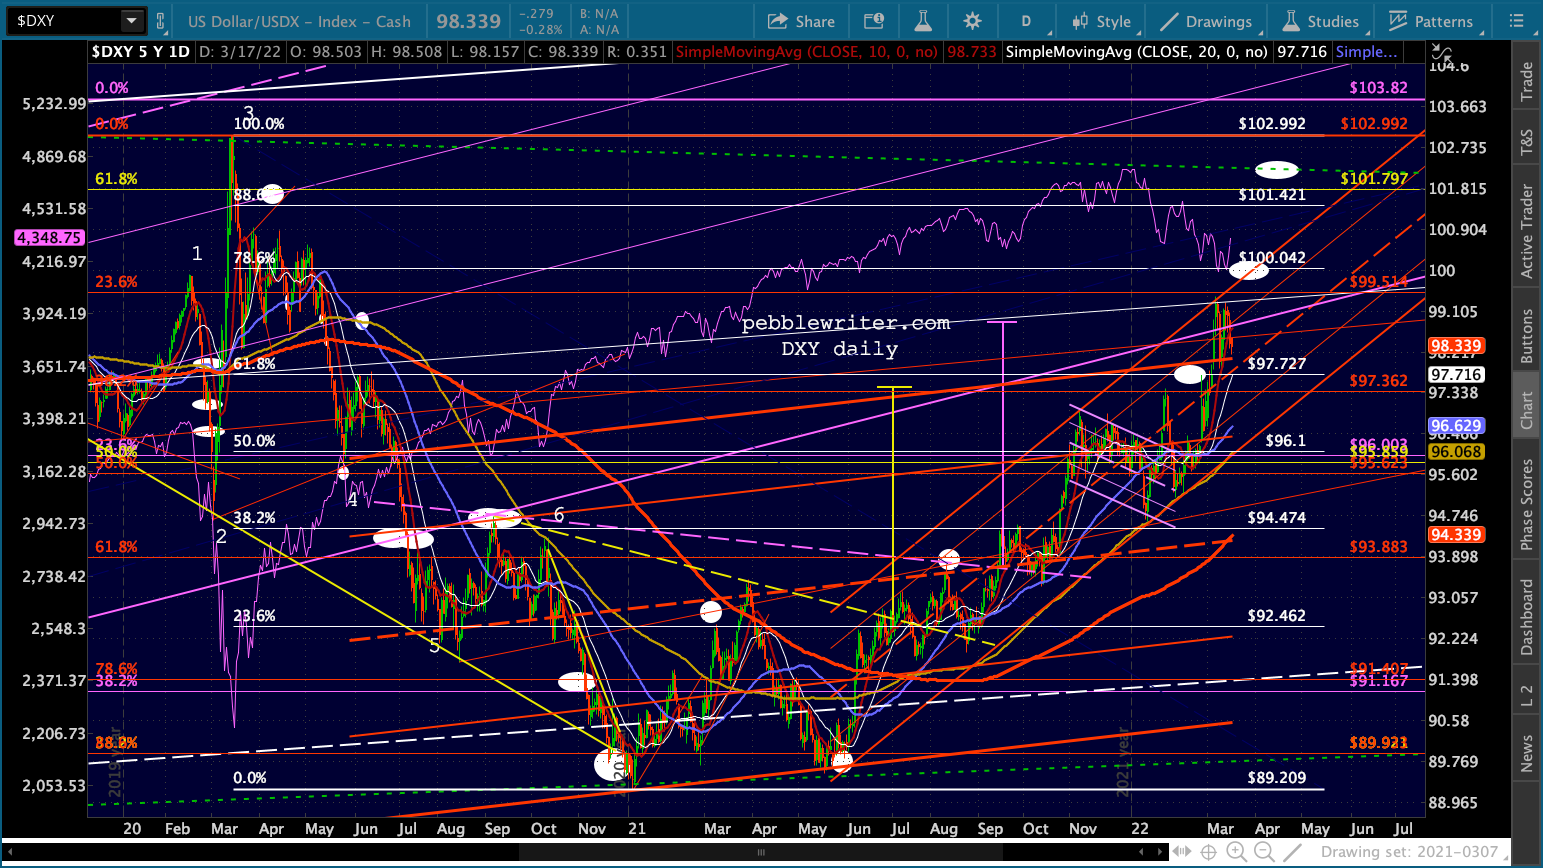 Gold got close enough to its red target and is back below the purple channel bottom below which it broke down last August. Its next step should be a backtest of the SMA200 and IH&S neckline at 1823.
 SI is also likely to backtest its SMA200 before anything else significant happens.
  I’ve been thinking about making a change to the SI chart for some time. Note that the rising white channel shown above broke down last September and has played an ever lesser role ever since. I think it’s time to religate it to a less striking color and add a flat white channel in its place. I’ve also added the smaller rising red channel to acknowledge the latest price movement.
 BTC’s flag/triangle continues to extend, suggesting the obvious SMA100 backtest and potentially a SMA200 backtest once it drops down to or through the black, dashed neckline at around 45,800. Note that at any point, particularly if/when stocks drop sharply, BTC still has downside potential to 28,600.
 CL completed its backtest of the white channel from which it broke out and is bouncing. At any given time, the Ukraine invasion could come to a peaceful resolution. The Fed/White House could also engineer a downturn through market manipulation or a deal with the Saudis. So, the downside targets remain in place. But, this could also drag out for months – meaning continuing strong support and a very risky investment environment.
 RB has a little further to go in order to complete its backtest.