

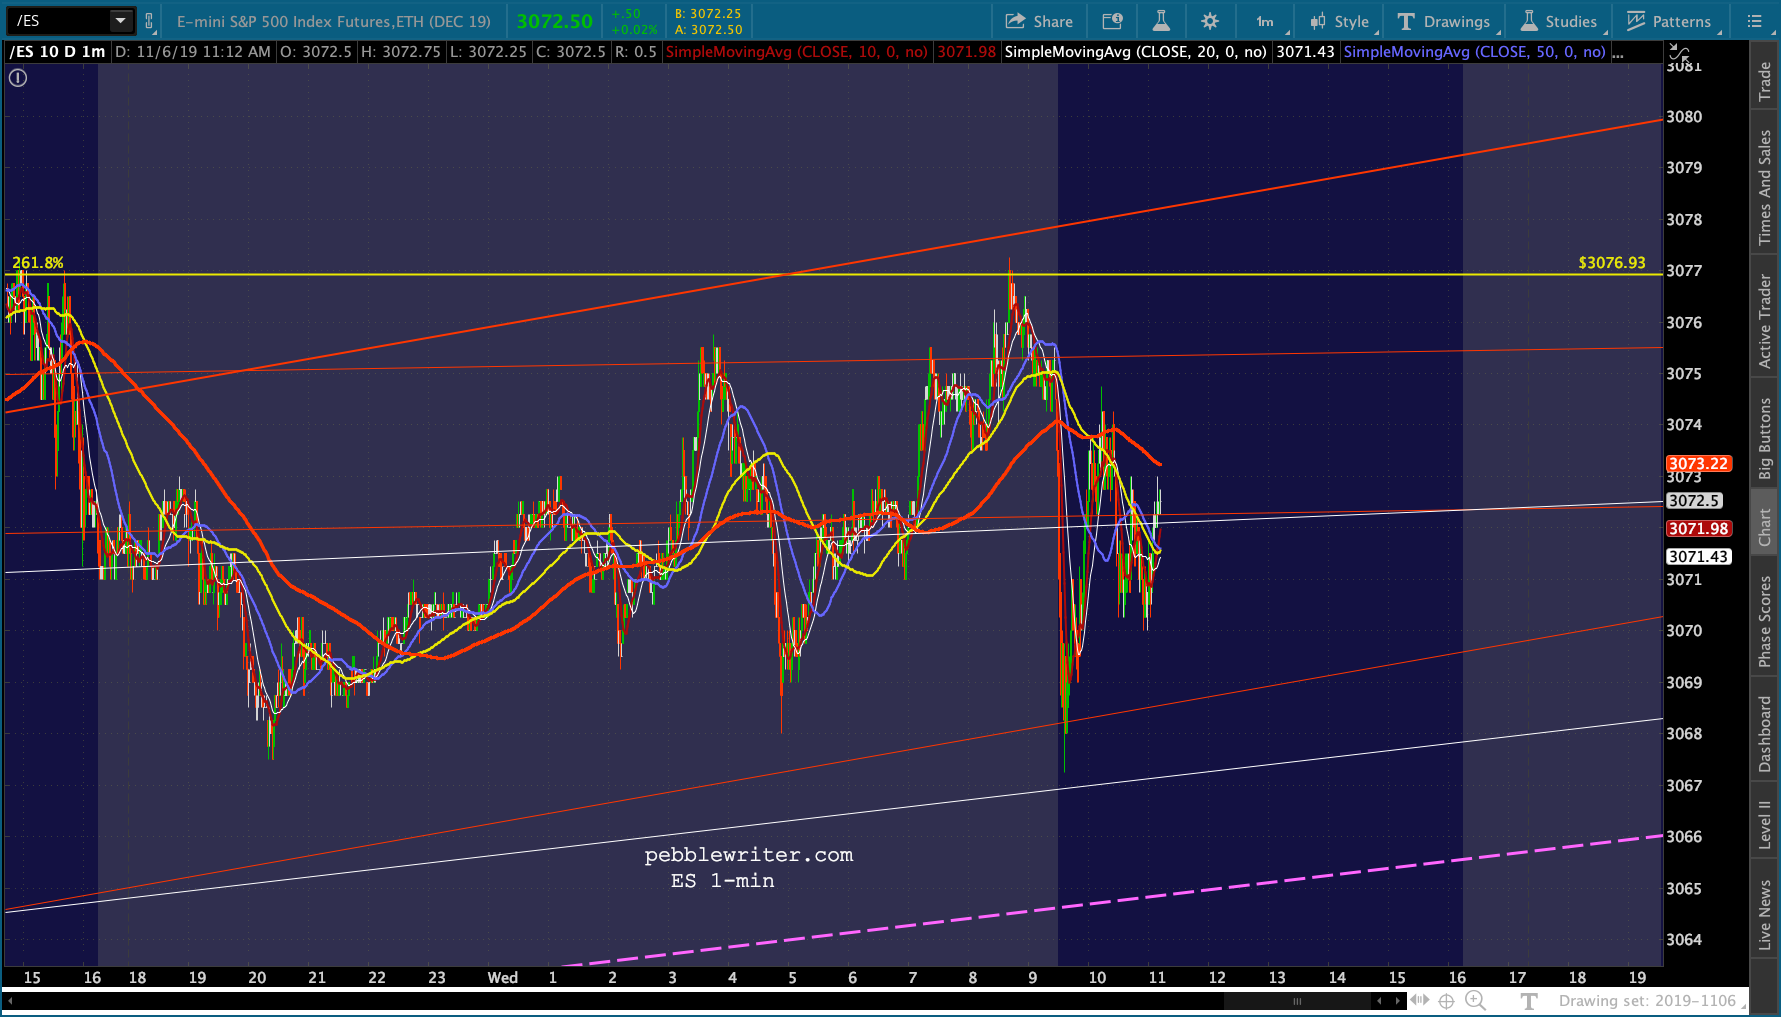
When the market hangs around an important level of resistance day after day, without breaking out or breaking down, it usually means something important. is in the works. We’ve seen it in the S&P futures, loitering around the 2.618 Fib extension (of the 2007-2009 crash) at 2076.93.  We’ve seen it in VIX, bouncing repeatedly off a trend line of support dating back to Nov 2017.
 And, we’ve seen it in AAPL, one of the poster children of the market’s latest rally and one of my favorite stocks to chart and trade. It has been very, very good to us.
 As we discussed the other day [see: Chasing Highs] the broad market has made a habit of disappointing those who blithely chase after each breakout to new all-time highs. Is this also true for AAPL? And, if so, what does it tell us about the broader markets?
We should start with the observation that it has essentially repeated the pattern it exhibited this past May – backtesting the channel from which it broke down a year ago. This, in itself, suggests trouble ahead.
continued for members…AAPL is again trying to make the argument that the rising purple channel isn’t rising fast enough to properly reflect its value. The last time this argument failed, it resulted in a 39% drop.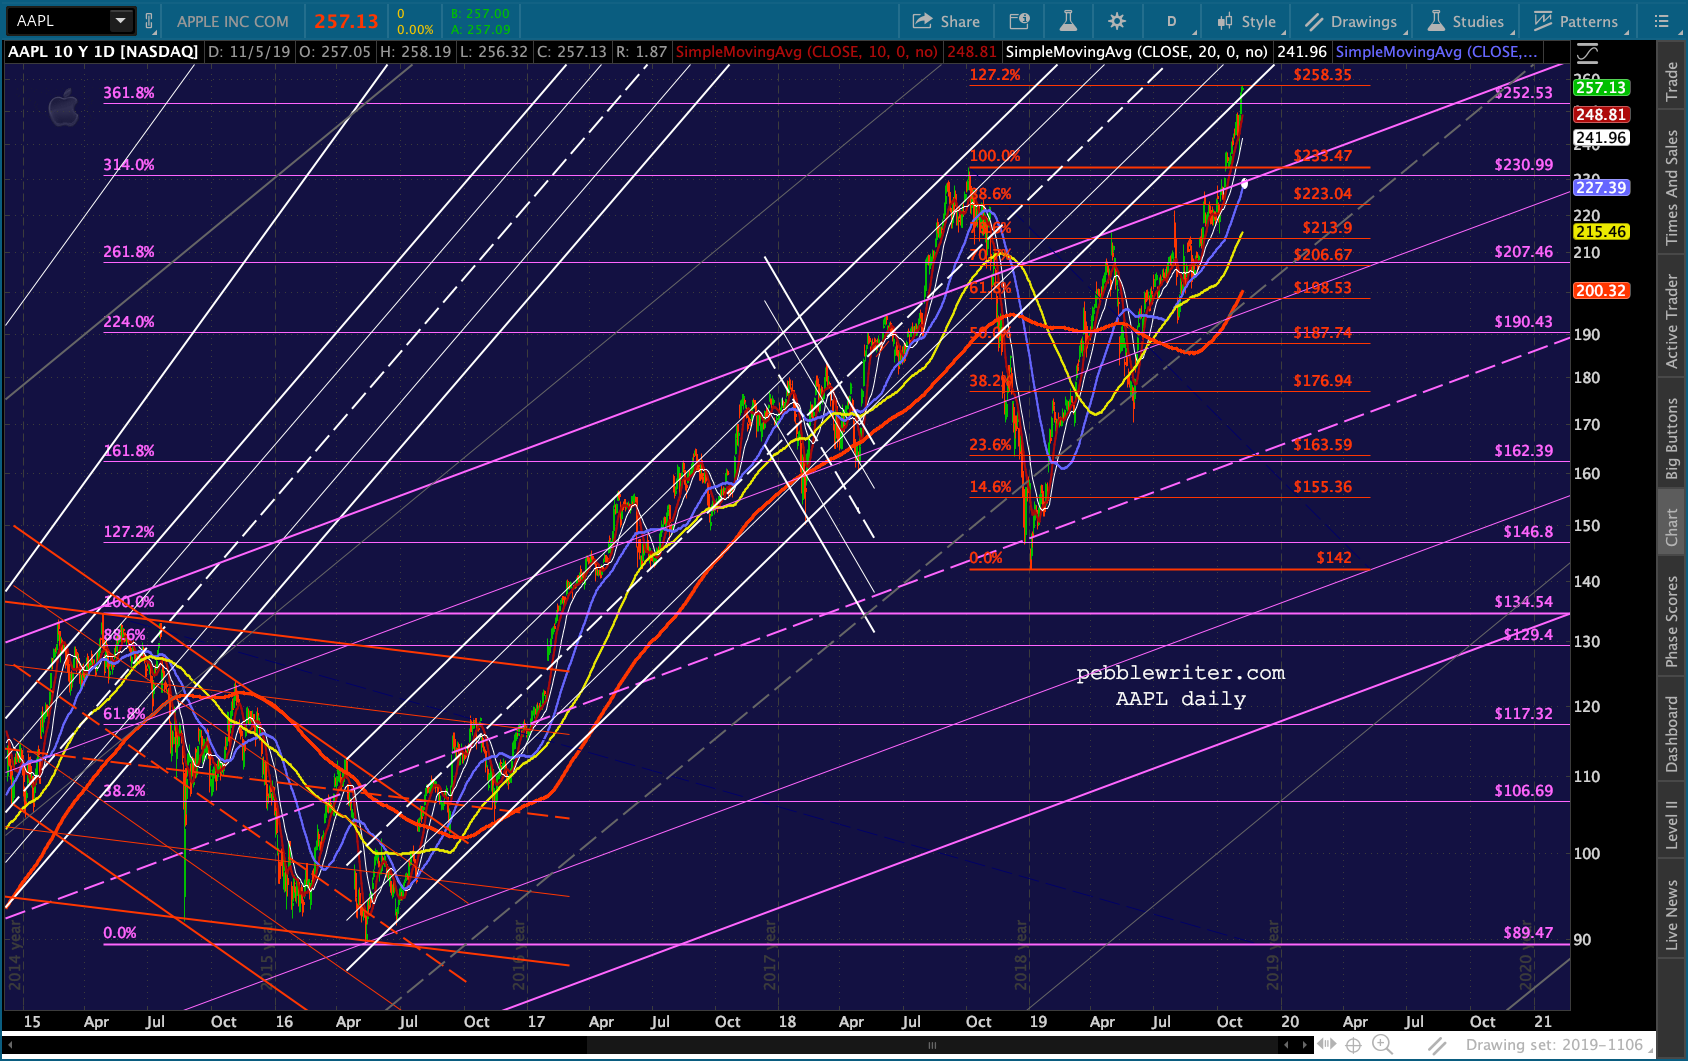 The purple channel is the one which took over after the huge white one from 2000 broke down. The intial backtest rallied higher and at almost the same slope, but it broke down in 2015-2016, thus establishing the purple one.
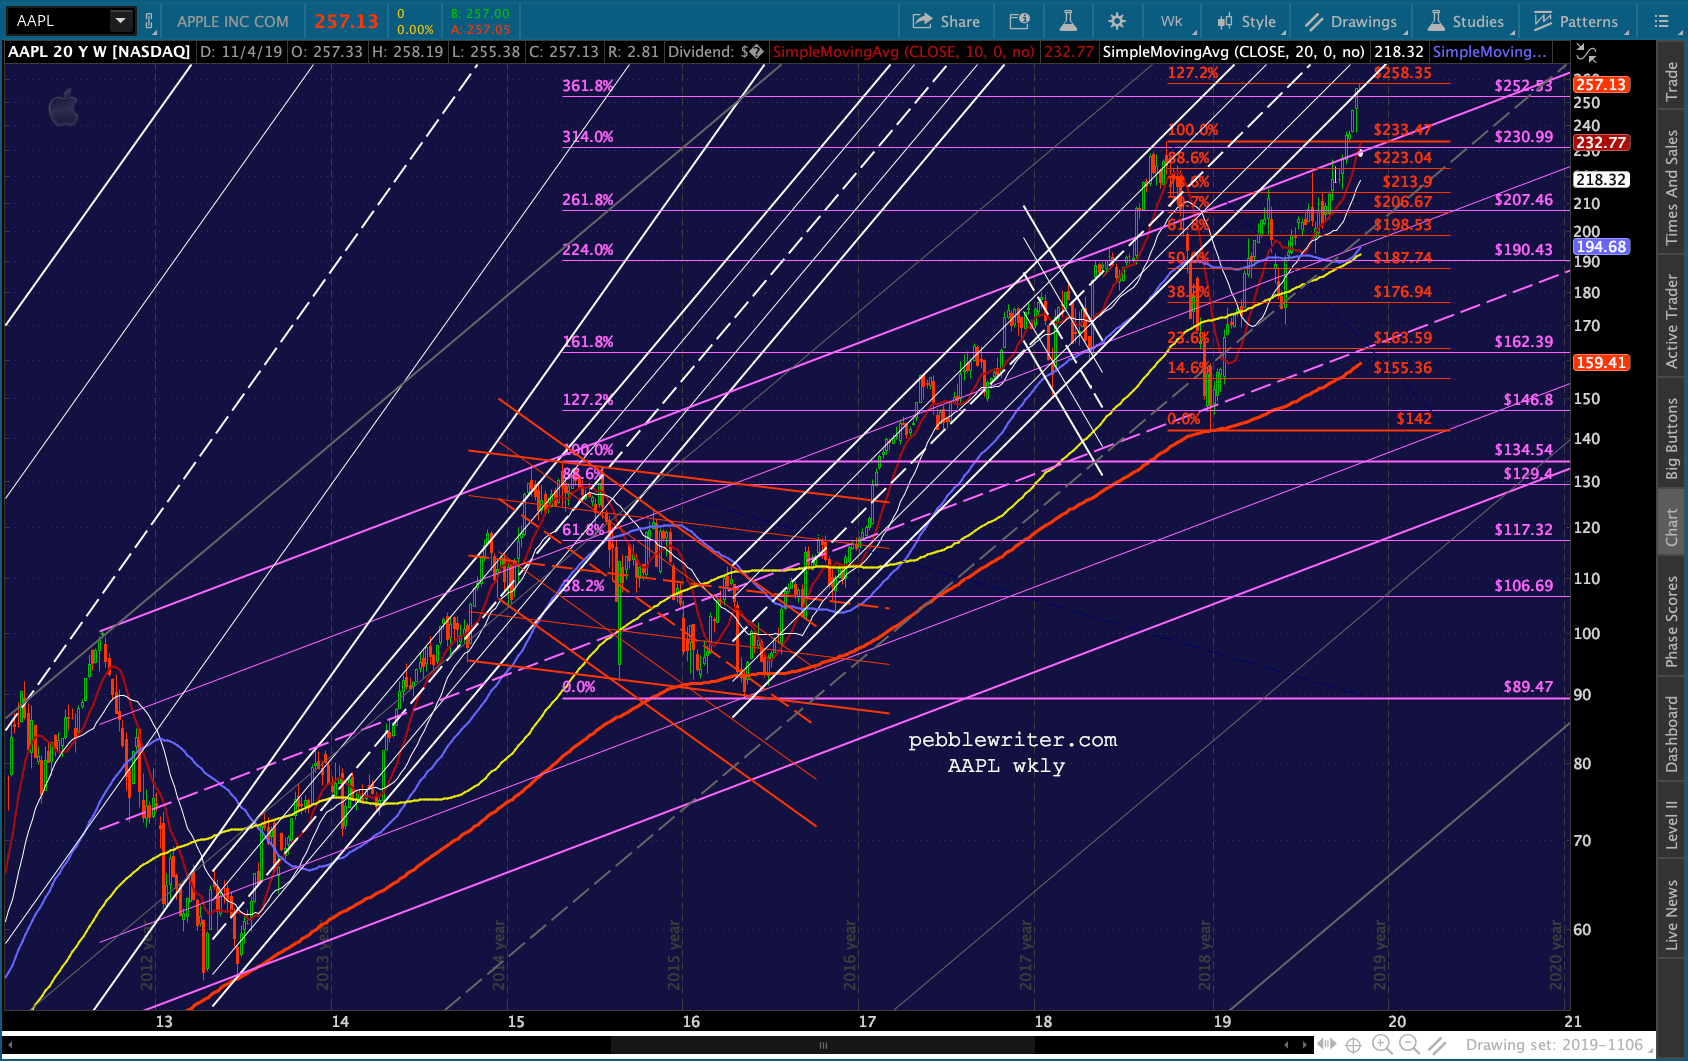 We saw a breakout of the purple channel in Aug 2018 which, after rising 31 points, broke down in November. We’ve since seen two tests of the purple channel top: May 1 and Jul 31.
This latest breakout, which has also popped 31 points above the purple channel top, began with a gap higher on Oct 11 and might still be going if it hadn’t run into the white channel backtest and its 1.272 extension – a classic Butterfly Pattern termination.
Note that AAPL’s RSI supports the notion that it has indeed topped out after longstanding and consistent negative divergence.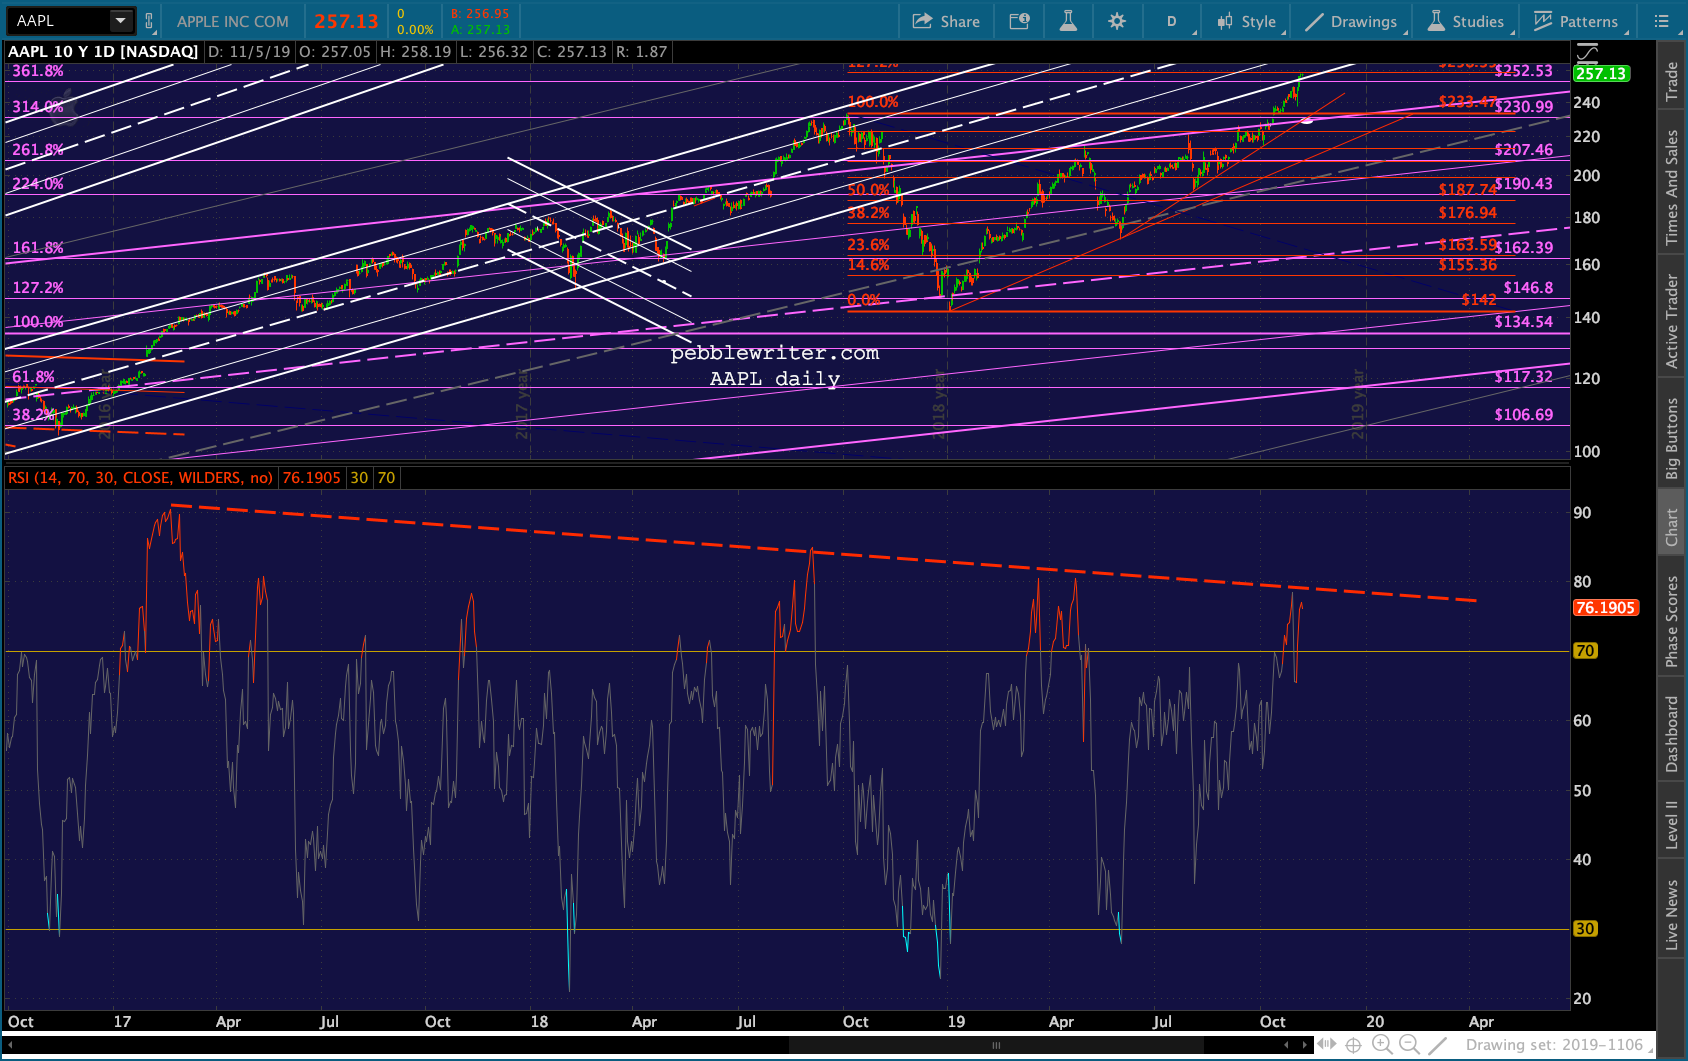
The one thing we know about Butterfly Patterns (set up by an initial reversal at the .786) is that they can rally up to their 1.272 or 1.618 extension. That makes this decision very easy. A break above the 1.272 and incursion into the white channel should be bought.
Otherwise, this is a sell signal with initial downside potential to the 233.47 former high and secondary to 230 — the intersection of the purple channel top with the SMA50 and a TL off the Jun 3 lows. That’s a range of 9-11%.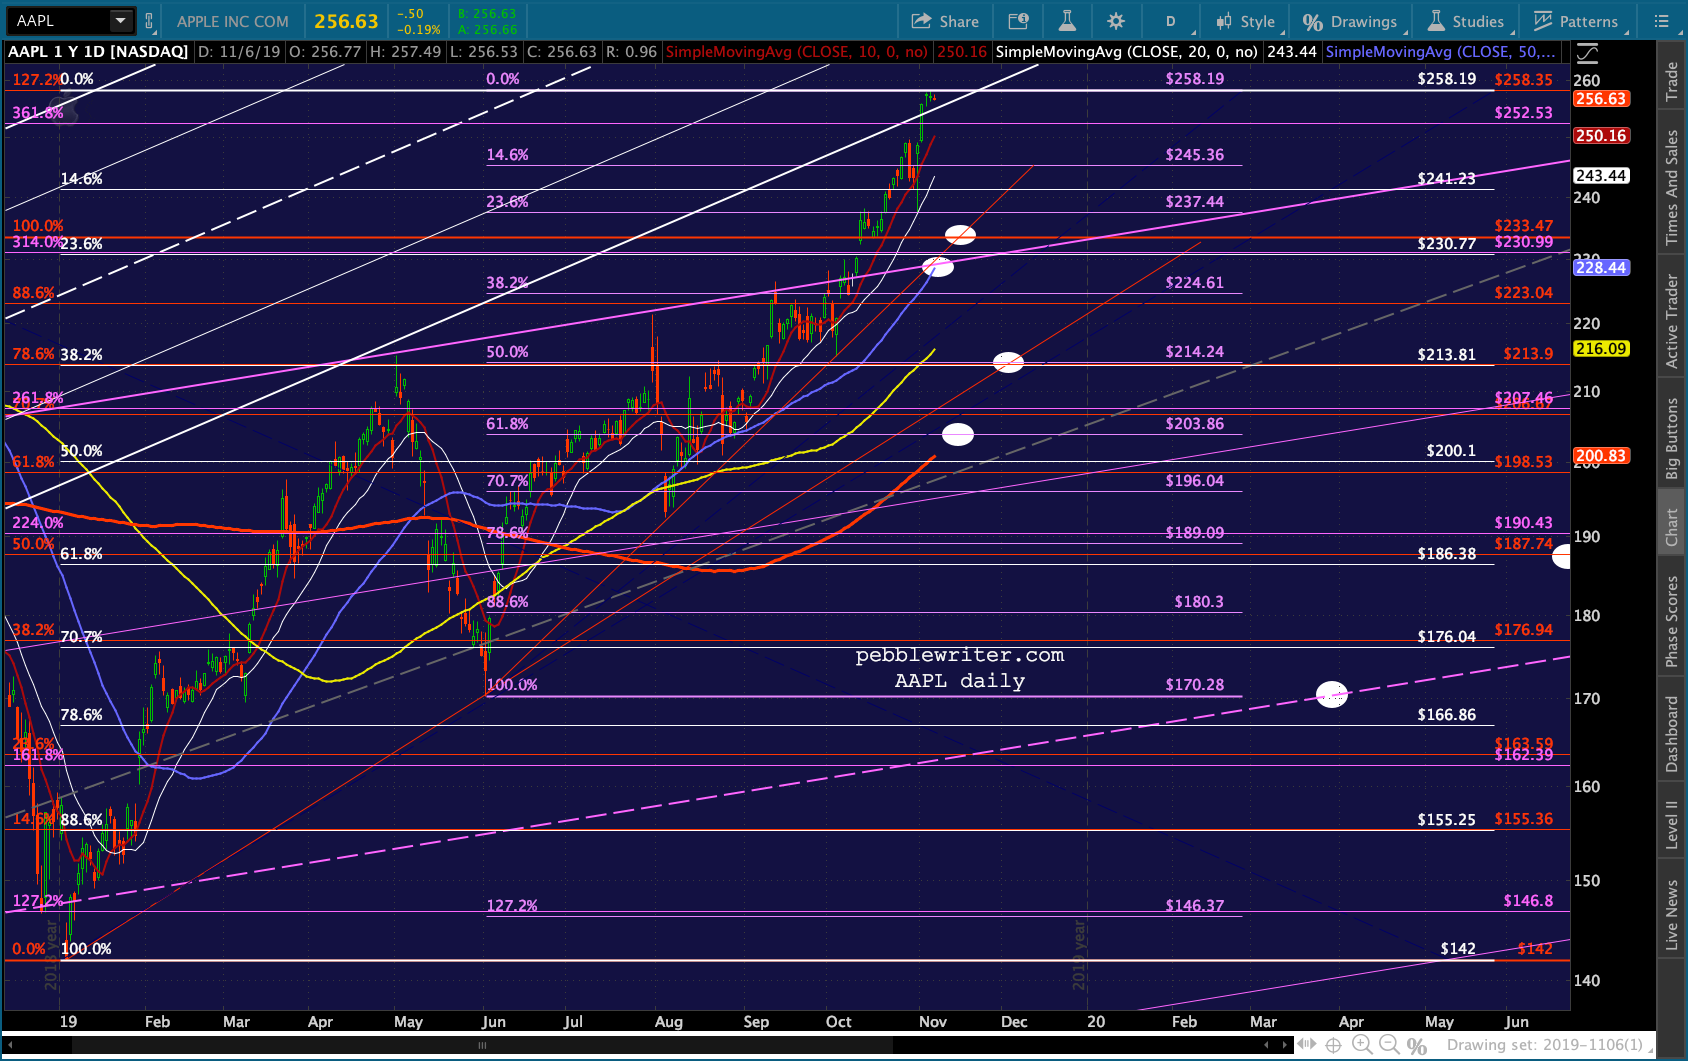 If neither of those hold, it has exposure to the .500 and another red TL from Jan 3 at 214.24 followed by an intersection between the .618 and the SMA200 at 203.86.
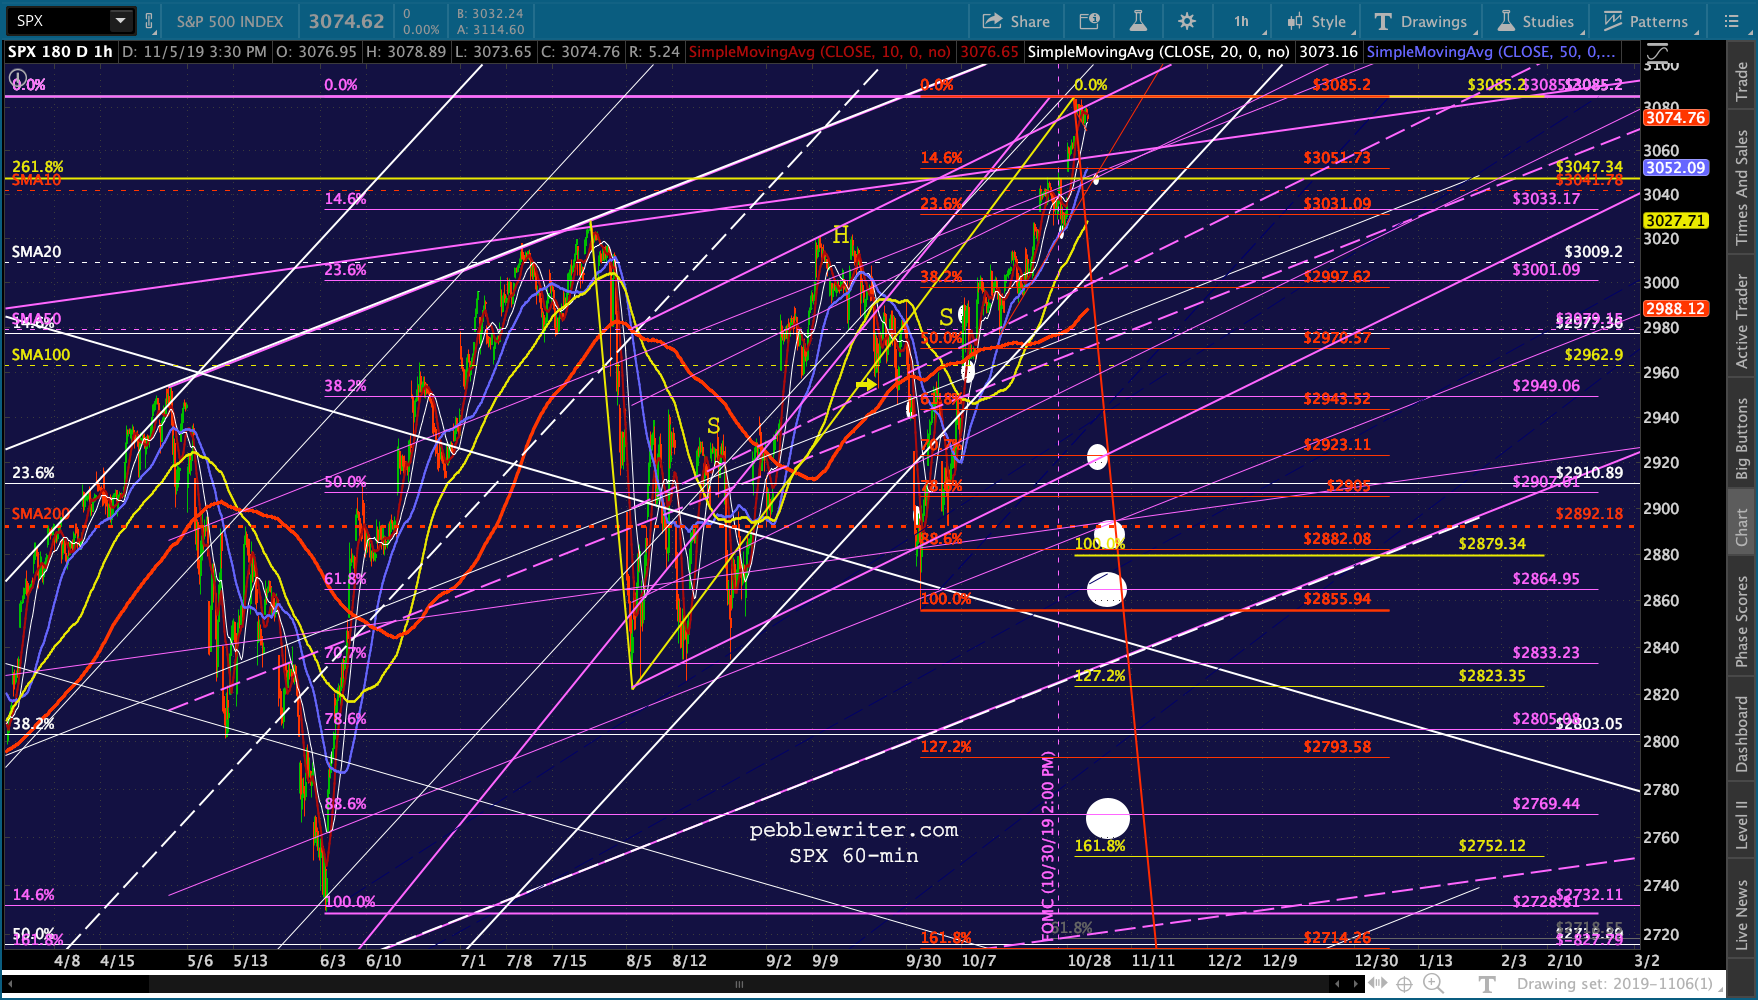
Today’s charts – no real change from yesterday.
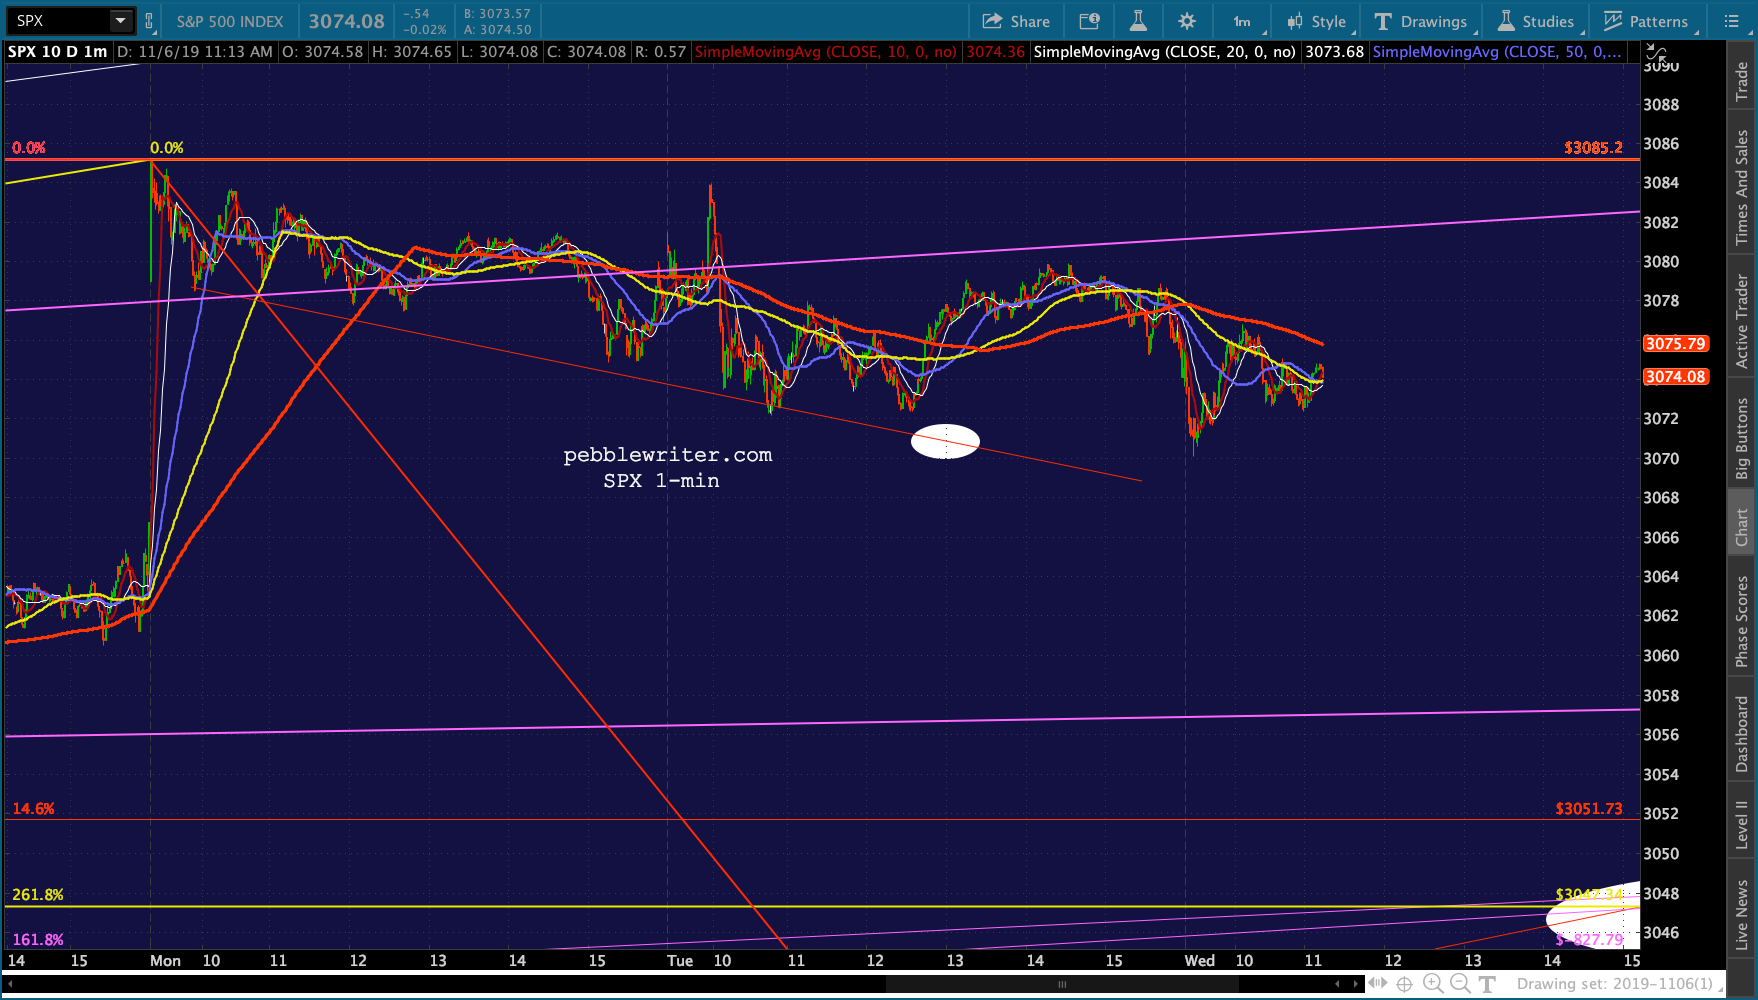
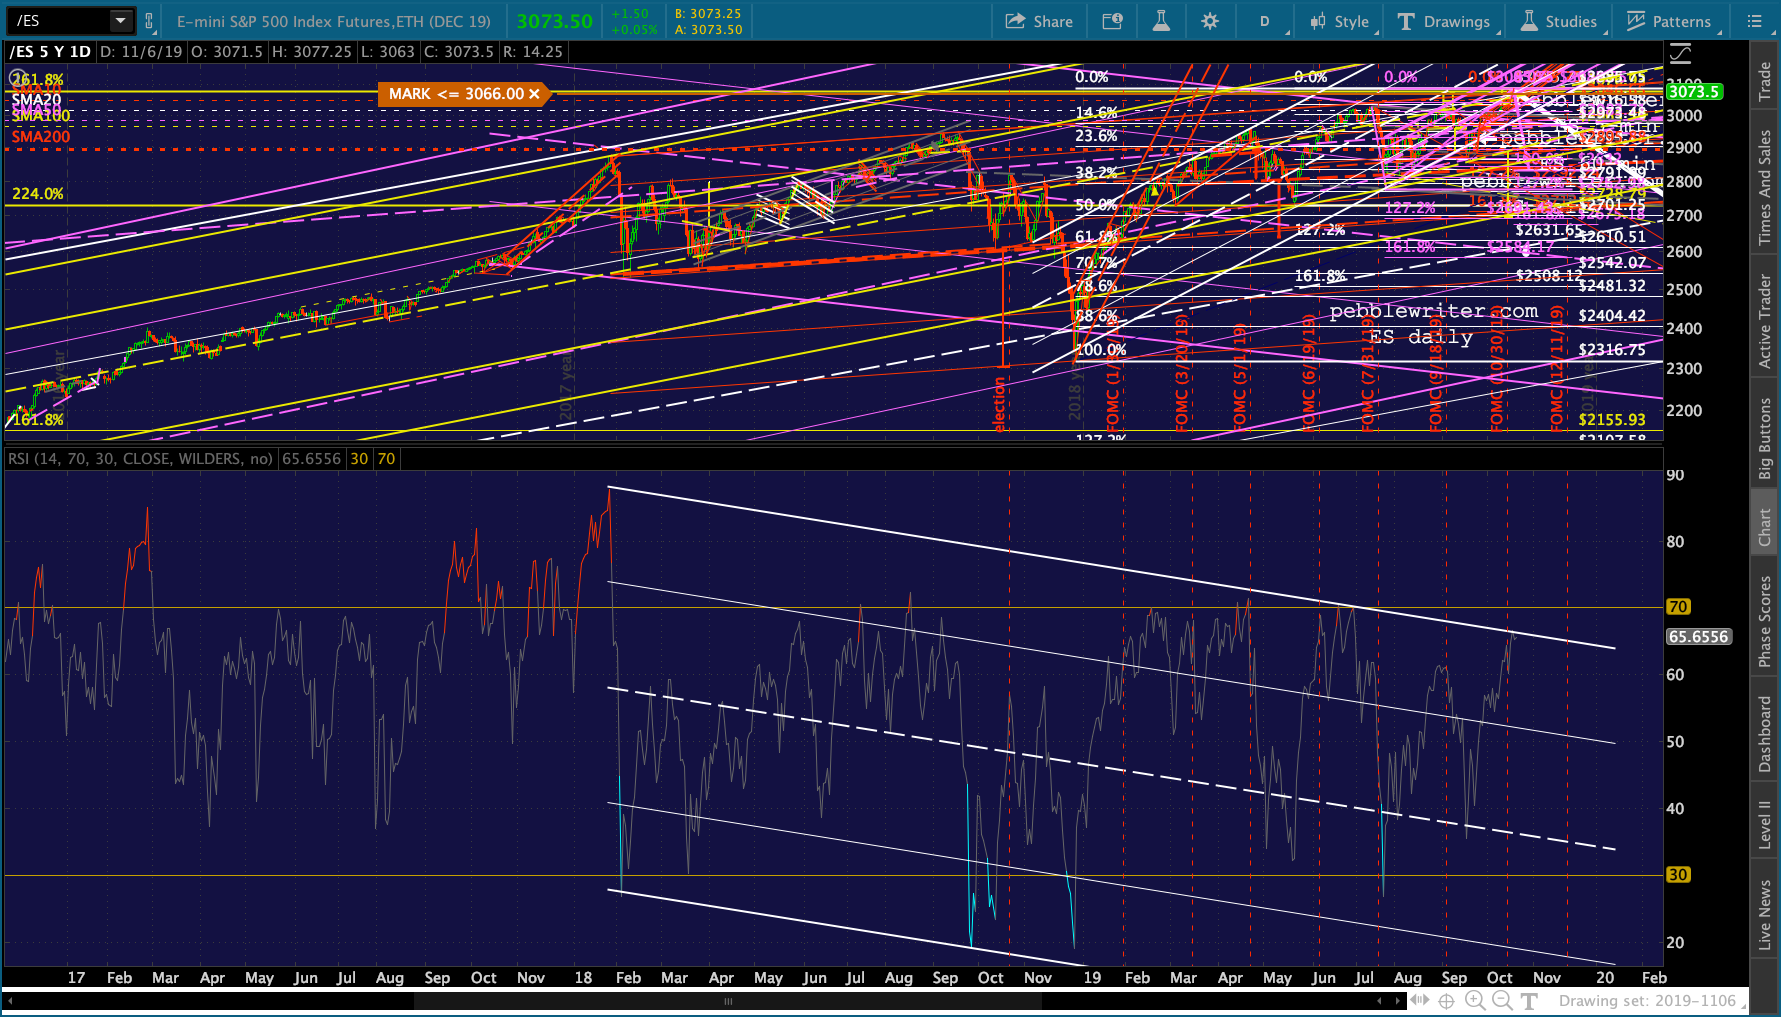
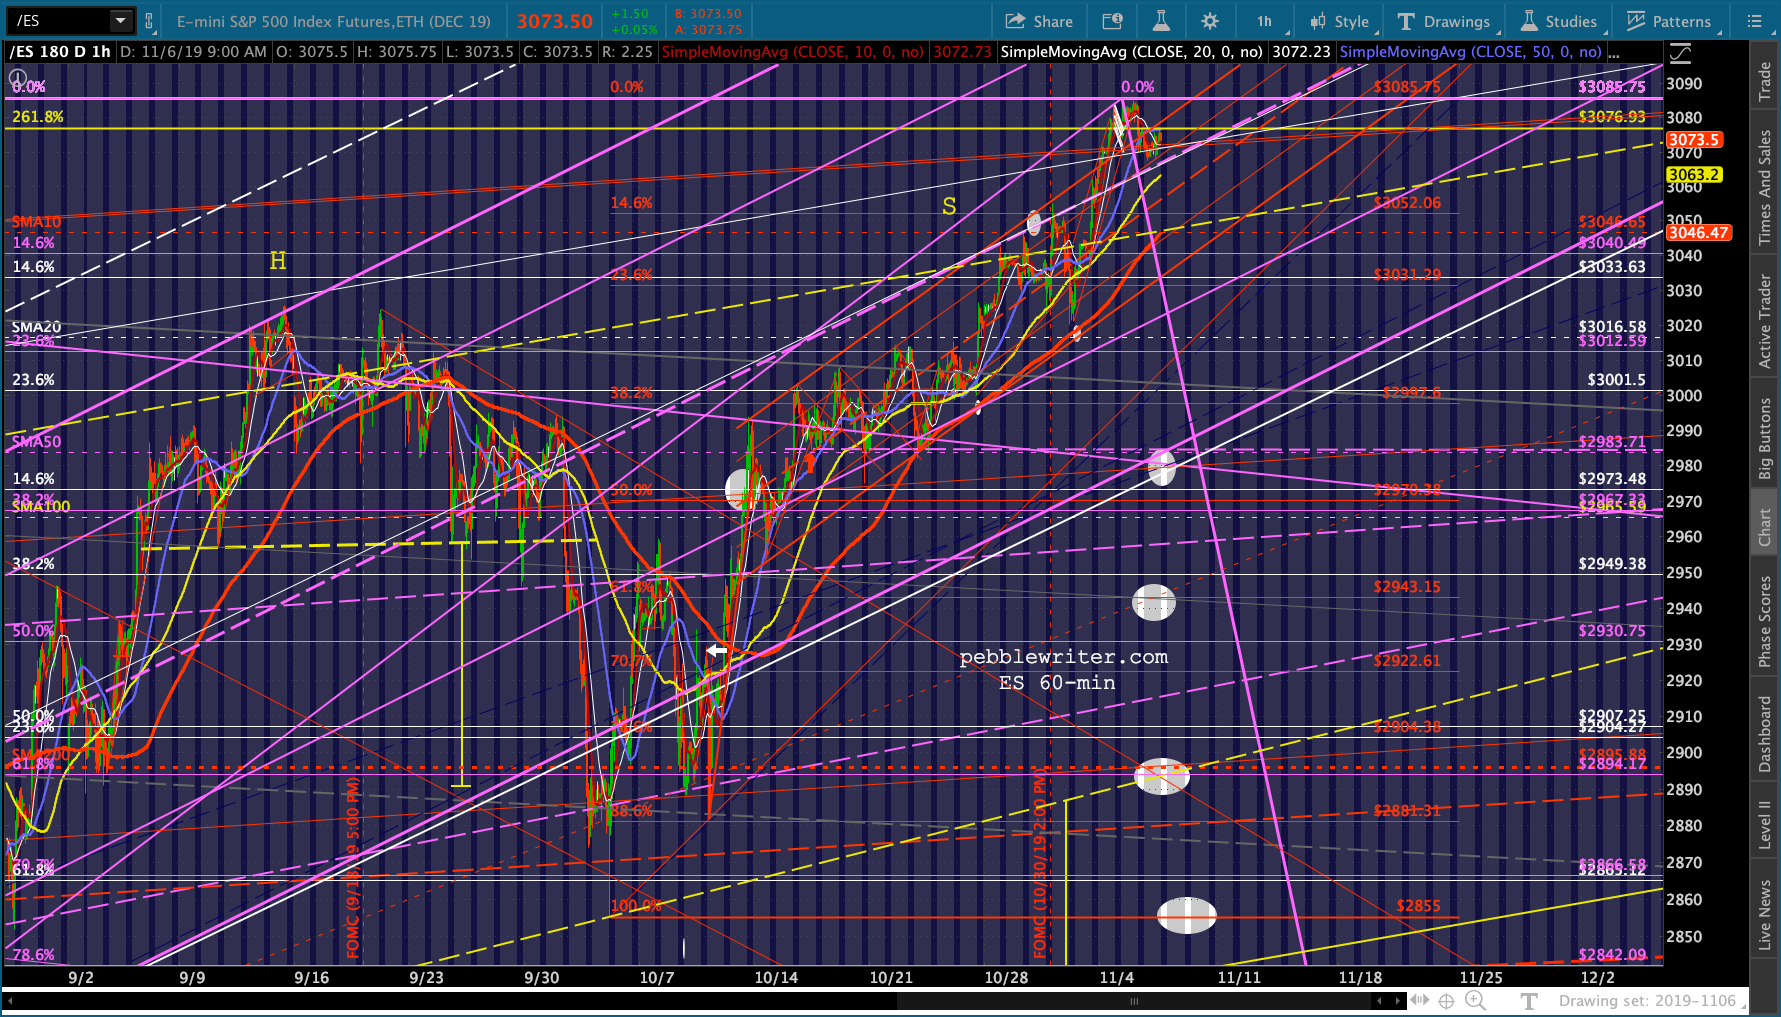 SPX is still sitting safely above its 2.618 but is likely to backtest it as soon as the SMA10, now at 3014.78, arrives.
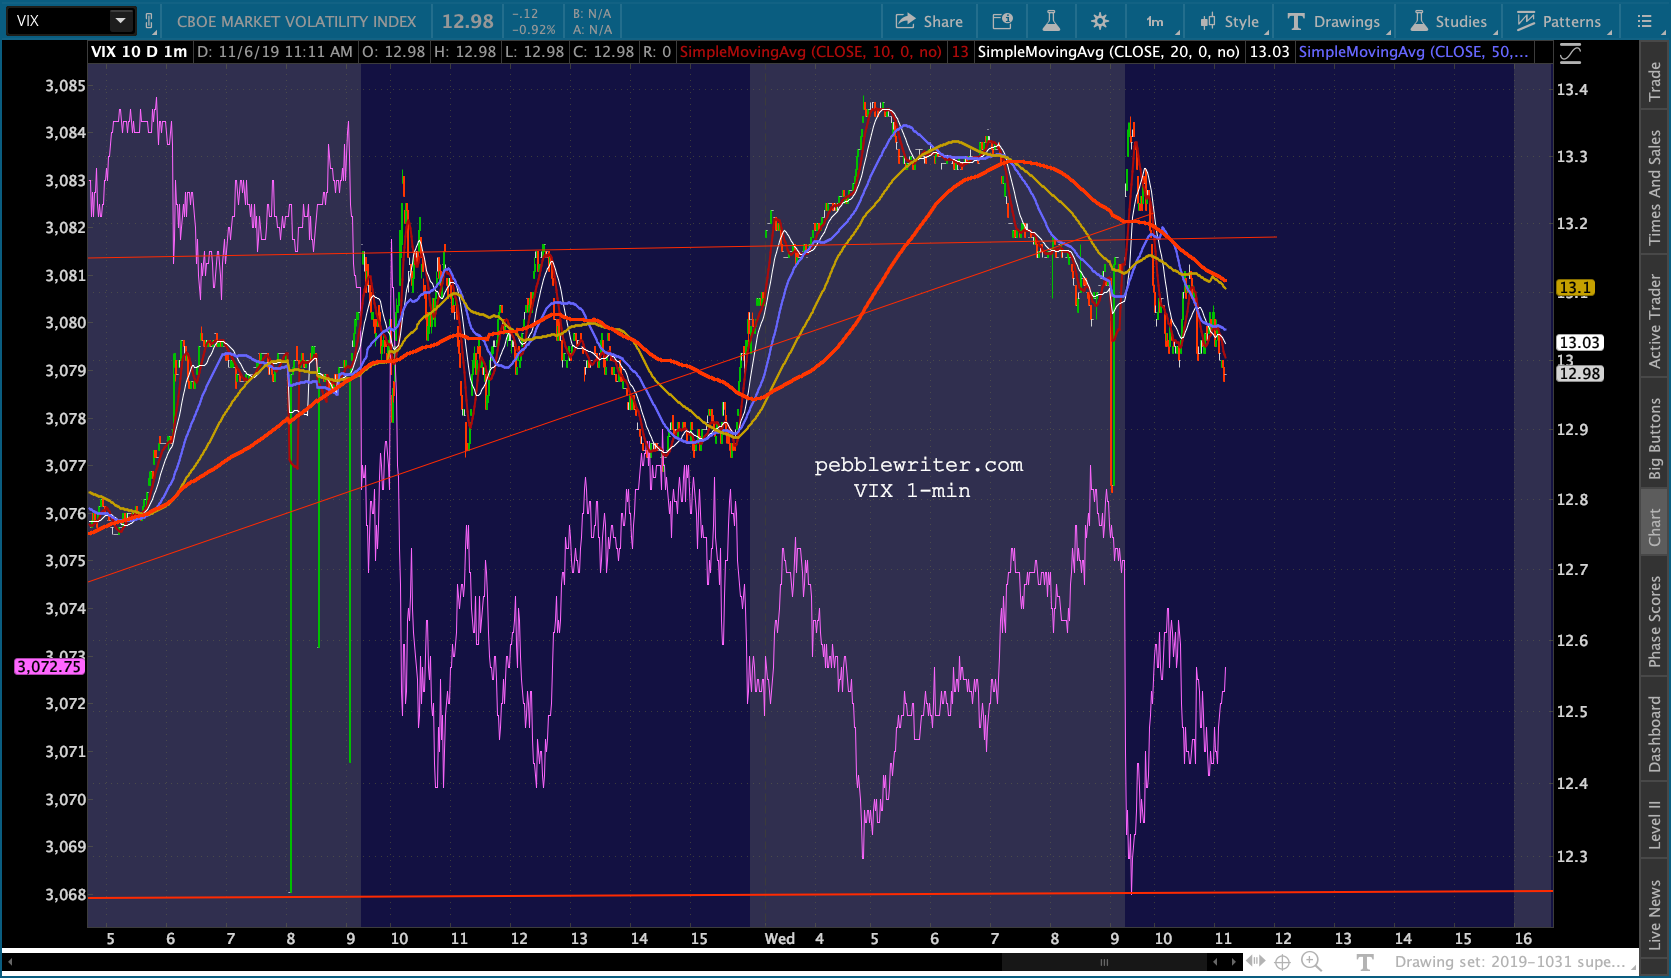
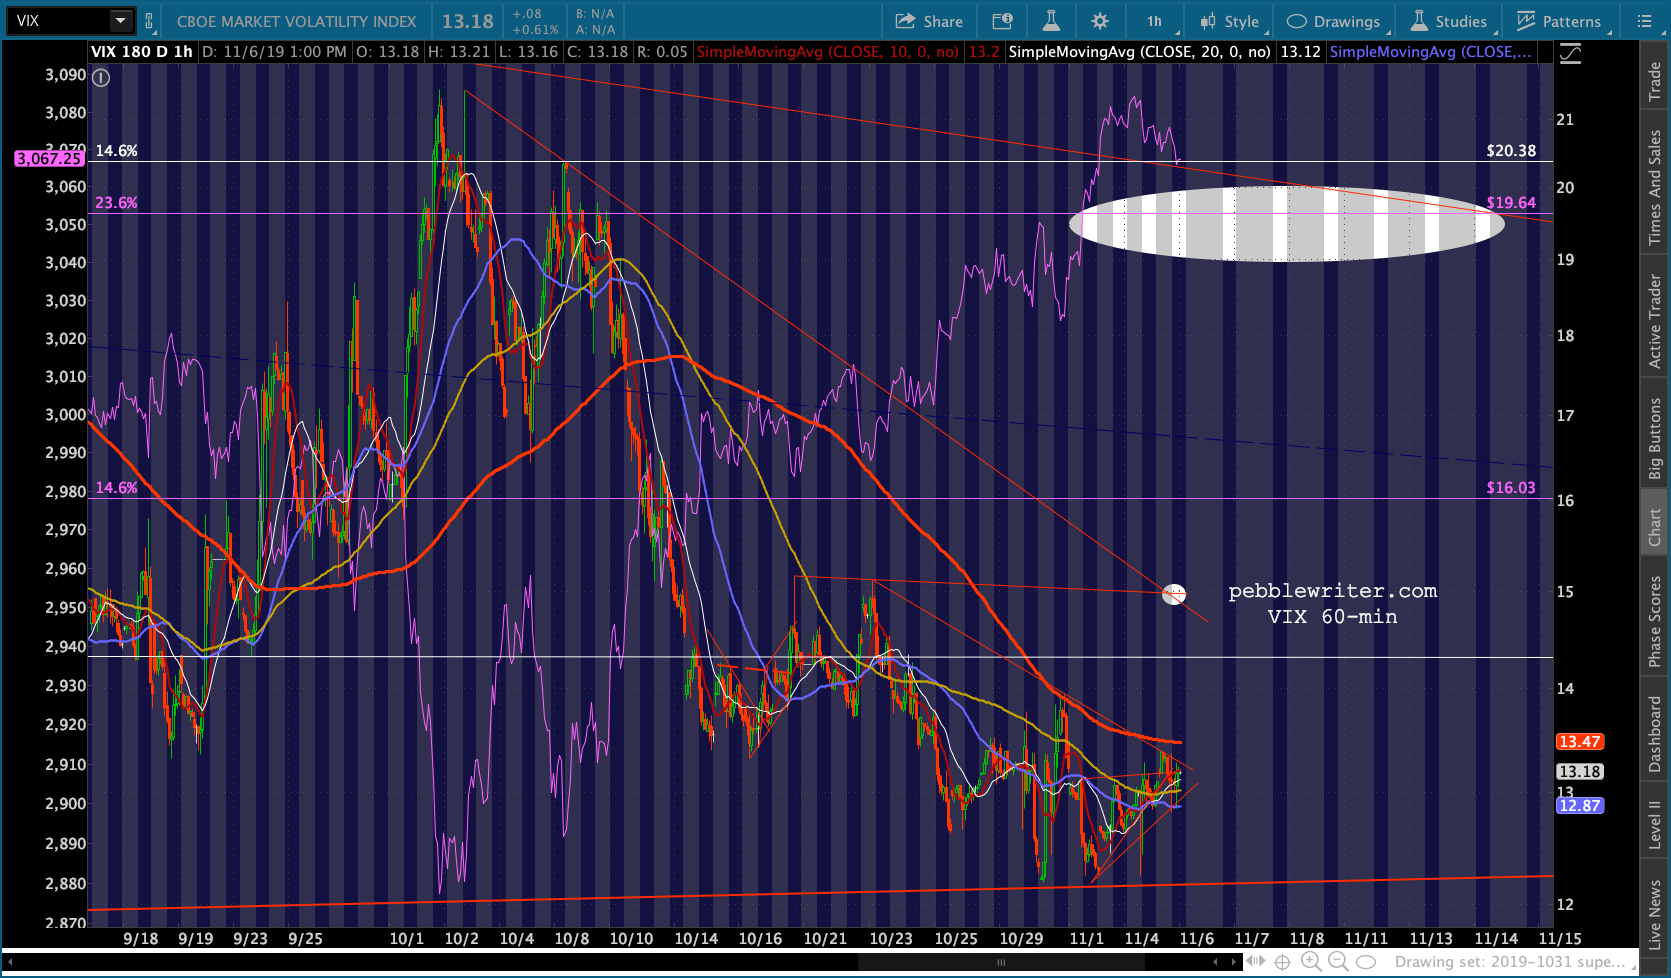
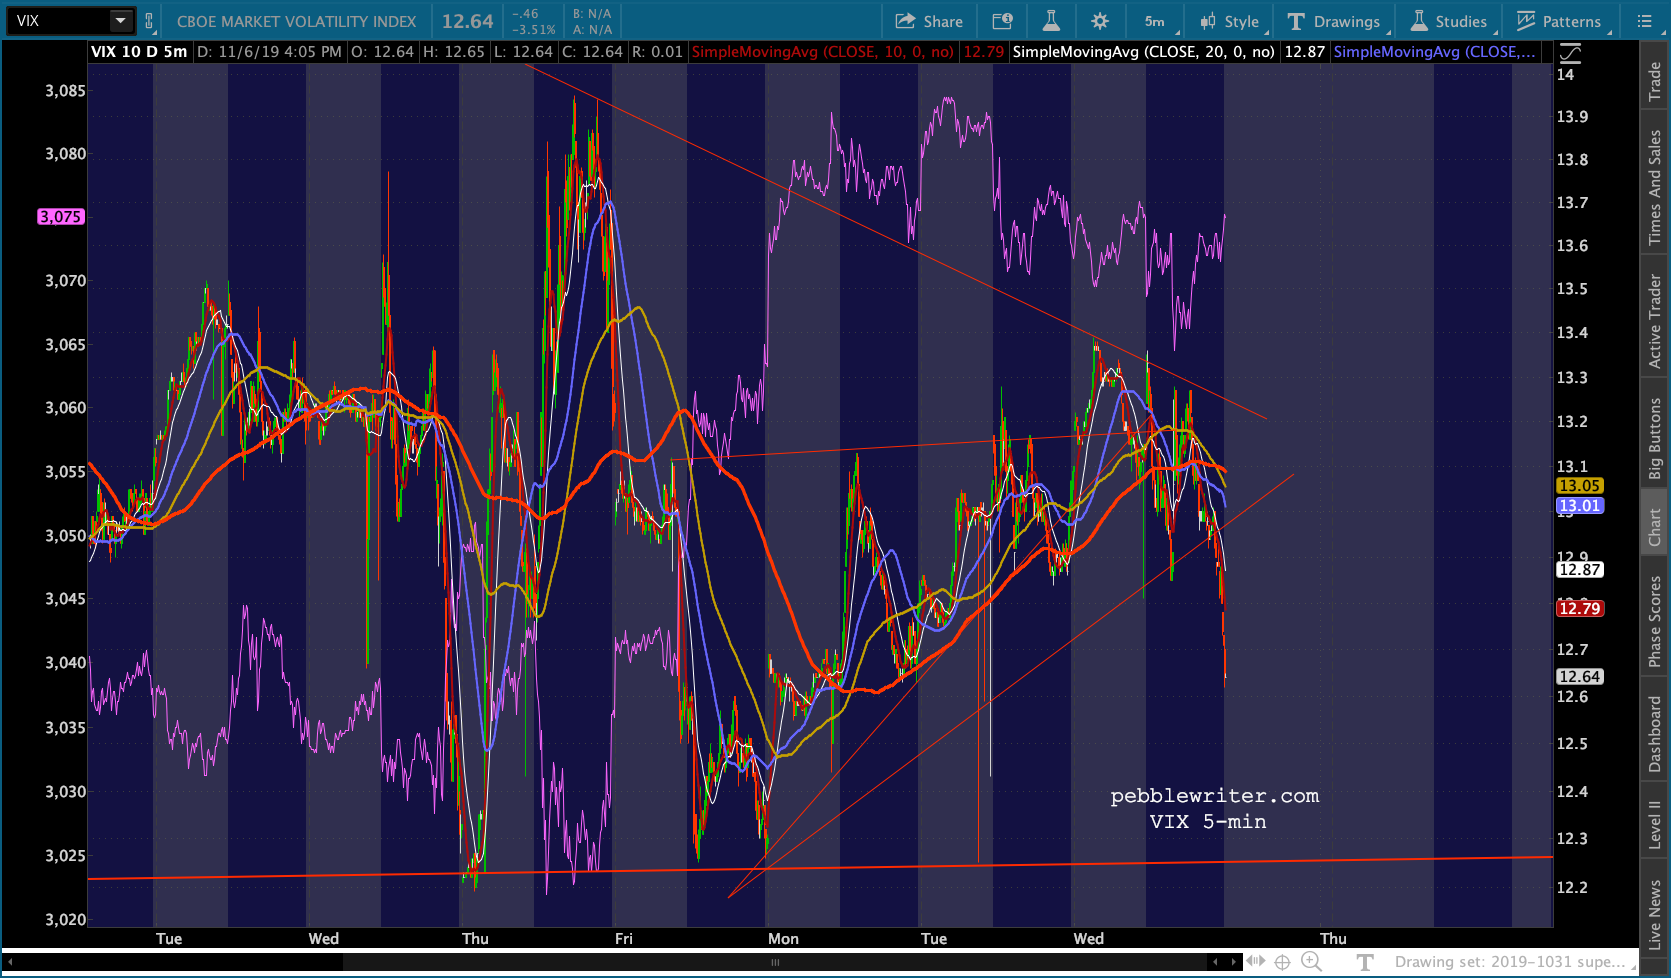
 VIX is still toying with this triangle, alternatively breaking out and breaking down depending on whether stocks need a boost or need reining in.
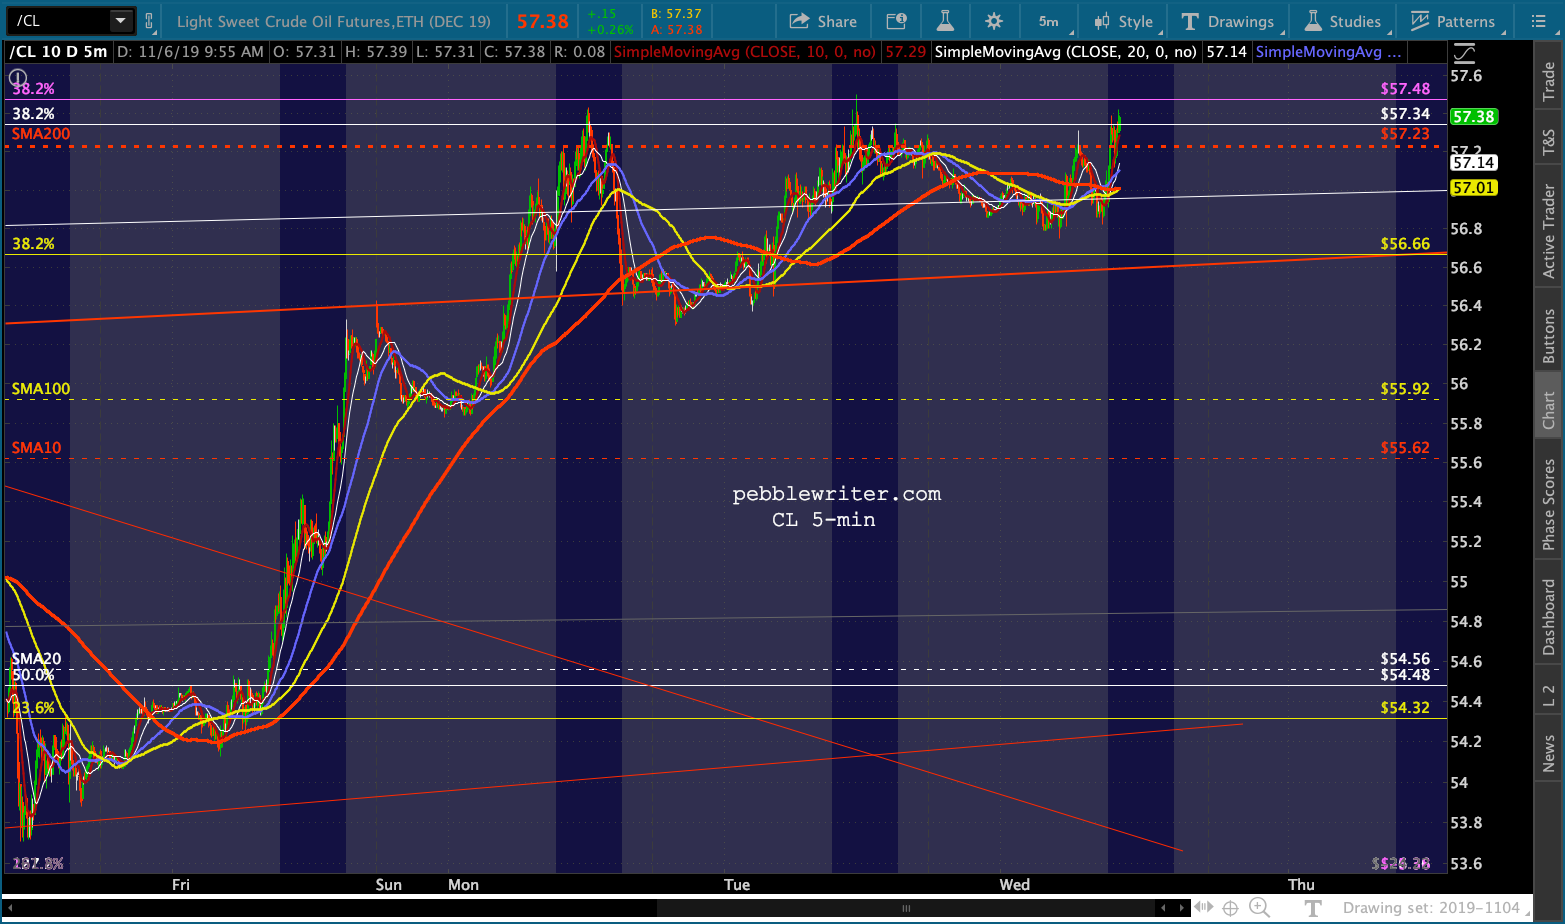
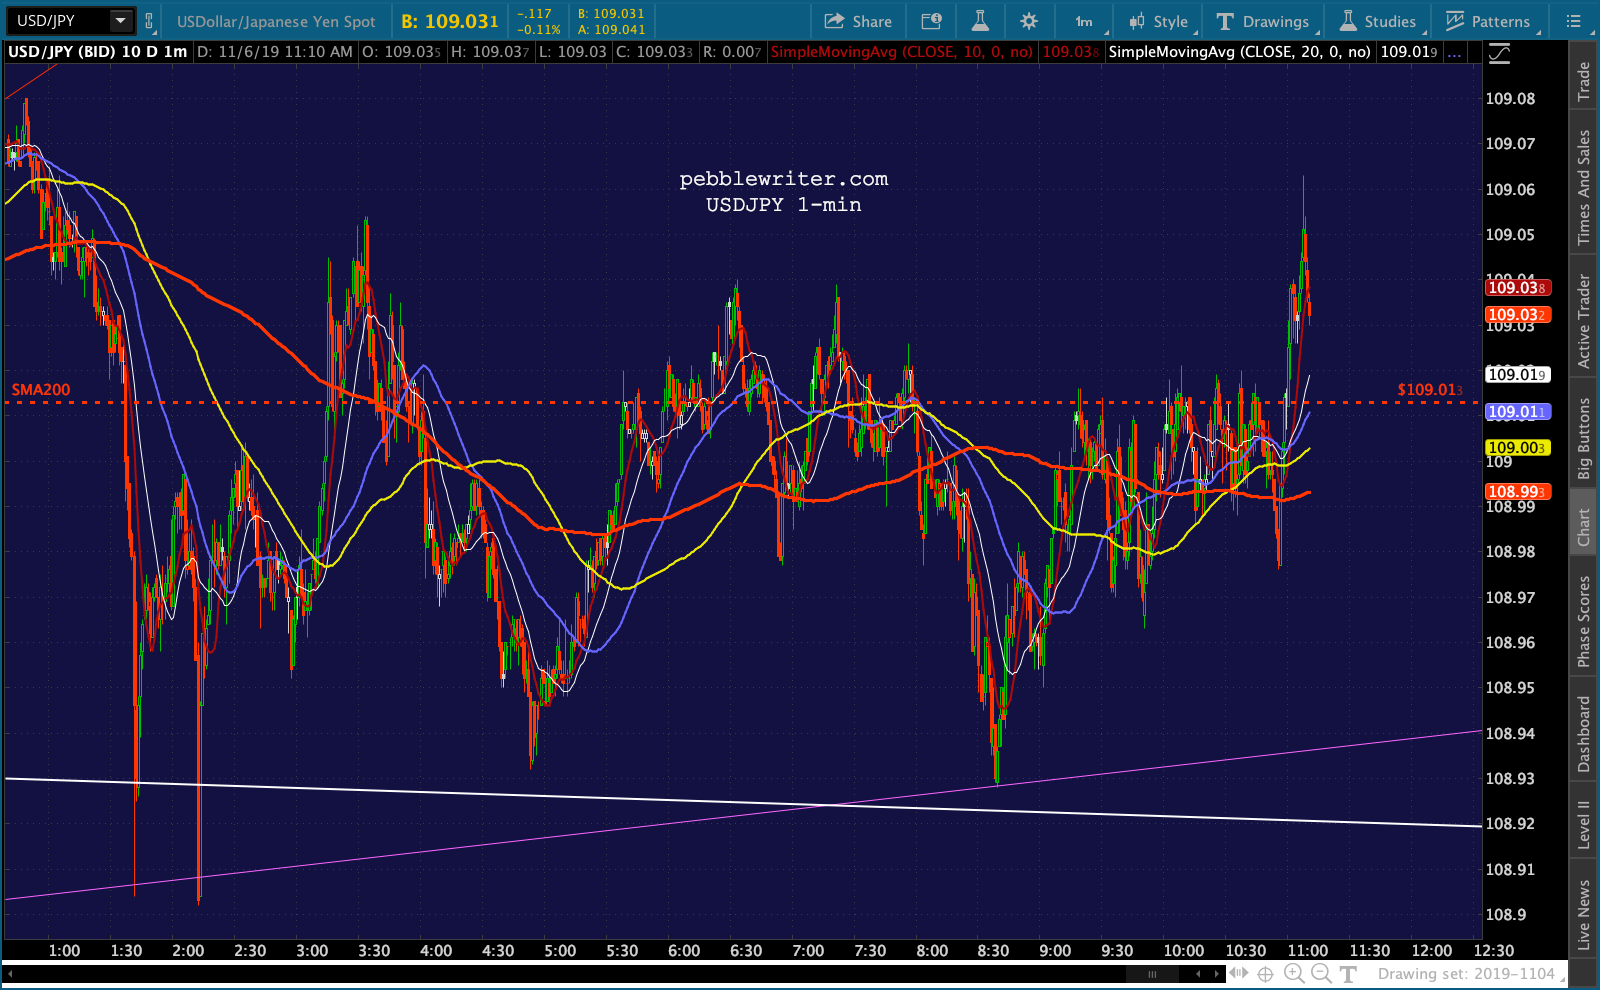
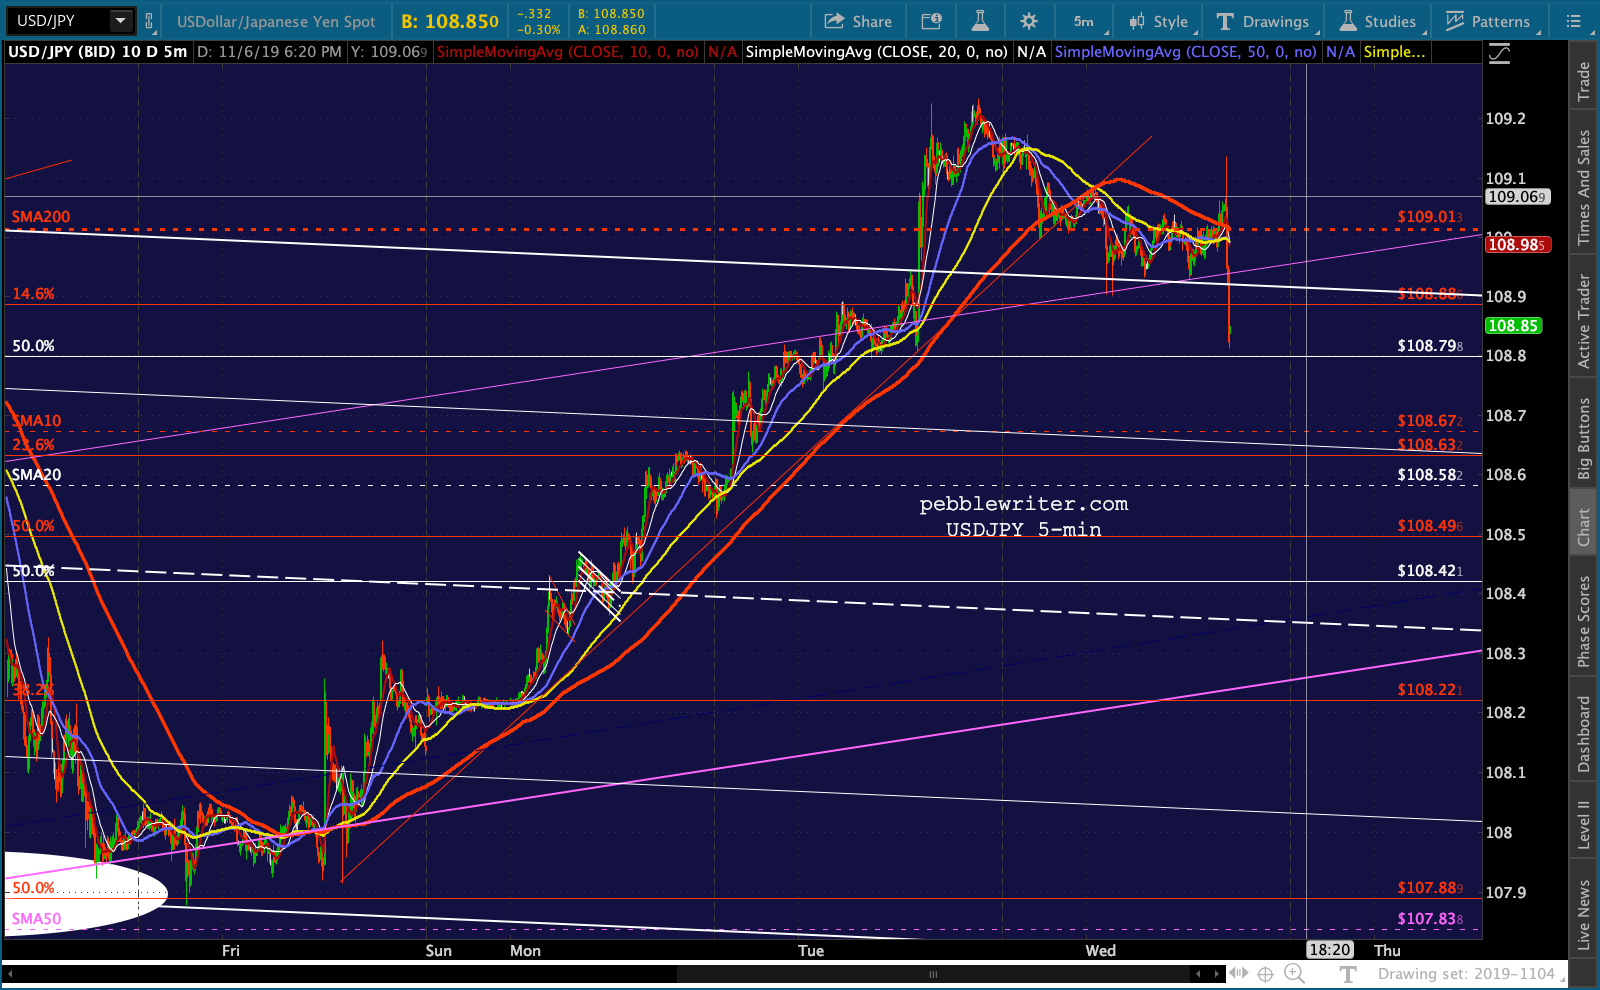
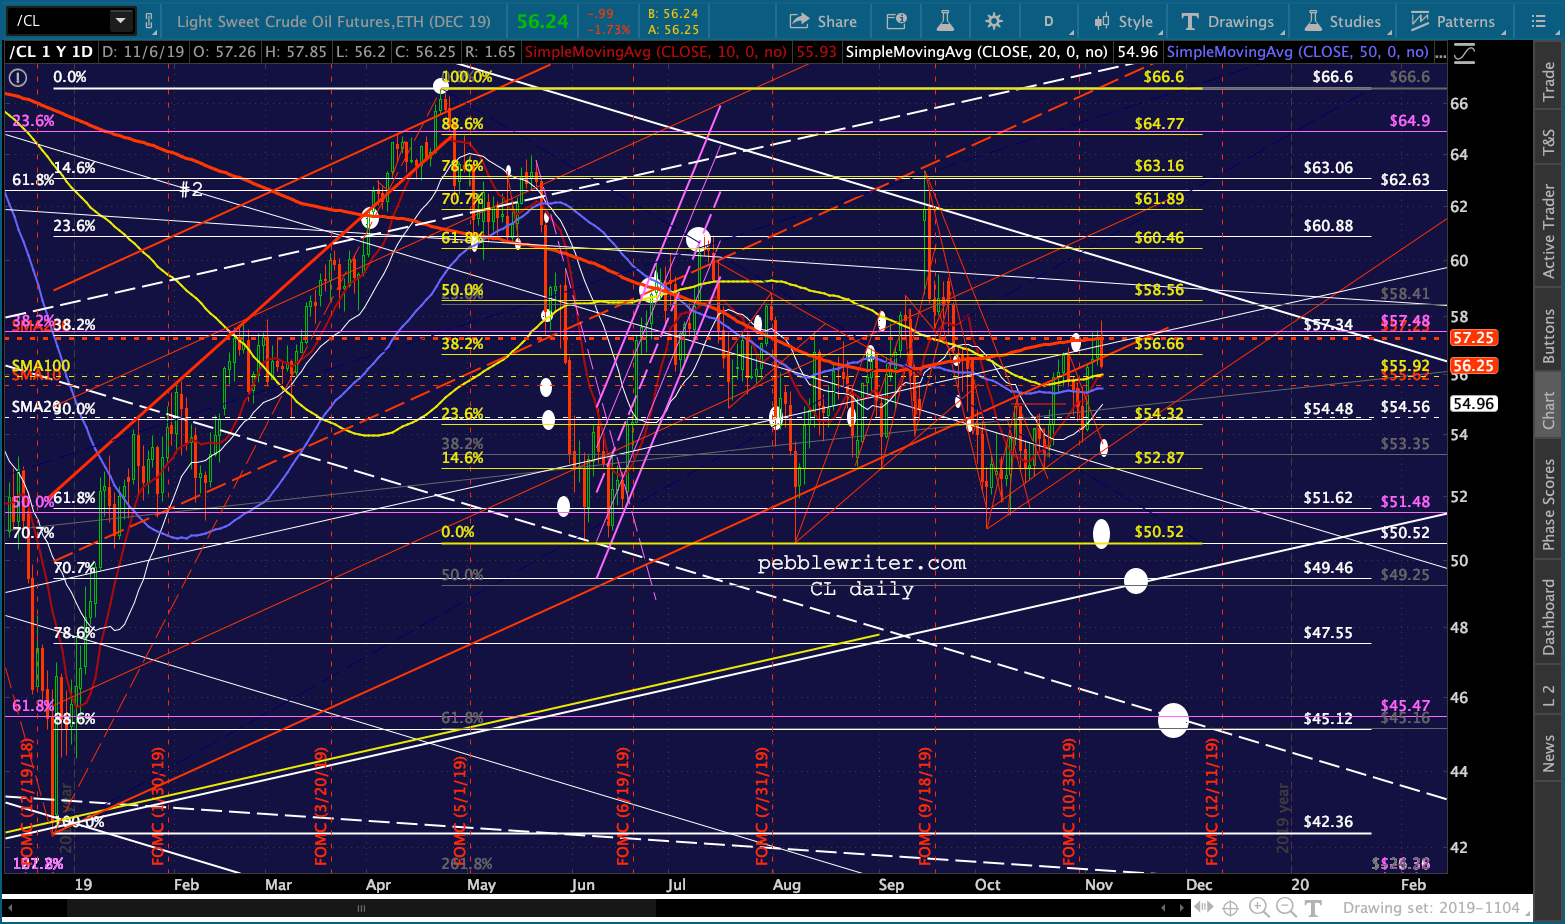
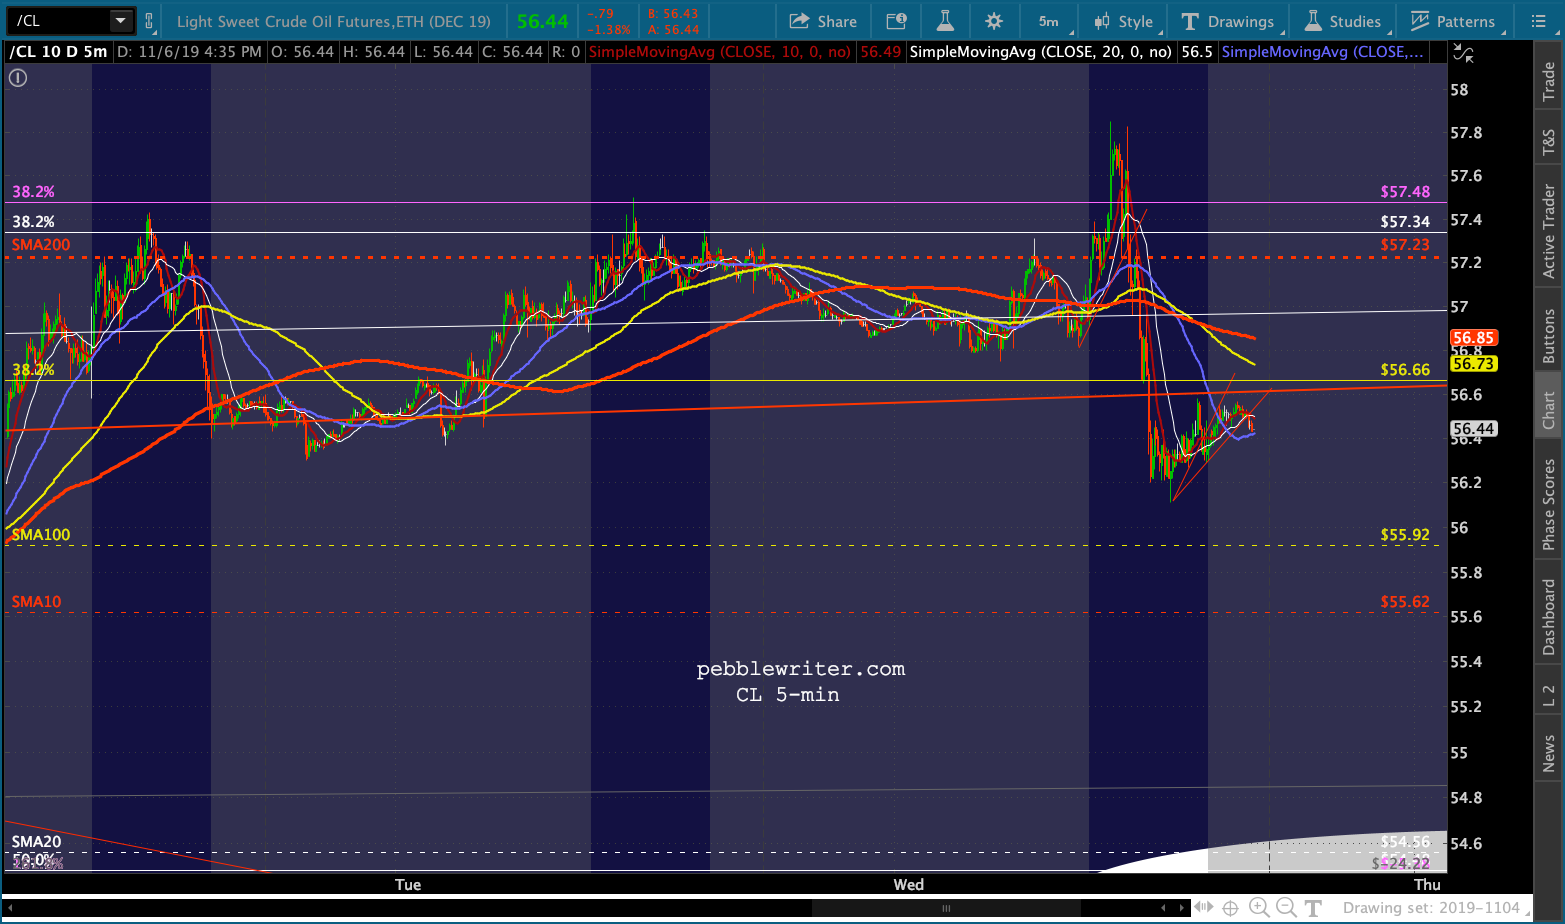
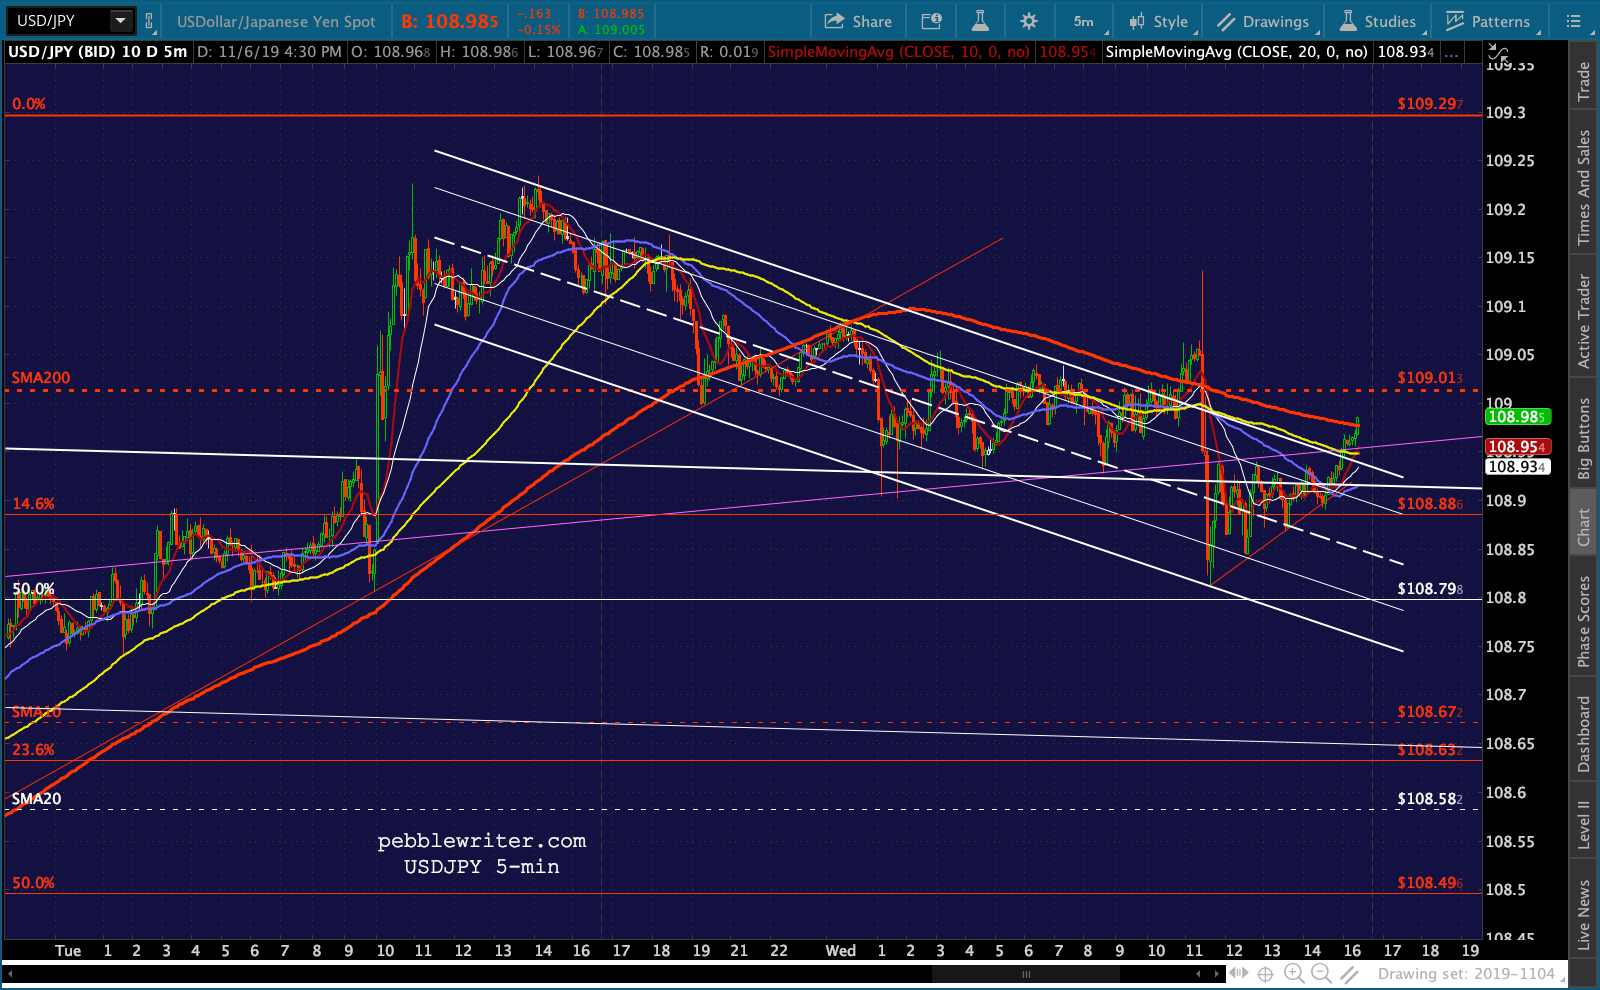
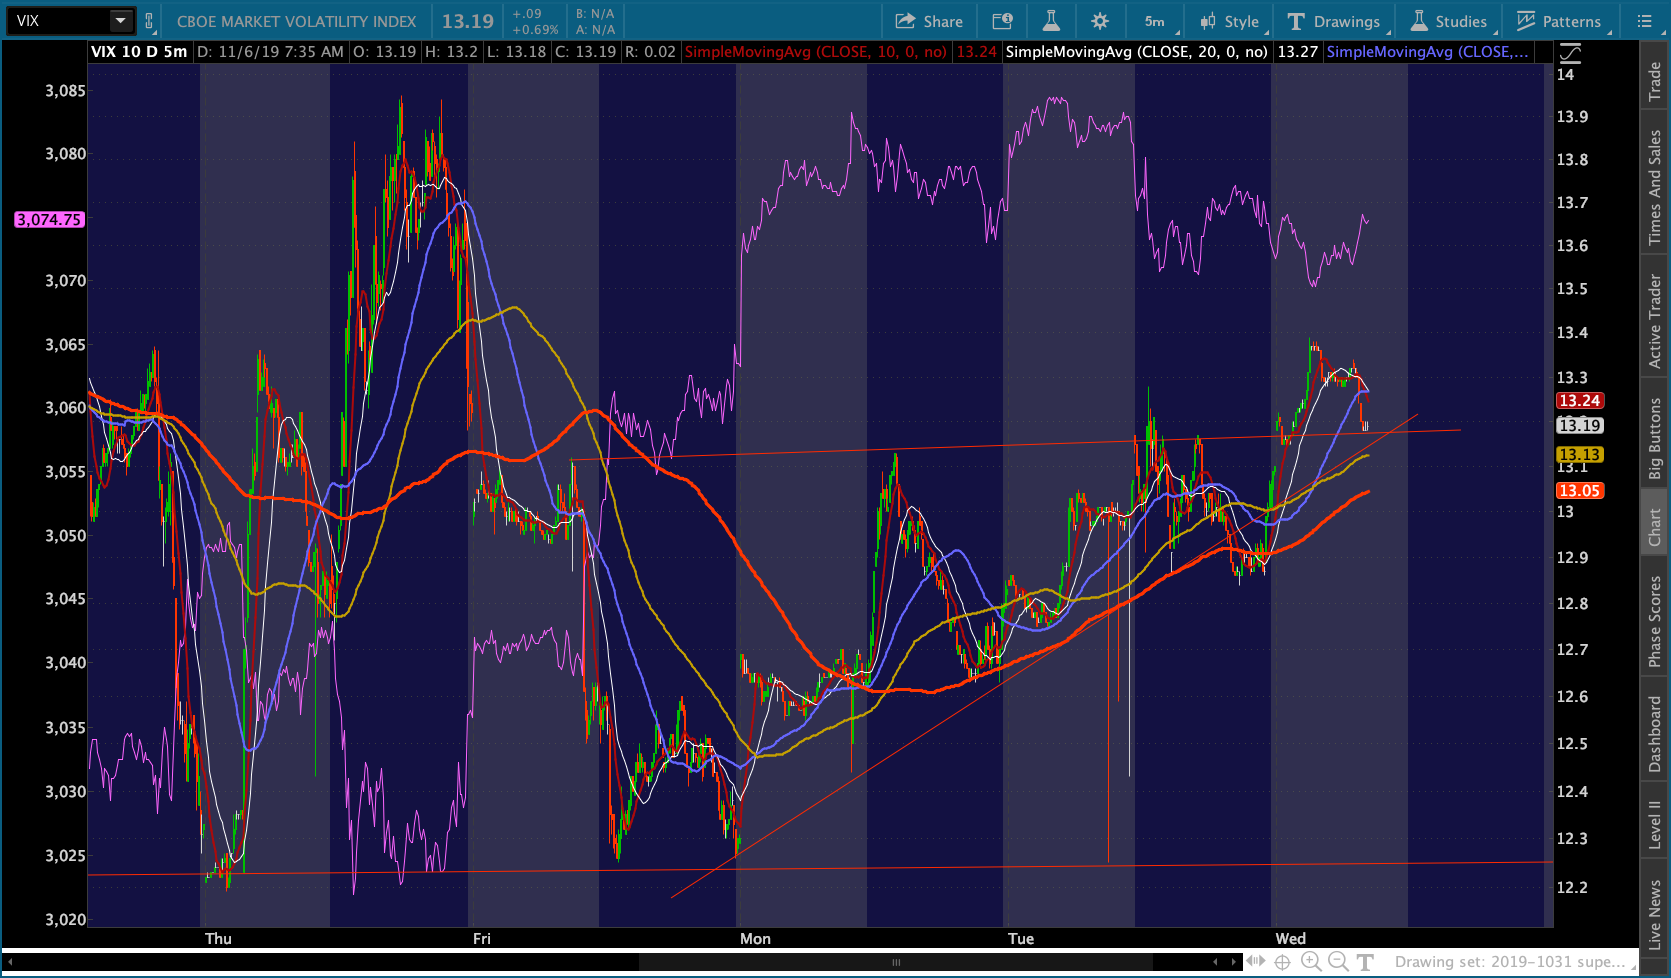 CL and USDJPY are both in a very similar situation – sitting right at their SMA200s, threatening to break out, which has very effectively managed to keep the bears at bay.
 Why the holding pattern? It would be very easy to smash VIX down to 11 or 12 and send SPX/ES much higher. But, it hasn’t happened. On the other hand, a breakdown has been prevented over and over again.
I would like to address one tidbit of info which popped onto my radar: the rumor that Deutsche Bank is filing bankruptcy. From what I gather, this initially popped up on 4chan and was since picked up on Reddit as well as numerous doomster blogs and youtube channels.
The comparison to Lehman’s fate has been charted by many people, recently showing up in a Bloomberg interview.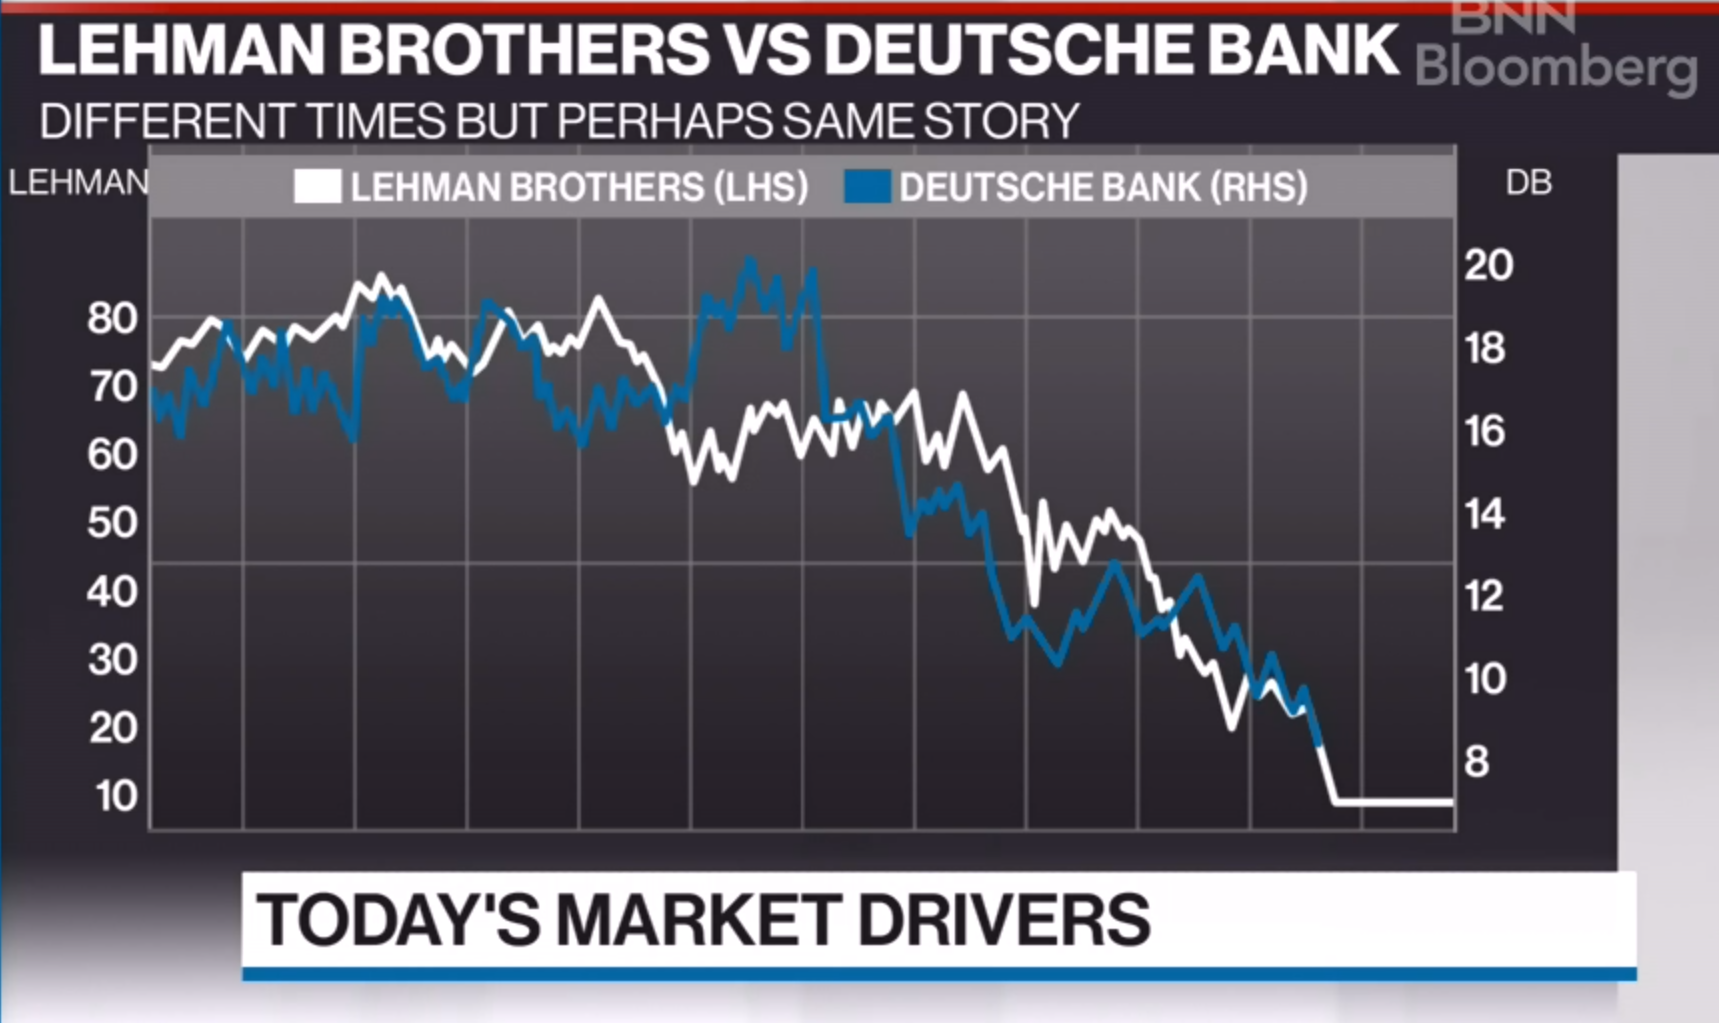 I have no inside information on whether DB is going bankrupt. I’m almost positive that if it is, it won’t be called a bankruptcy but, rather, a reorganization which will be heavily supported by the ECB.
I’ve written countless times before that DB is already technically bankrupt. But, because it has been allowed to avoid marking assets to market, it can avoid the label and, more importantly, the $48 trillion in (much of it underwater) derivatives aren’t unleashed on the markets to precipitate the next GFC.
Could they avoid a meltdown? Probably. But, it could definitely spook the market.
UPDATE: 10:35 AM
Today’s EIA inventory report confirmed yesterday’s API: way too much oil. The net draw in gasoline didn’t even begin to offset it.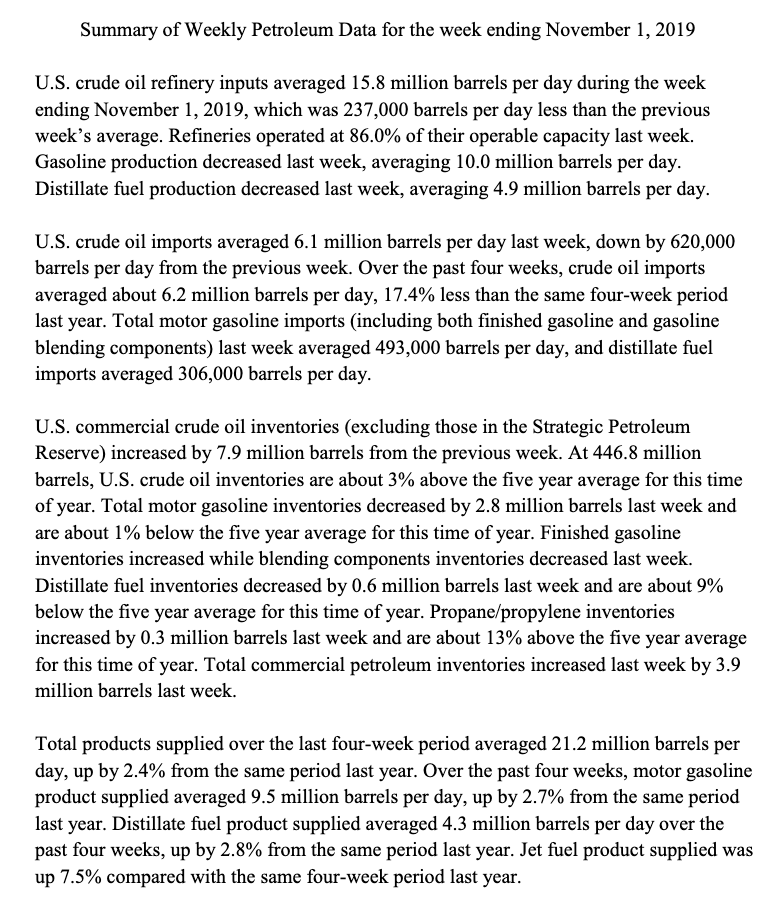 In a great example of just how manipulated things are, CL popped well above its SMA200 in the minutes leading up to the release so that its subsequent fall could be arrested at SMA200 support.
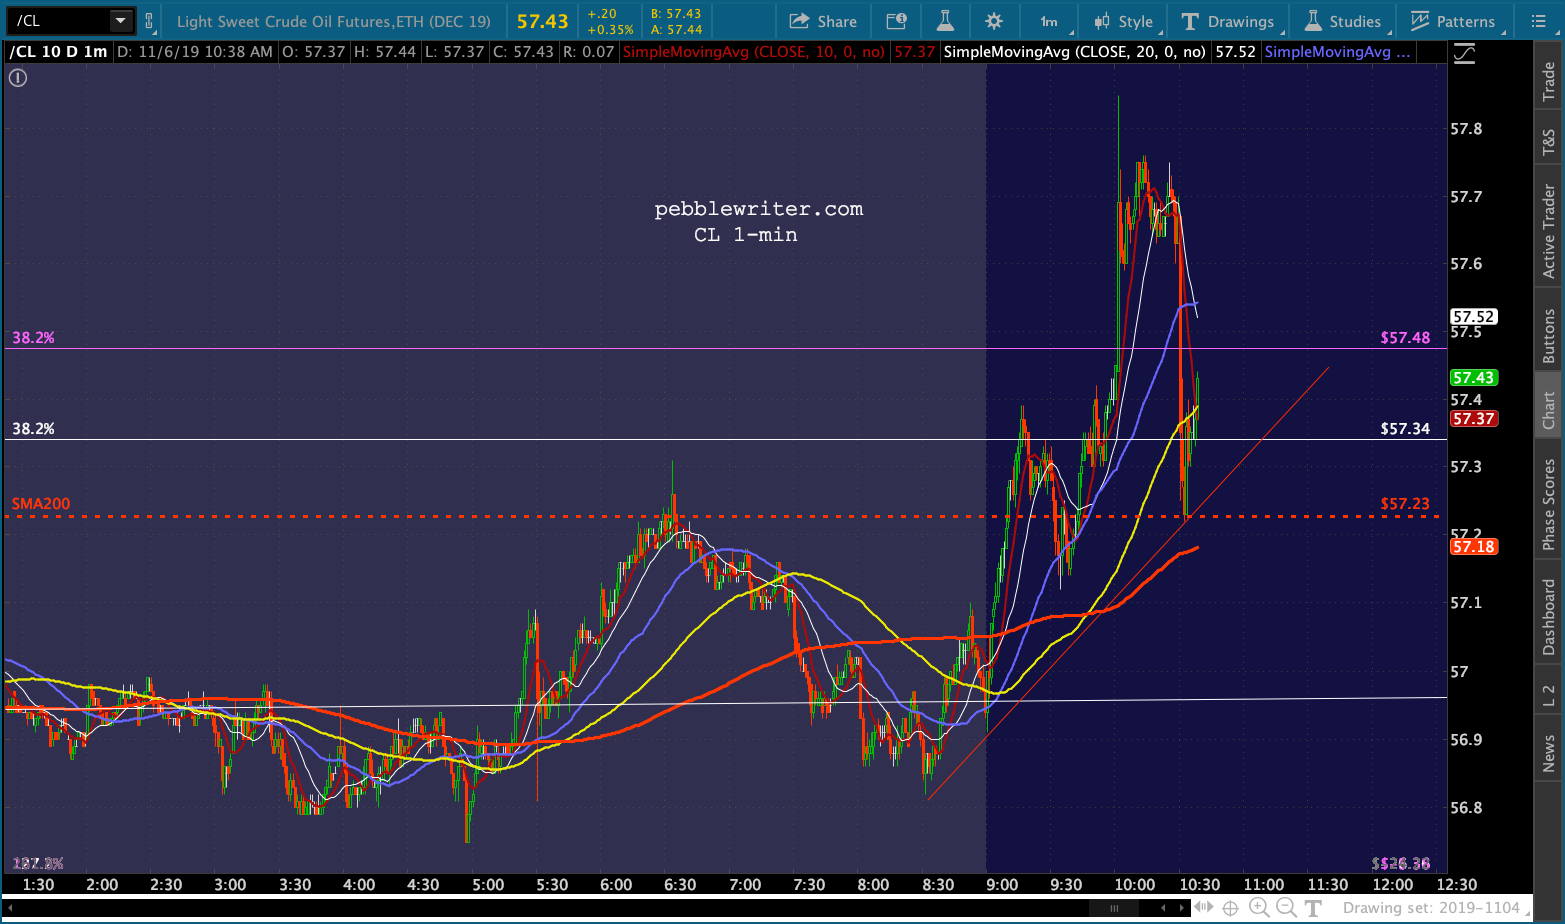 Naturally, it was accompanied by a sudden dip in VIX…
 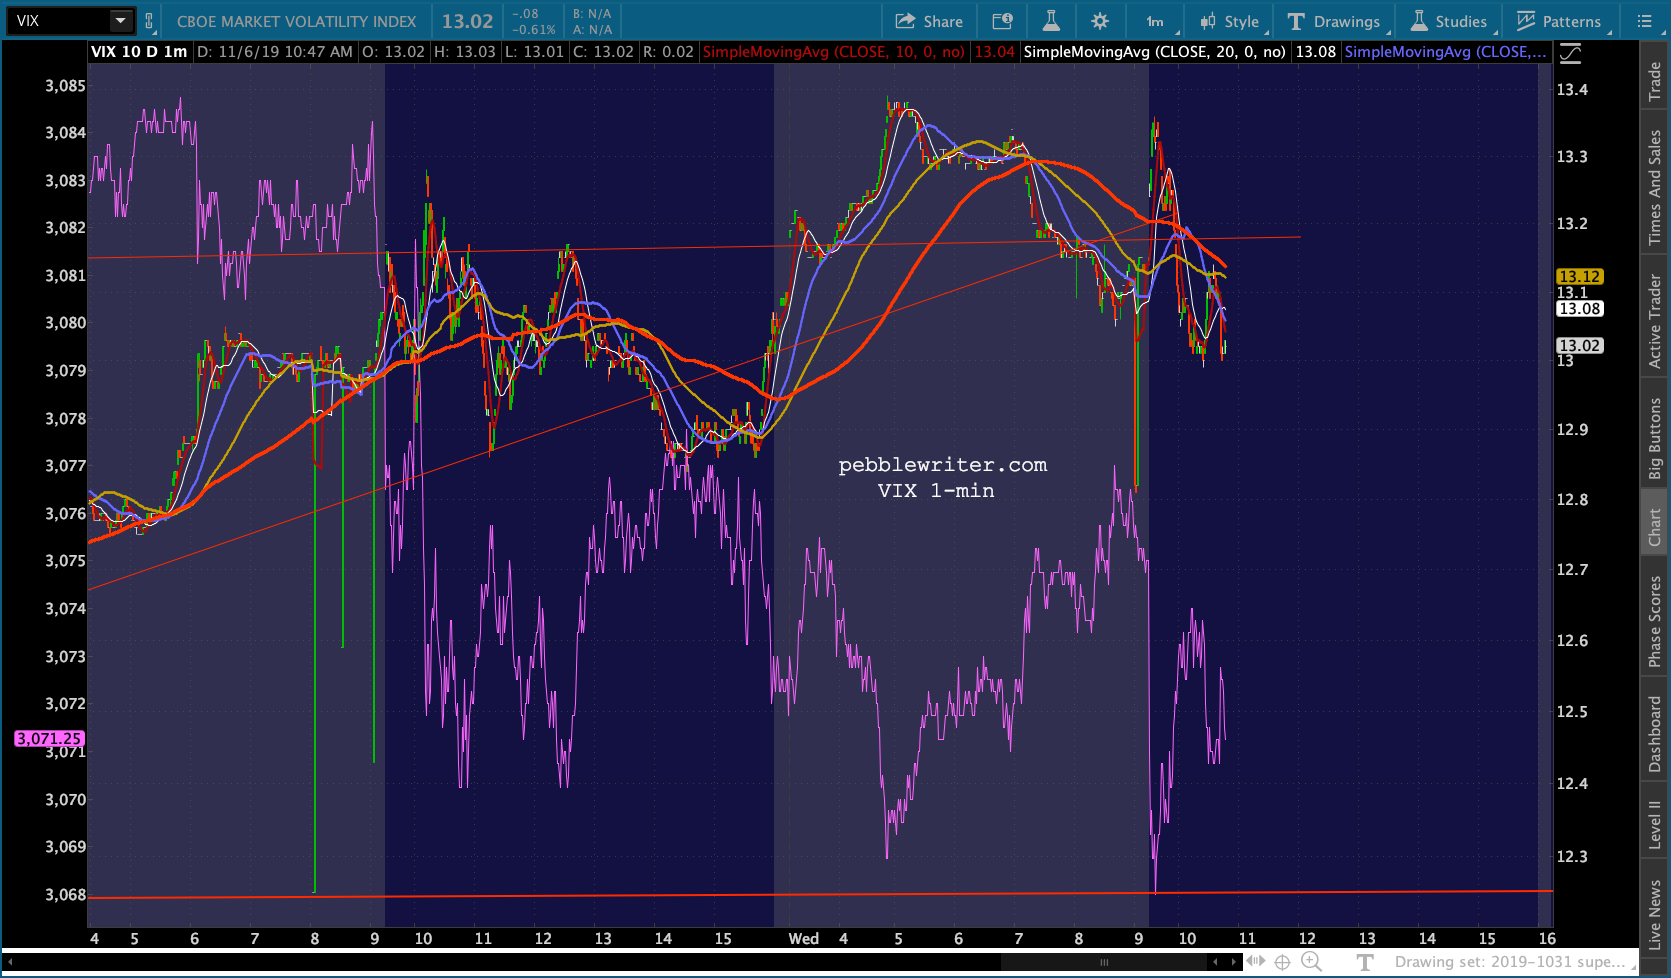 …to ensure that stocks were unaffected.
 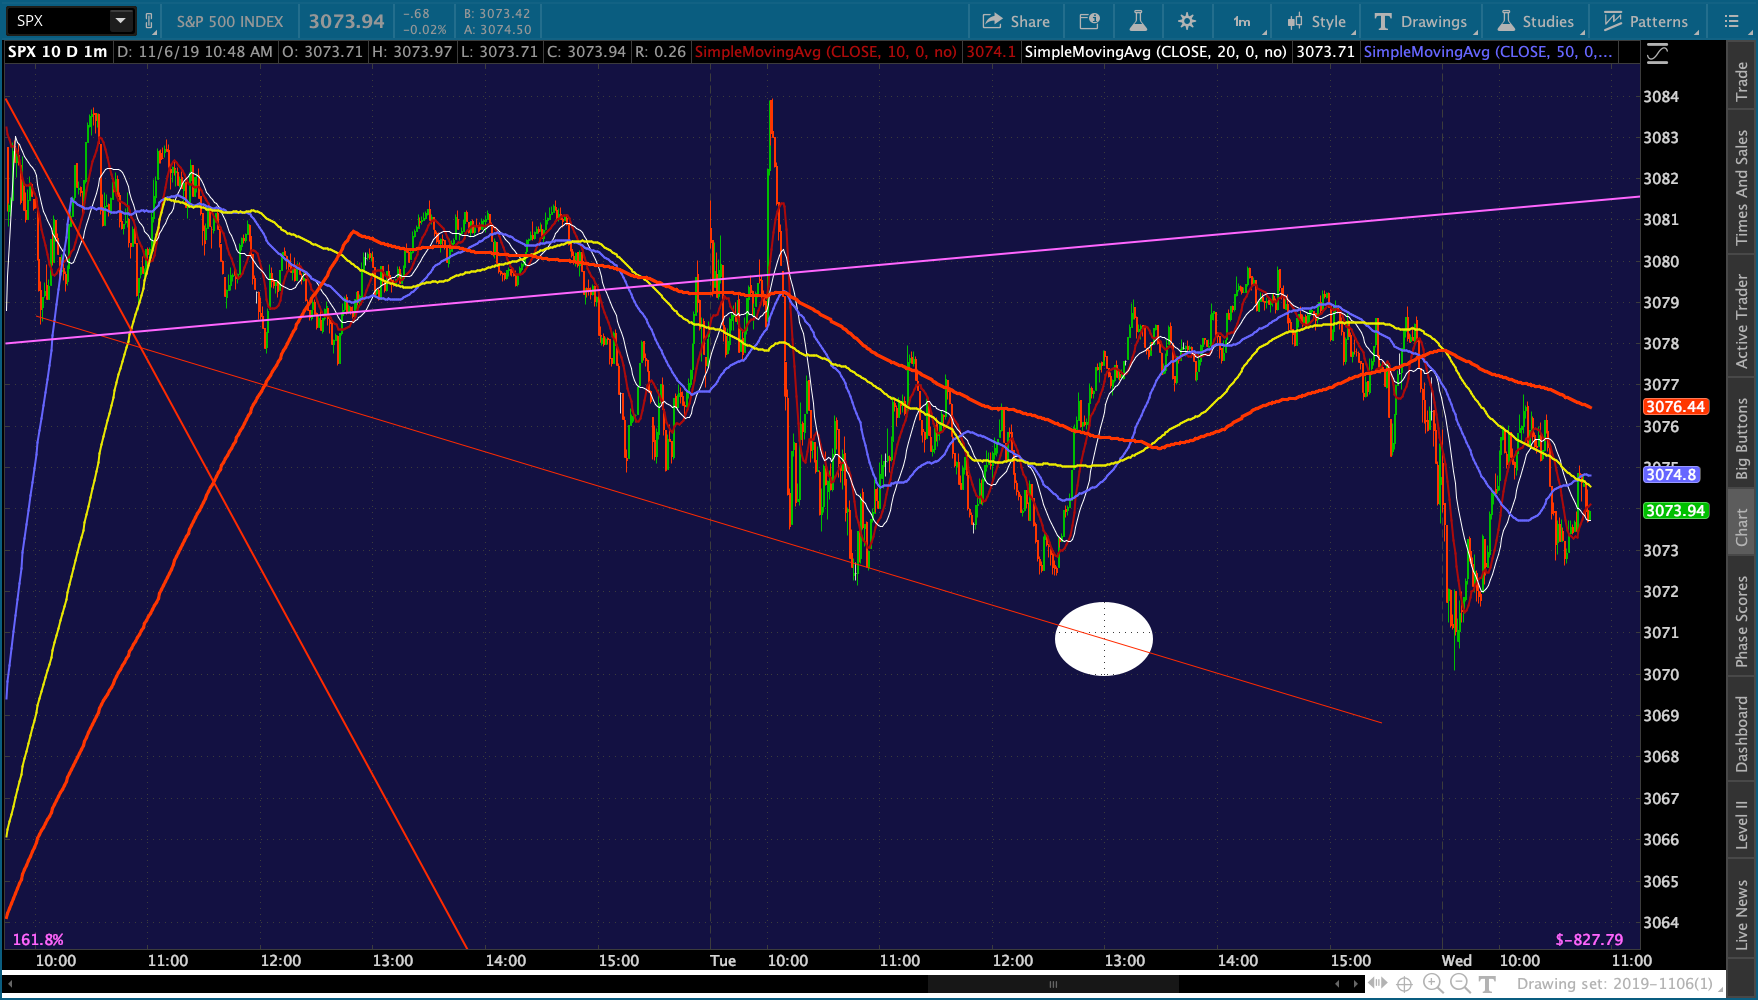 Cue USDJPY’s breakout…
UPDATE: 11:11 AM
An efficient market…right.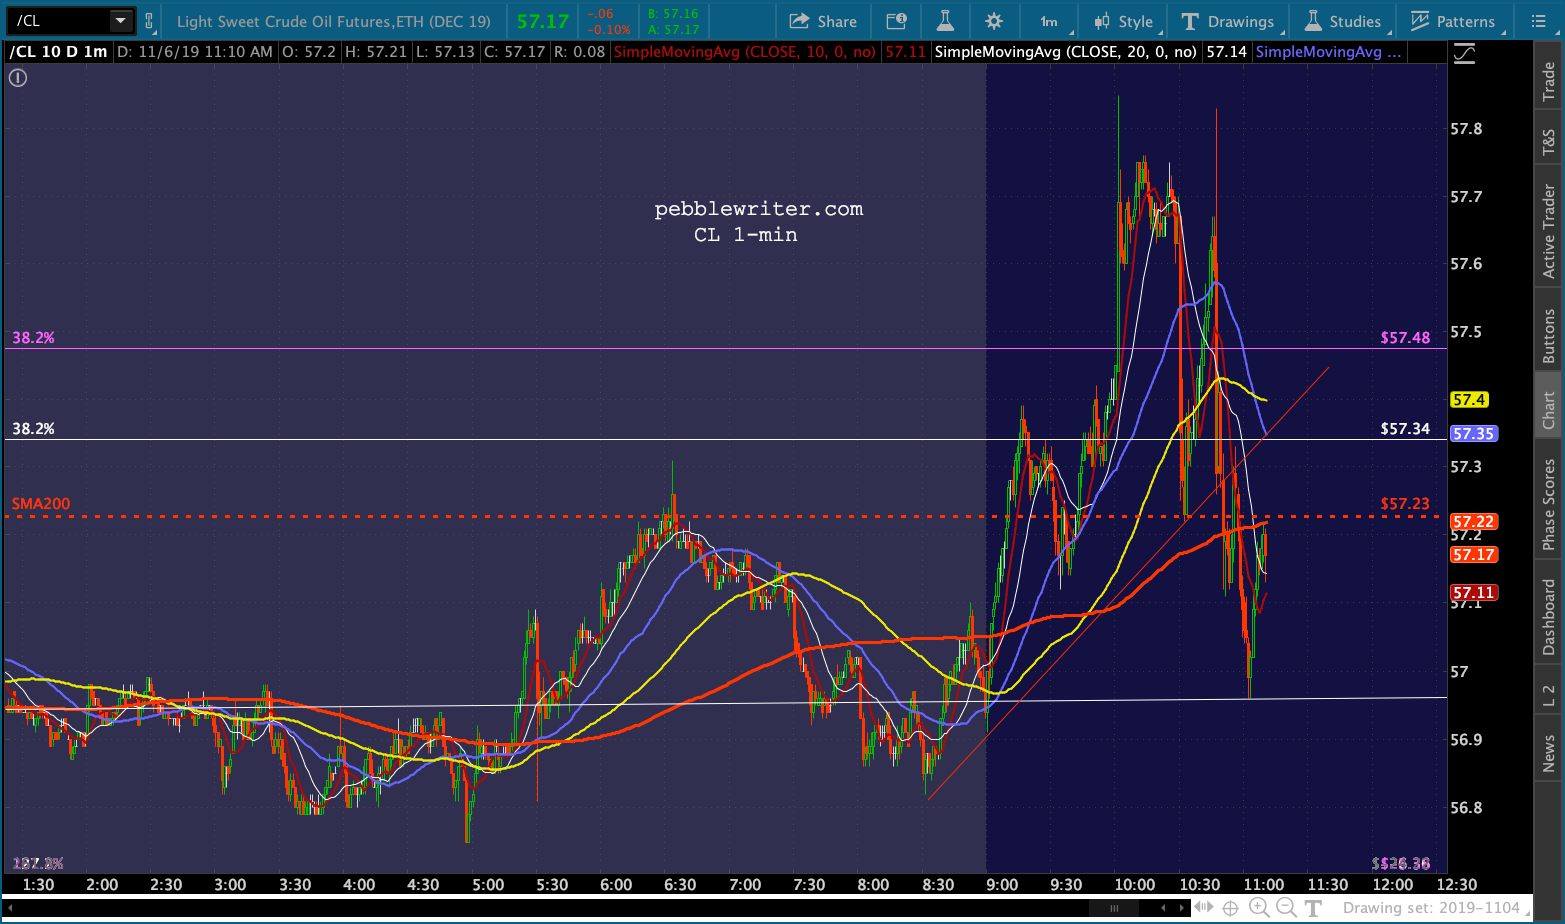
 The only efficient thing about it is that the pop in USDJPY and drop in VIX kicked in at exactly the right time. SPX should be back in the black any minute.
UPDATE: 11:55 AM
That was fast…rumors that trade talks might not be going so well broke a logjam — but SPX has reached TL support. 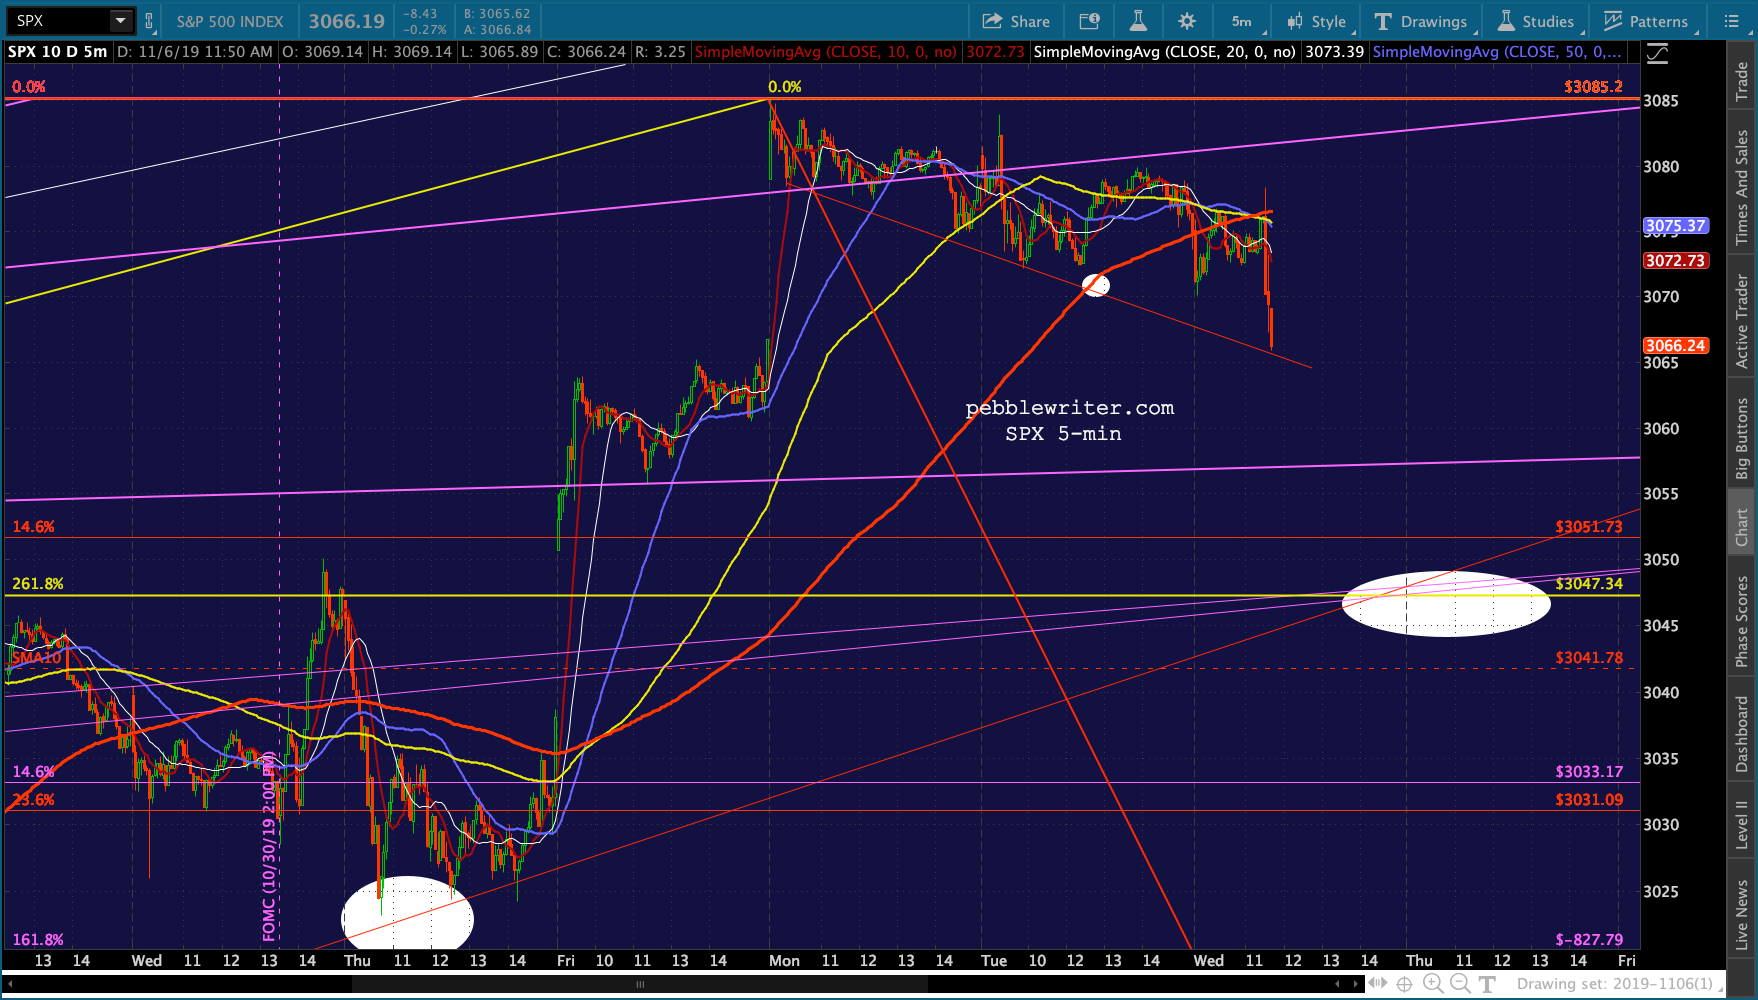 Looking for a breakdown of the TL, which will require that VIX breaks out for starters.
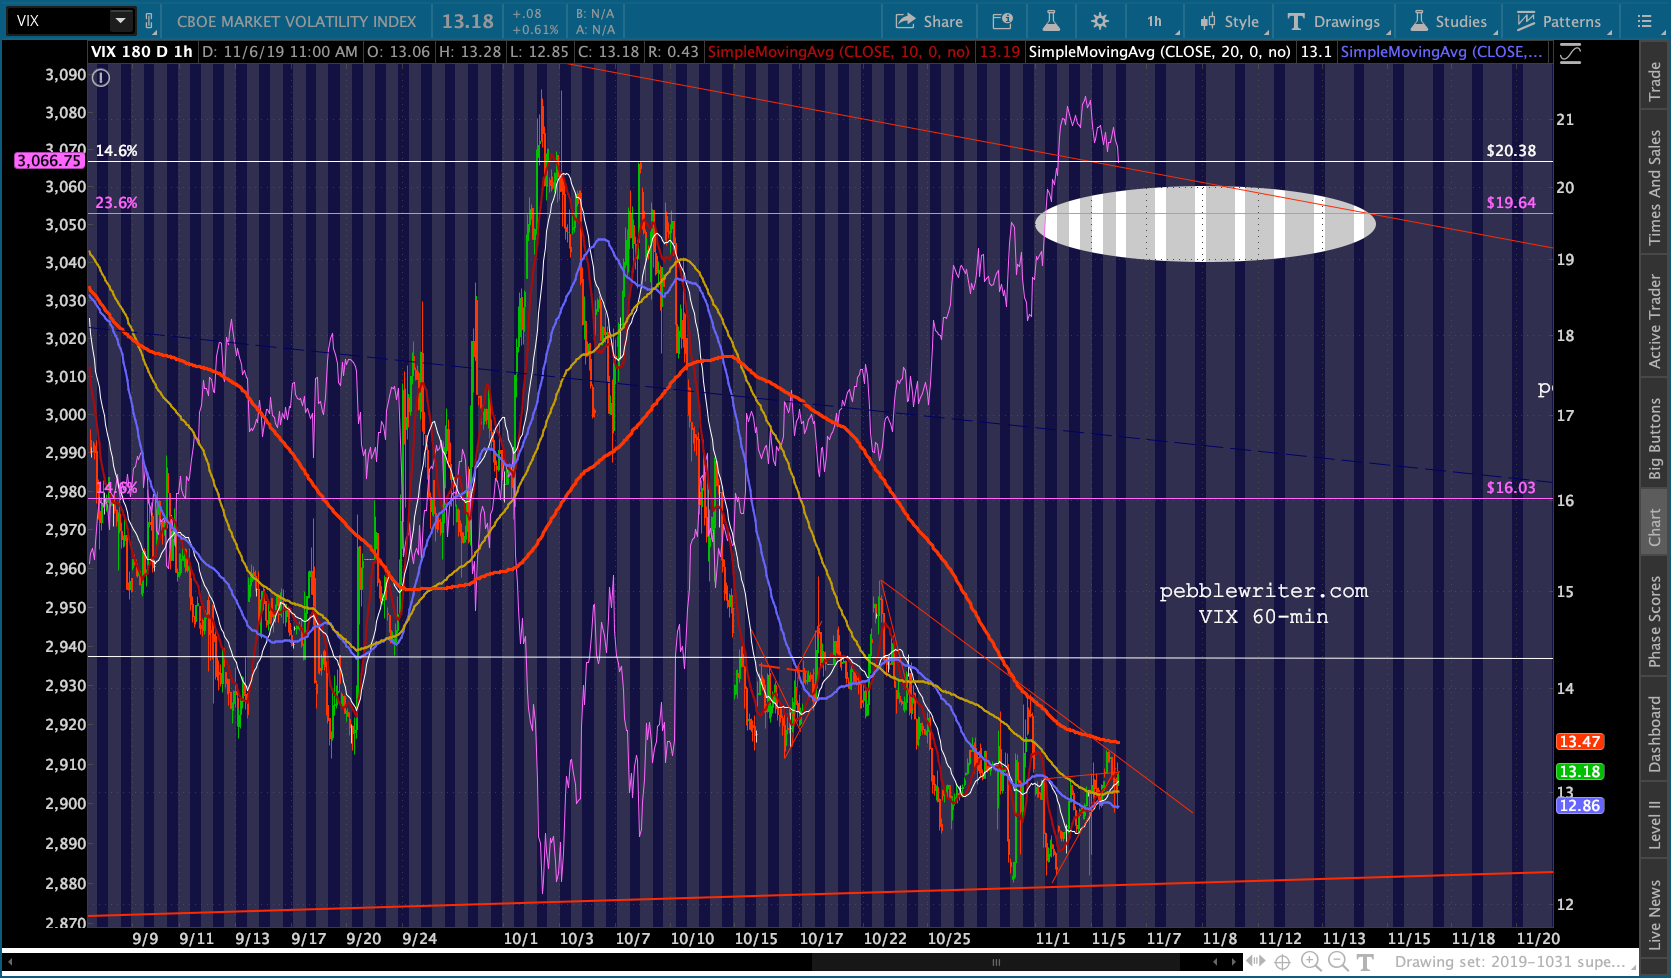
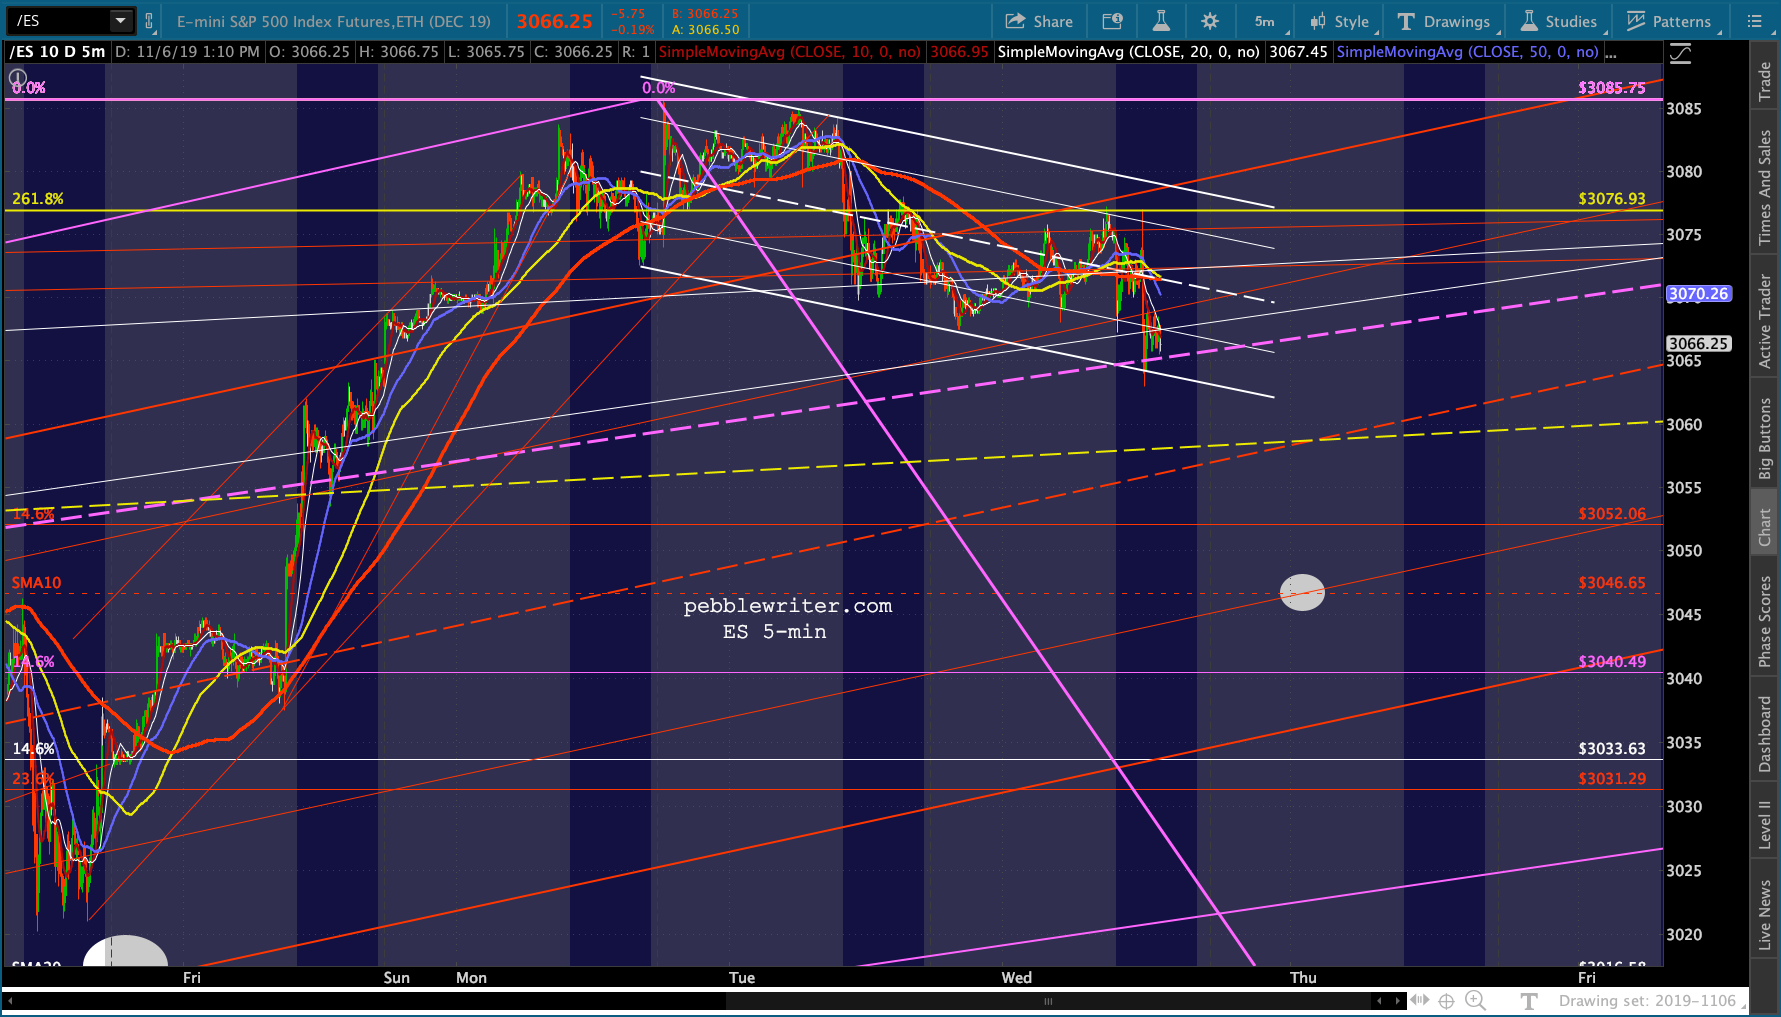
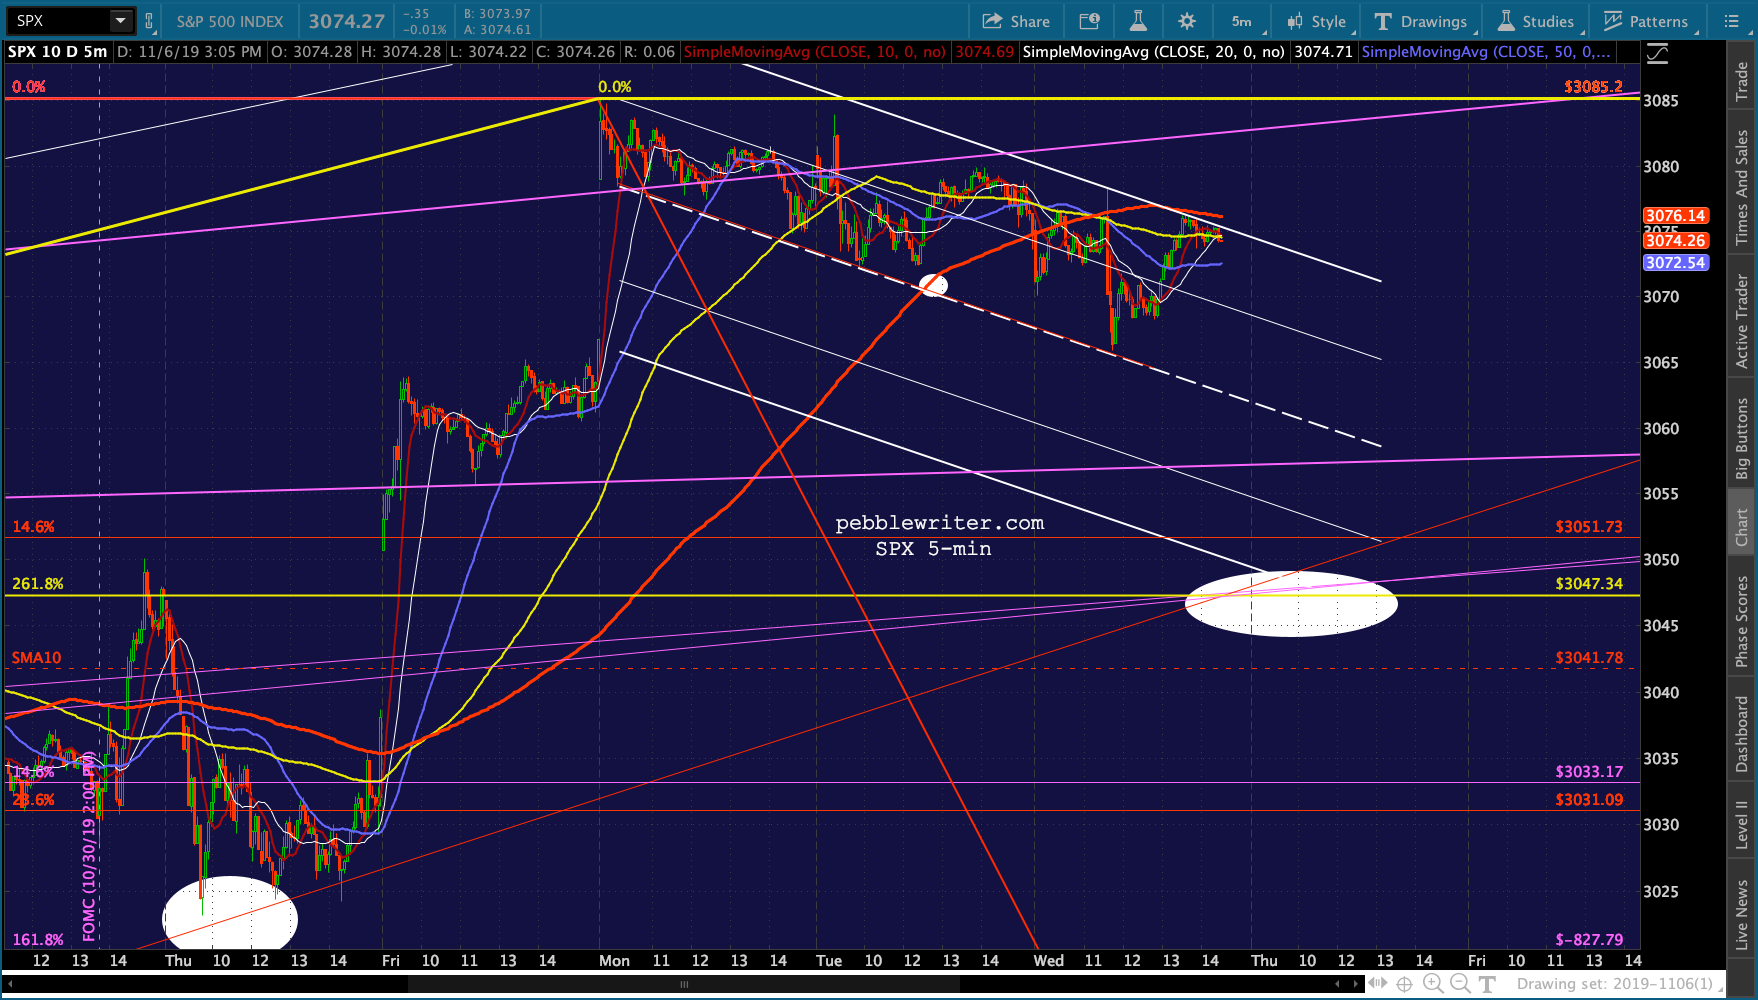
 UPDATE: 1:00 PM
Here’s where I think it’s going… Bears need a break down below 3047 or else it’s just a very gentle gap close and Fib backtest.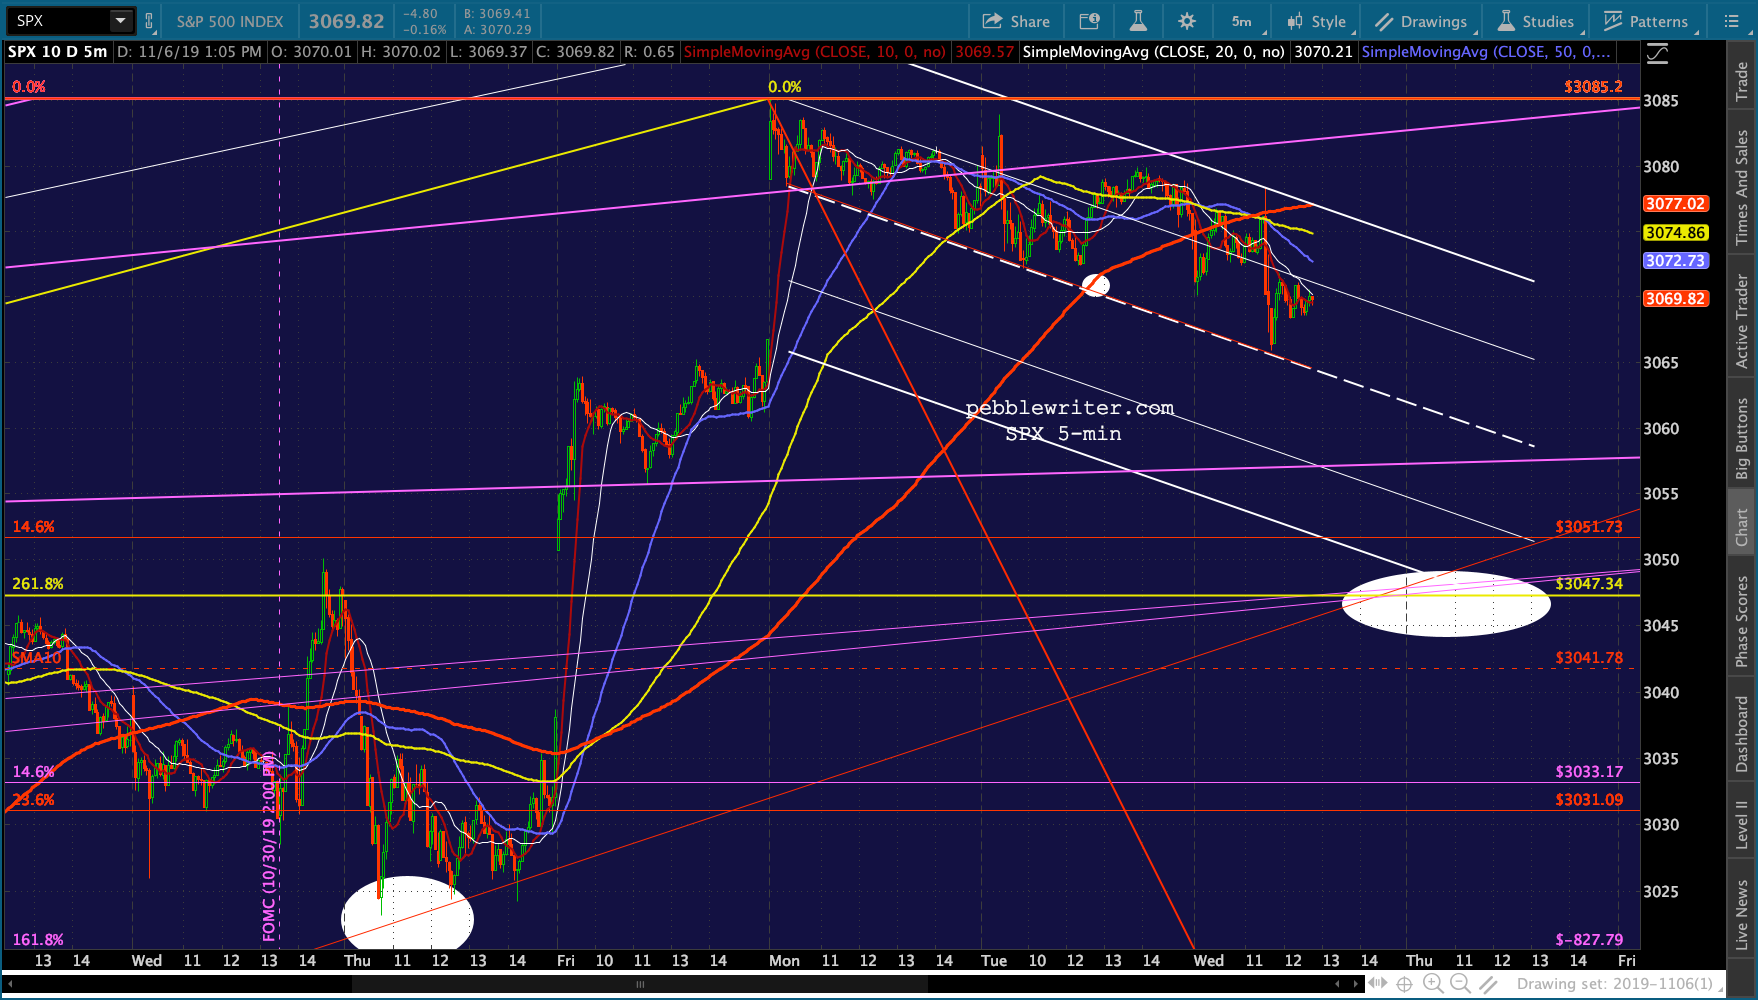
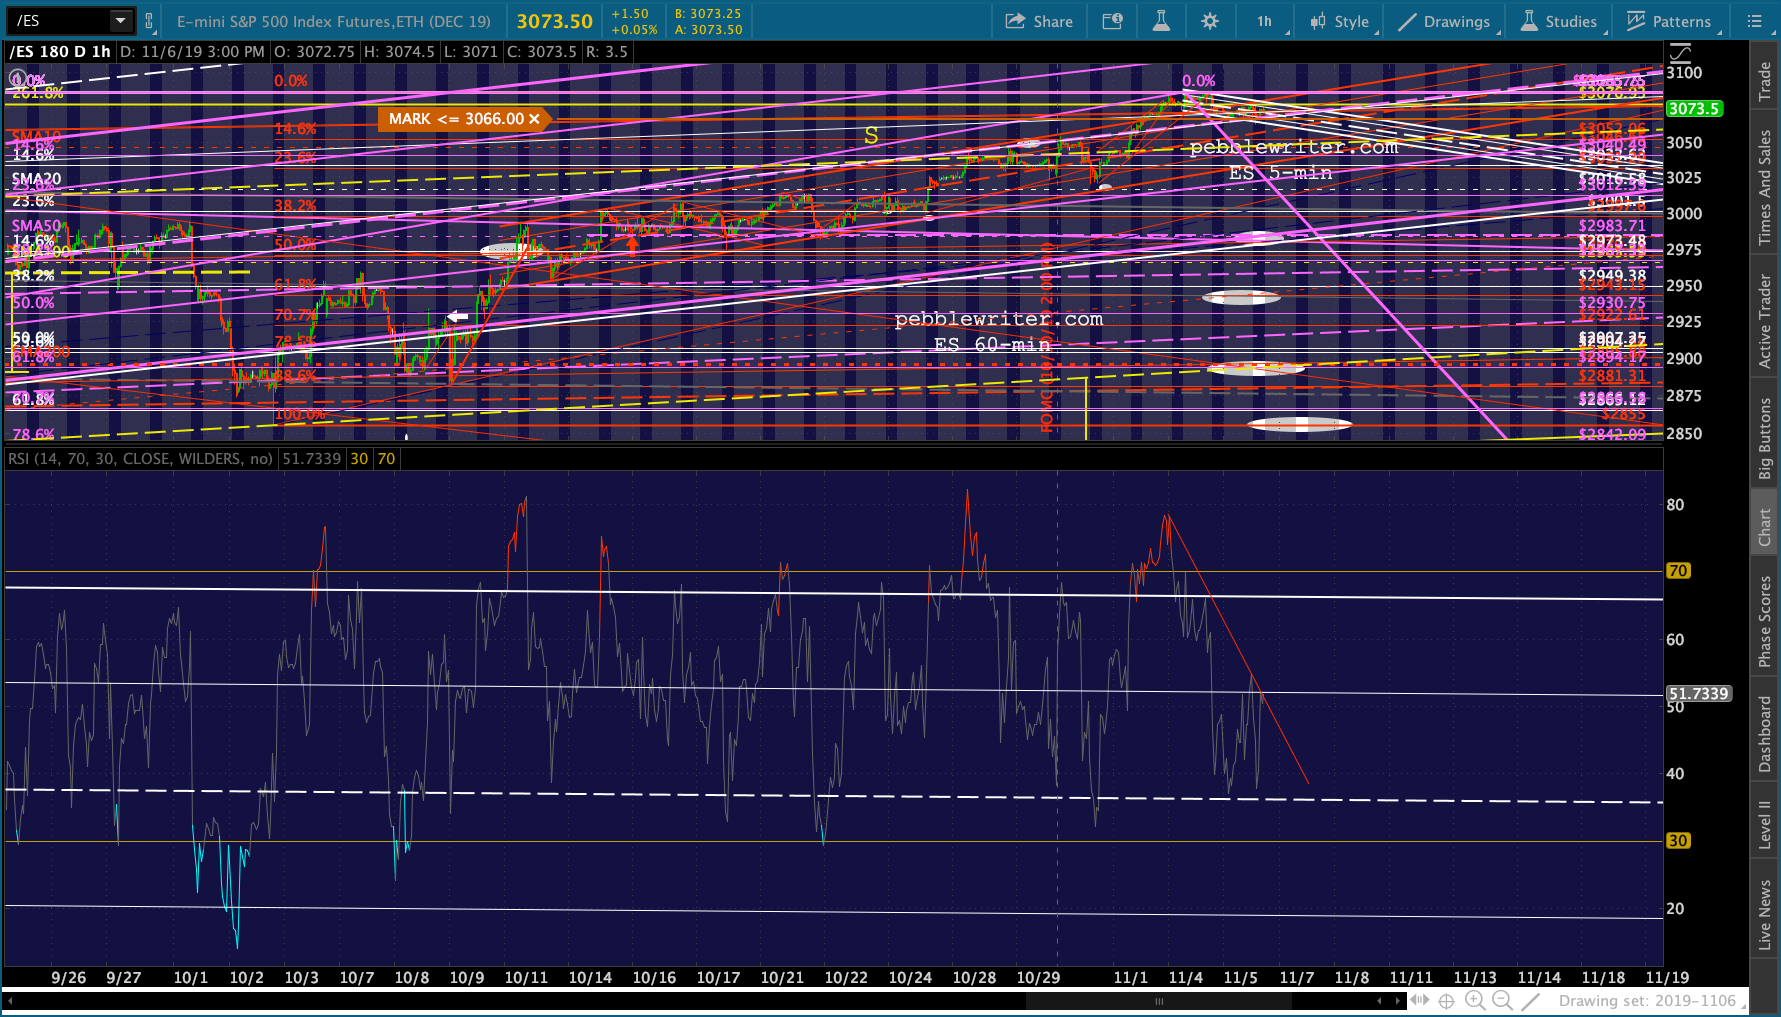
 UPDATE: 3:00 PM
Still plenty of time…
 UPDATE: 3:55 PM
Another ridiculous day… SPX is positioned to close slightly in the black.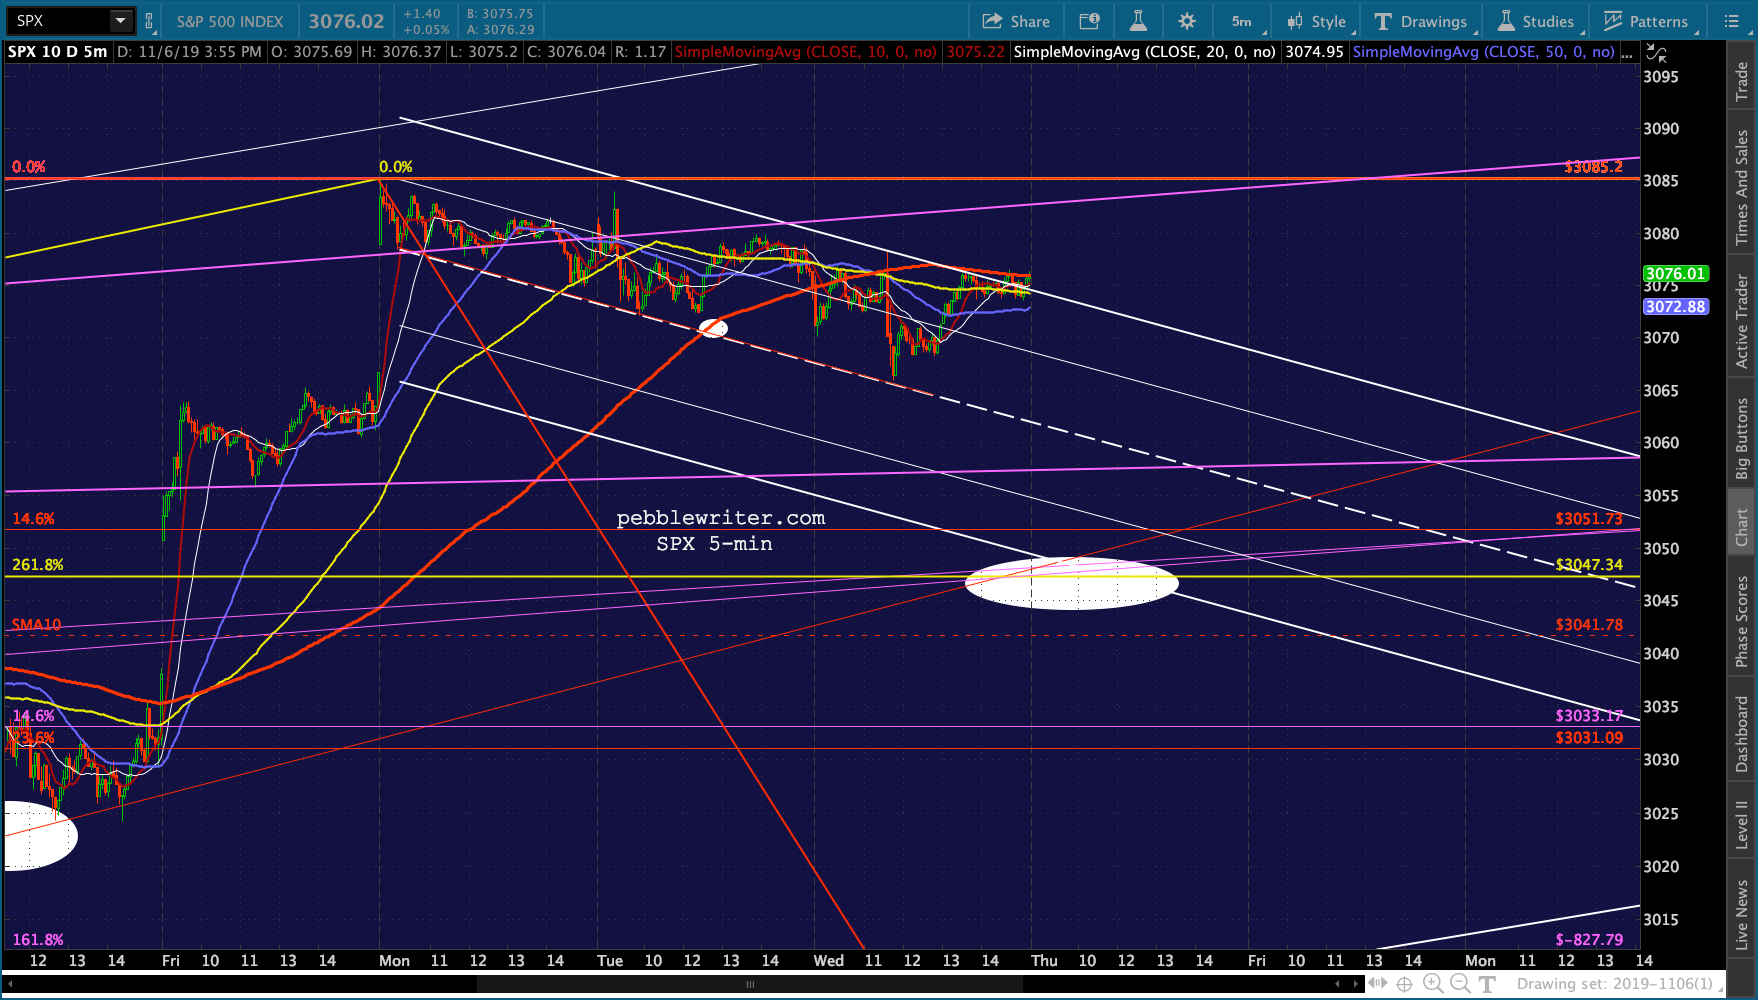
It’s worth noting that, on Monday, the put/call ratio reached levels not seen since Jan 23, 2018 – three sessions before SPX topped out. It fell 240 points over the next 10 sessions.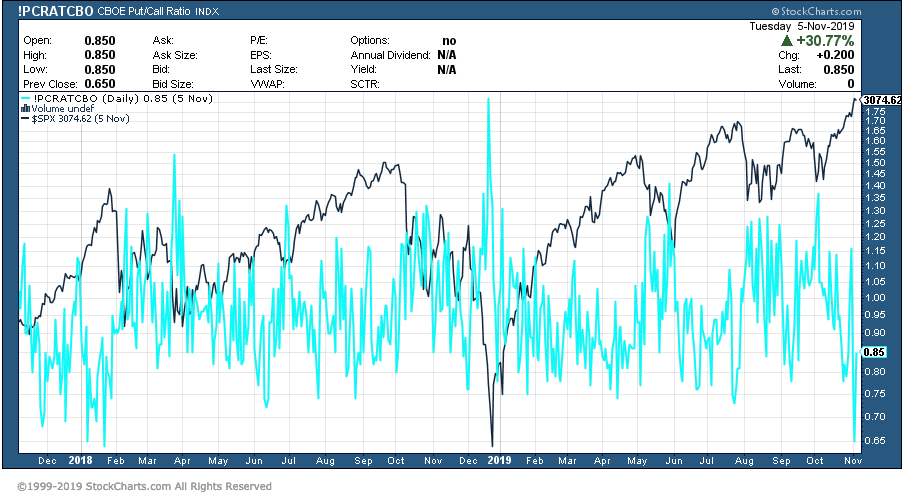 I need to be out of the office most of the day tomorrow. I should be able to post early in the morning, but unlikely after that.
GLTA.