

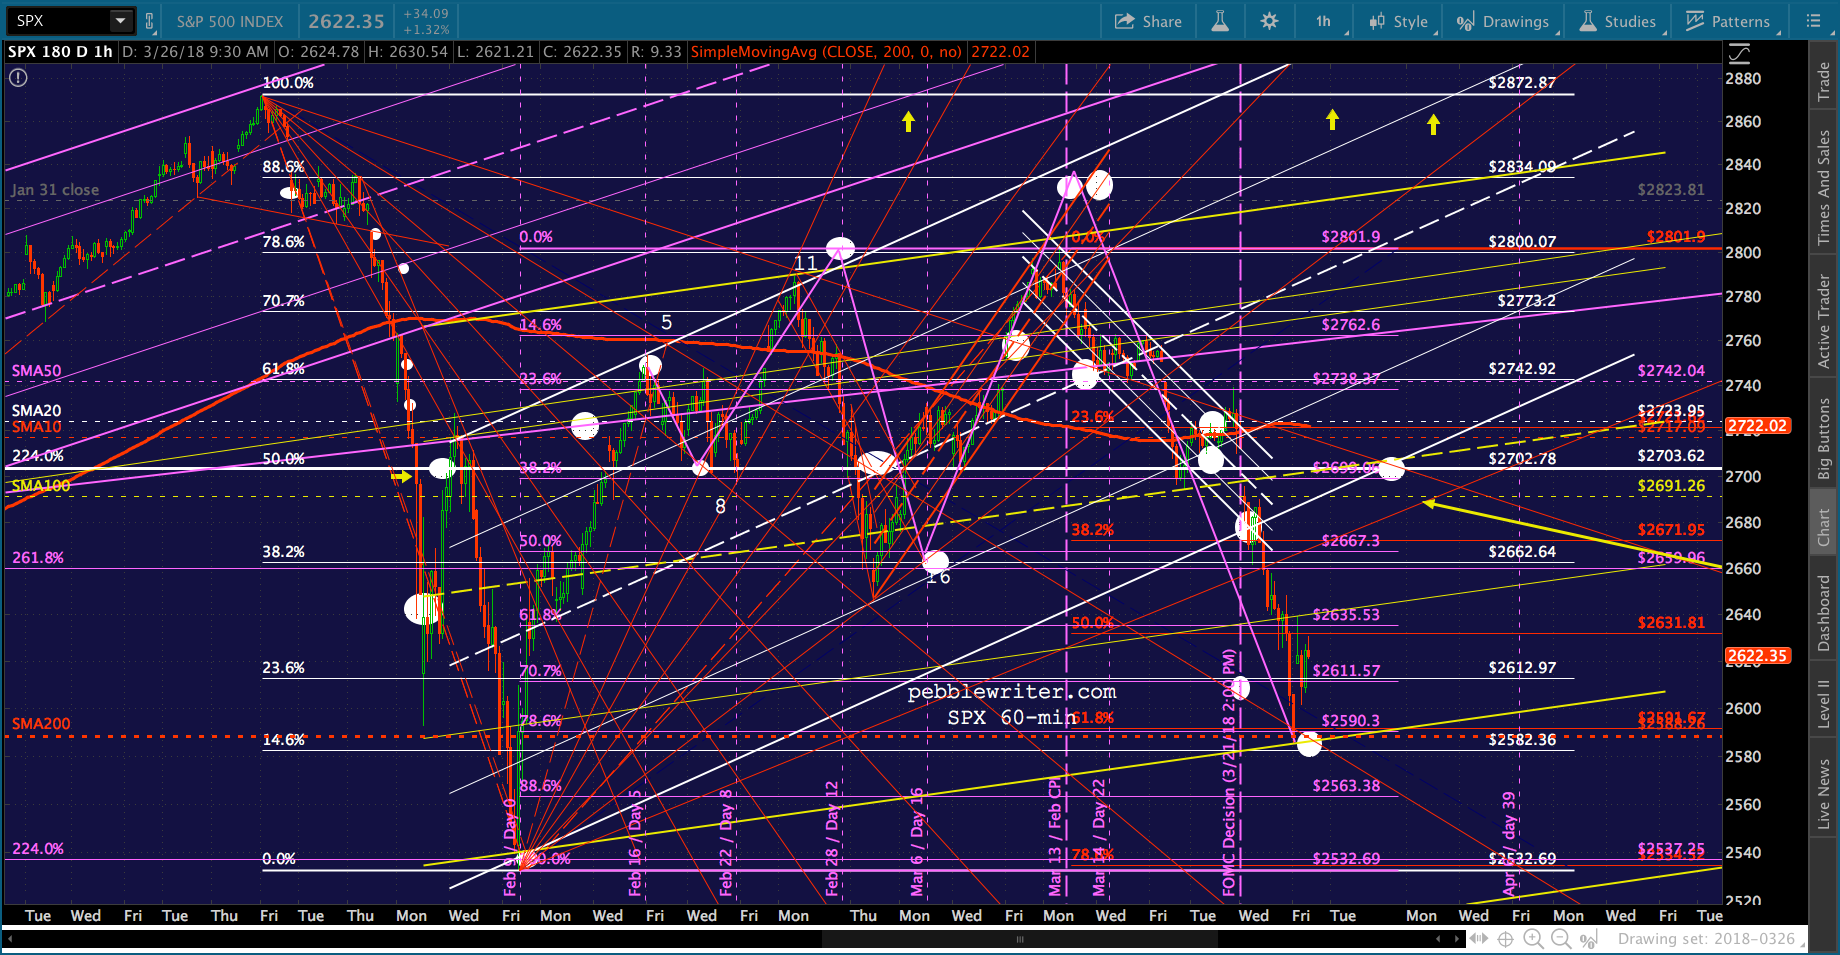
Many of our downside targets were hit on Friday, including SPX, ES, COMP, RUT and DXY. As we wrote last Thursday [see: US Dollar – Time’s Up]:
…ES has tepid support at 2665.27 and 2635.29 and SPX way down at 2612.97, followed by the .146 at 2582.36. Note the SMA200 is up to that level now. It’s the lowest SPX can go and still find reasonable support.

We had a number of indicators pointing in the same direction, but had to wait and see if the white channel bottom would hold. If it did, there was still an upside case to be made. It didn’t. While it’s always fun to nail a target, Friday’s plunge means the analog we’ve been following since Feb 6 is kaput. It doesn’t mean the market has no further upside, simply that that particular path is no longer being followed.
On the other hand, things are somewhat simpler here at the 200-day moving average. Past experience tells us that when SPX reaches its SMA200, we usually get a nice bounce. When we don’t, things can get pretty ugly in a hurry.
continued for members…
To know whether or not stocks have more upside, we need to look at the individual components that have driven it to its recent highs. Can they keep it up?
USDJPY has seen several breakdowns and has failed to even backtest its way to higher levels. We saw the waffling at the falling white channel midline, but it yielded a failed breakout above the red trend line off the January highs.
 At this point, I’m beginning to doubt the falling white channel altogether. I’m wondering if the yellow channel shown below might be the ultimate path. If so, it opens up additional downside, but could also simply speed up whatever downside we get.
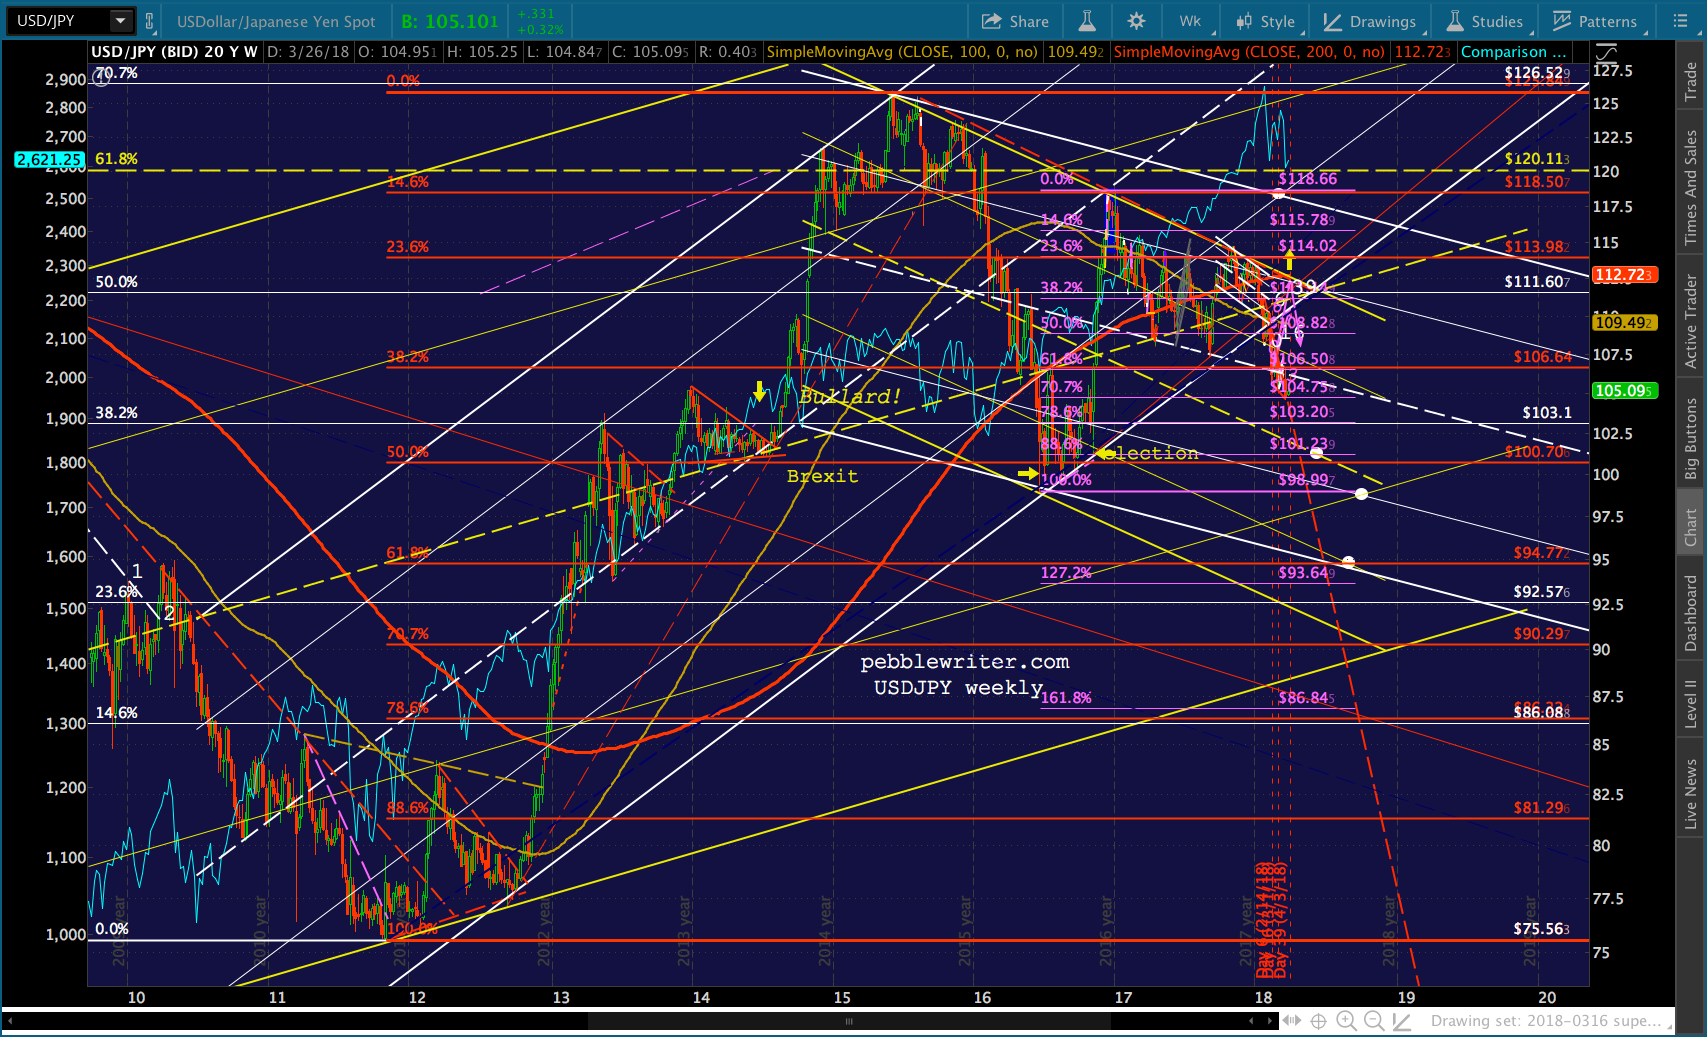 For whatever reason, the USDJPY is not coming to stocks’ aid the way it traditionally has. It could reflect the trade/tariff issues floating around. From the Asian Review two days ago:
“I’ll talk to Prime Minister Abe of Japan and others — great guy, friend of mine,” Trump said Thursday at the White House. “There will be a little smile on their face. And the smile is, ‘I can’t believe we’ve been able to take advantage of the United States for so long,’” he continued. “Those days are over.”
Maybe the days of cooperating with currency moves are over. The dollar has clearly been propped up the past two months. But, it recently broke down, and has much more downside potential if it drops through the white dashed line below.
 Below the white midline is the purple channel bottom at roughly 87.68. Below that is the .500 Fib at 87.259. Below that there is very little support until 84.238, with more likely targets being 83.351 and 77.786.
 I drop in DXY doesn’t necessarily translate into a drop in stocks. But, it certainly increases the odds as it shifts the burden of propping up equities to VIX and CL.
The yield curve model continues to warn of lower stock prices. All that’s missing, so far, is a plunge in yields as money flows from equities into fixed income — the fear trade.
 RB and CL continue to soar much higher than a moderate CPI level would allow. If CPI is too high, rates will continue to increase, and we’ll see more fear re the impact on the economy and fiscal situation. I see both dropping by the end of the month — at least a backtest of the channels from which they broke out.
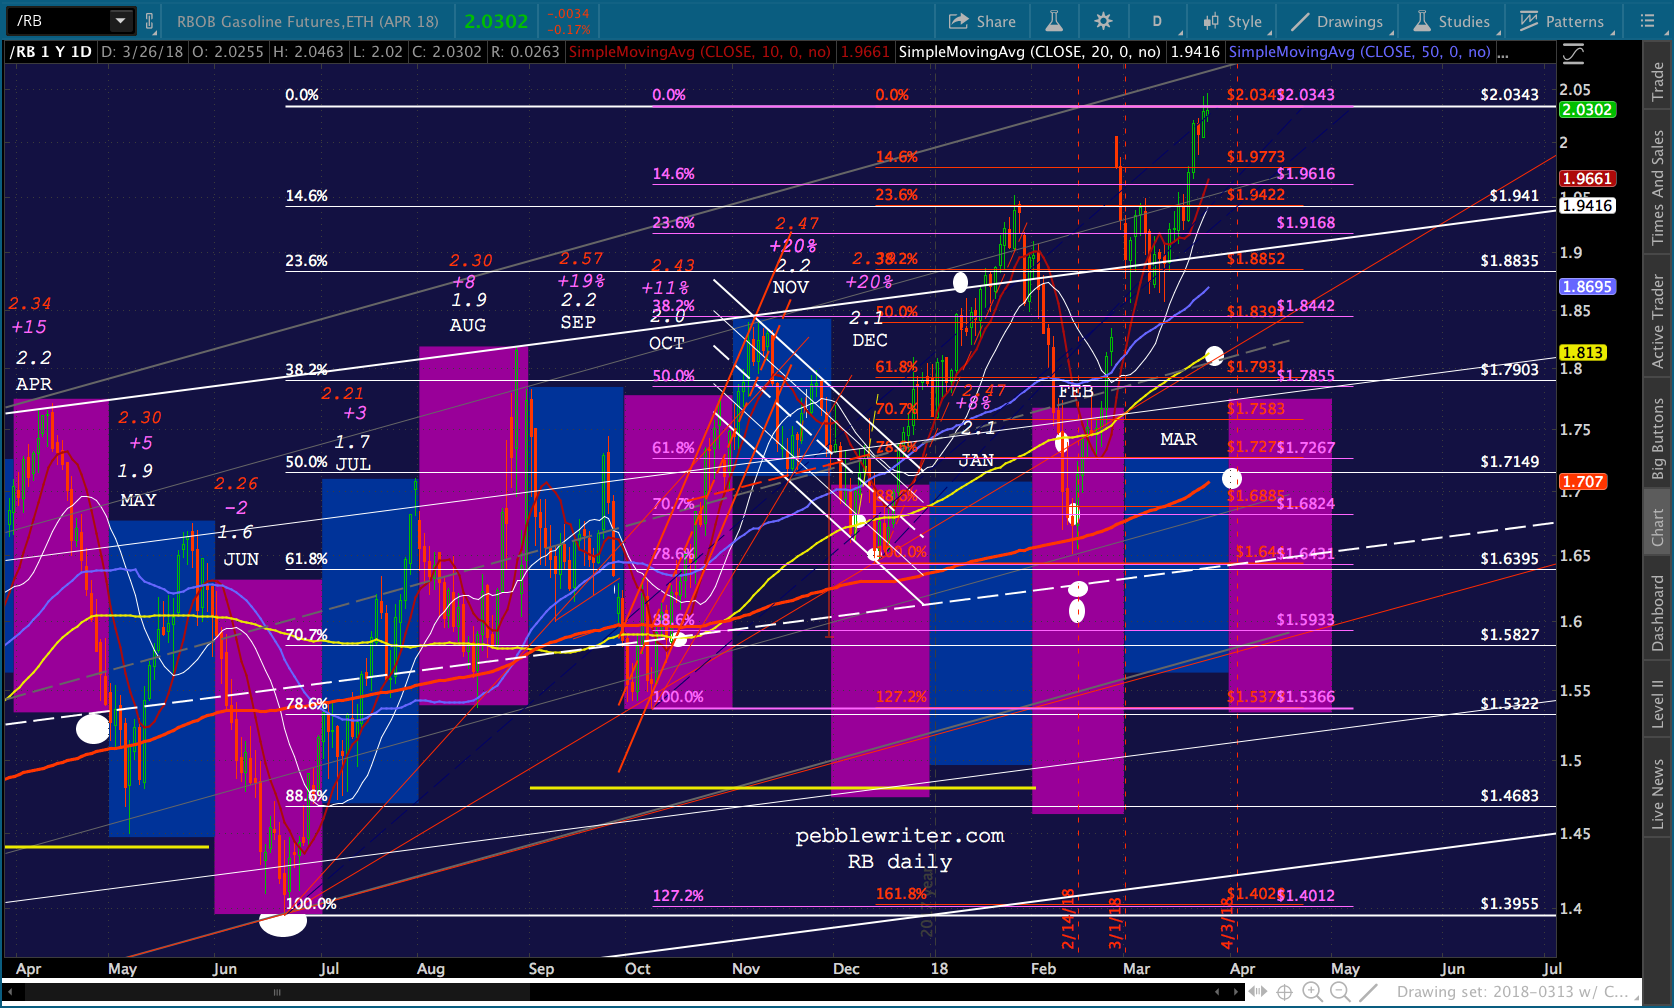
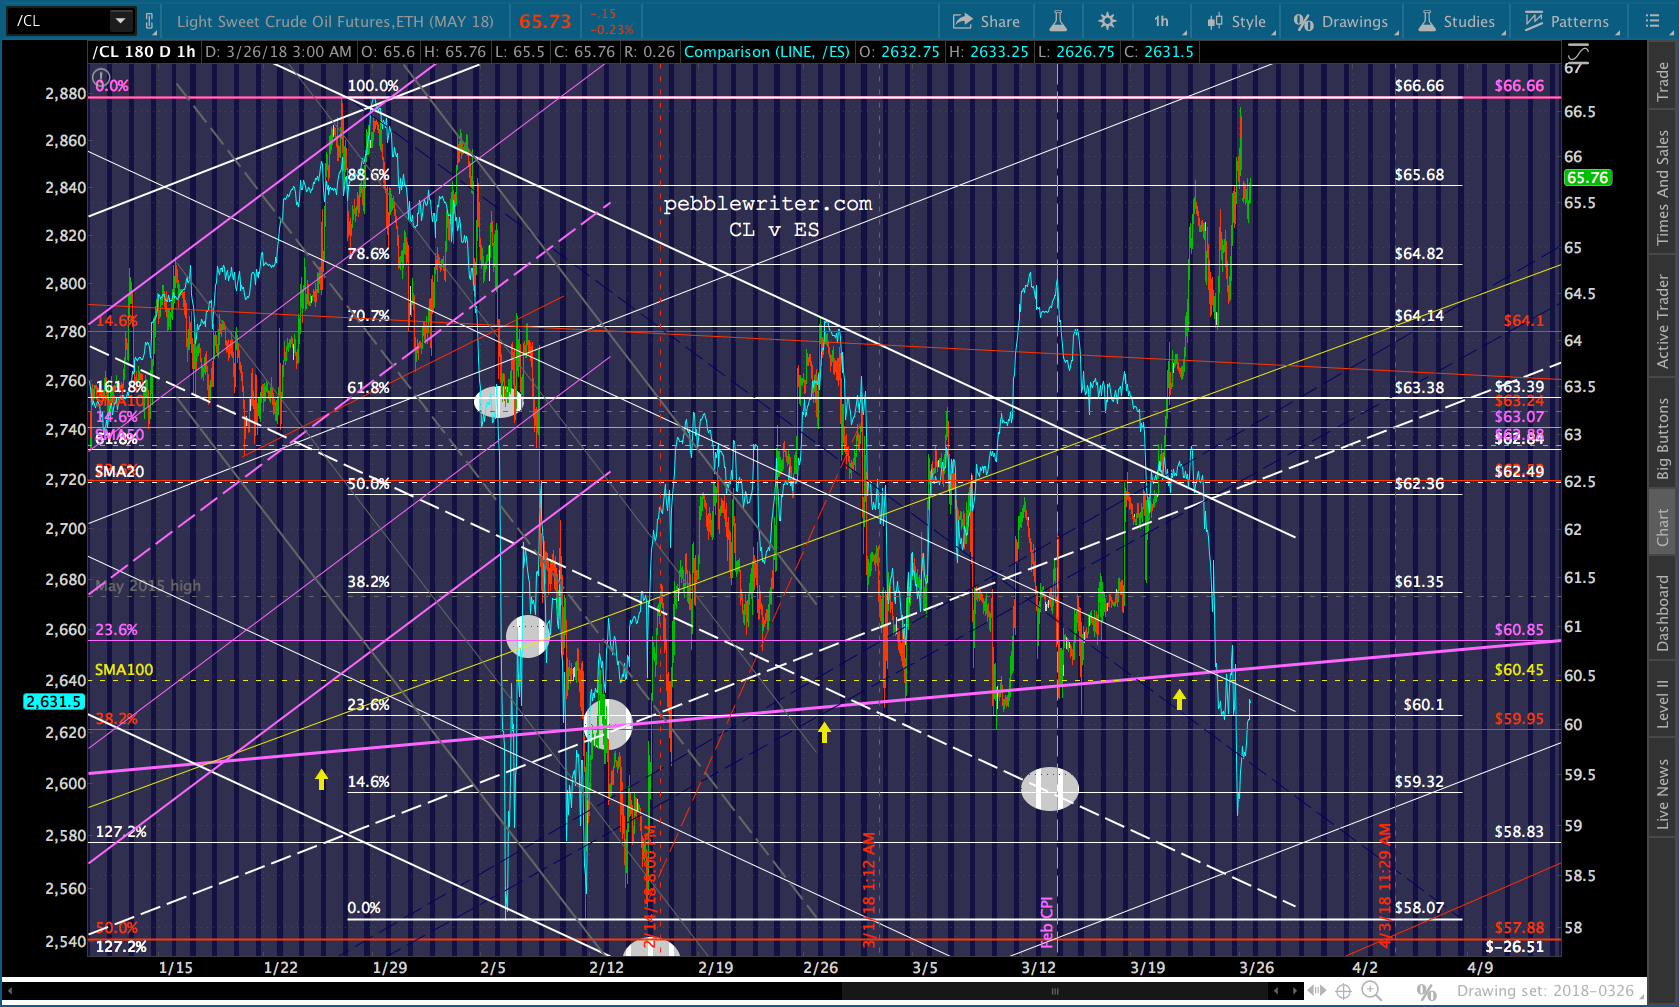 One thing I’m not sure about is to what extent higher RB and CL prices are needed in order to keep CPI reasonably close to 2%. In other words, these are both showing big YoY increases. What if most everything else is such a drag on inflation that higher RB/CL prices are needed just to stay even? I’m doing some research on this and will post it asap.
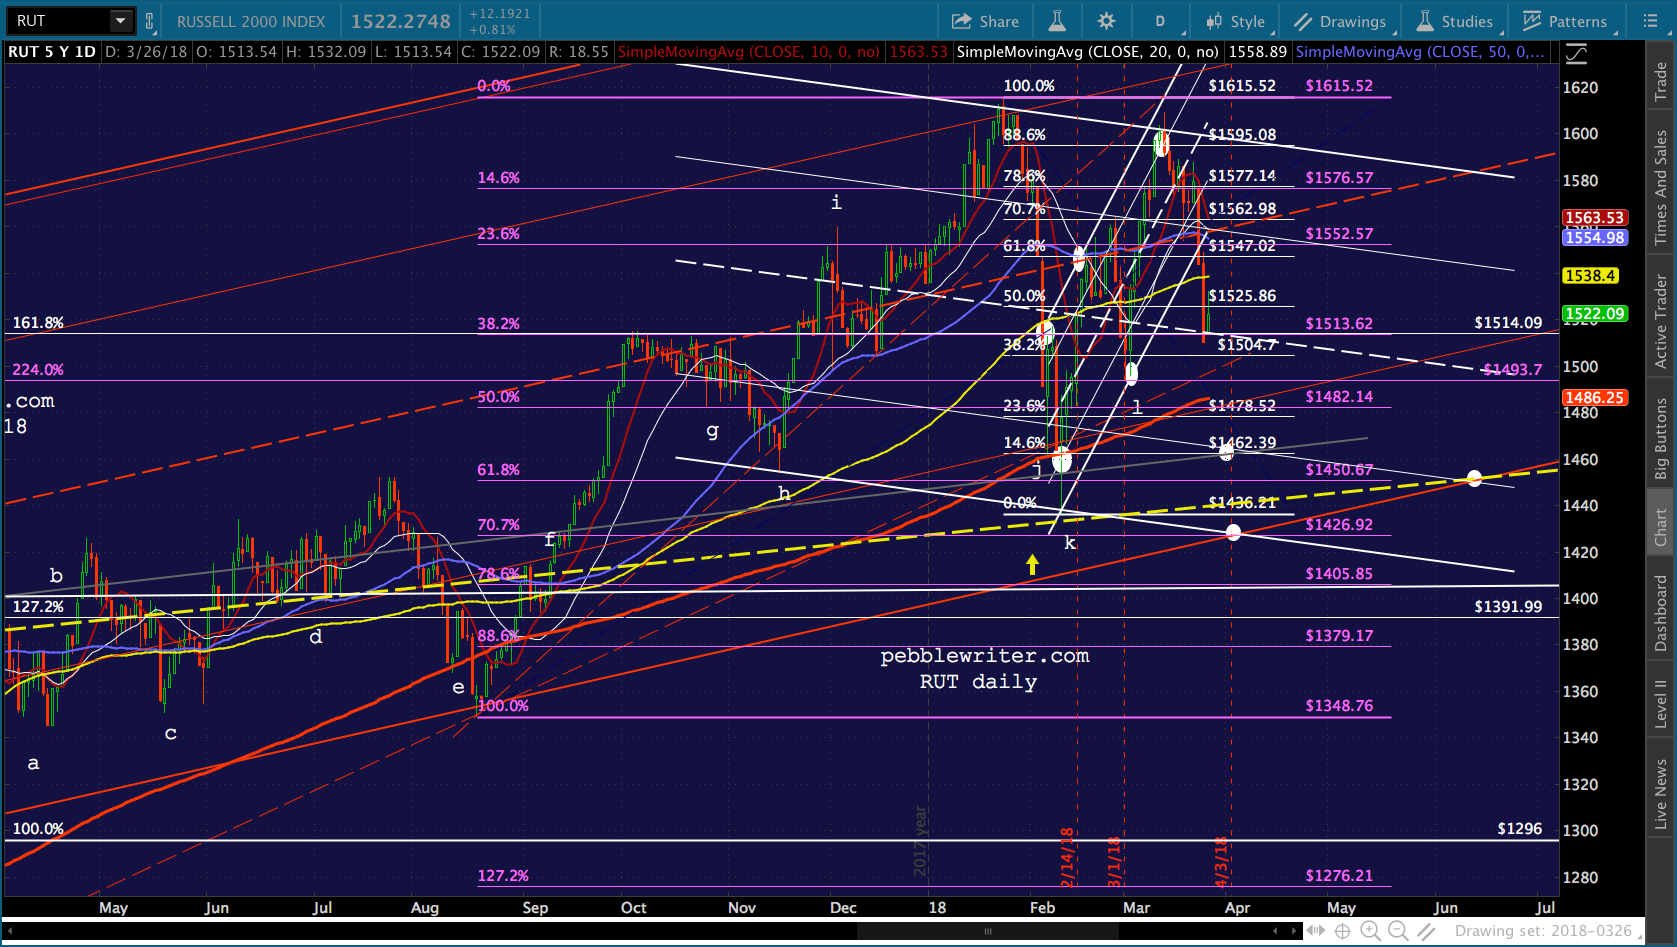
 As previously discussed, RUT’s rising white channel broke down.
 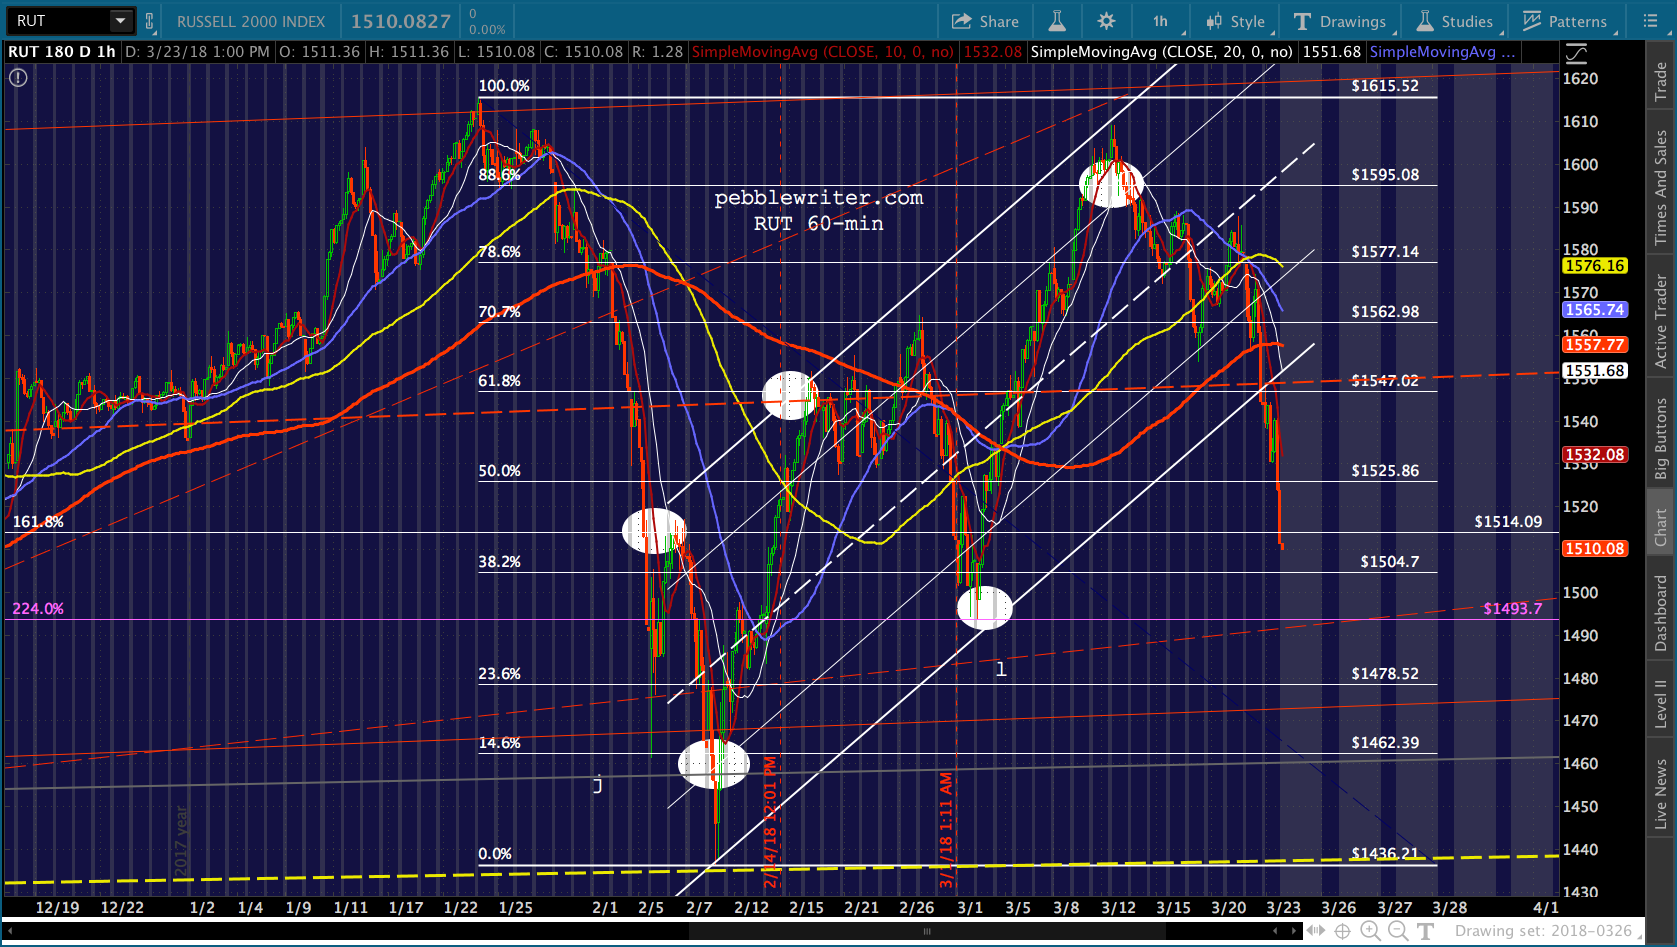 But, it has strong potential support at the white 1.618 at 1514.09 and the purple 2.24 at 1493.7. The SMA200 is up to 1486.25 and there’s a potential flag pattern intersecting with the rising red channel bottom at 1426.92.
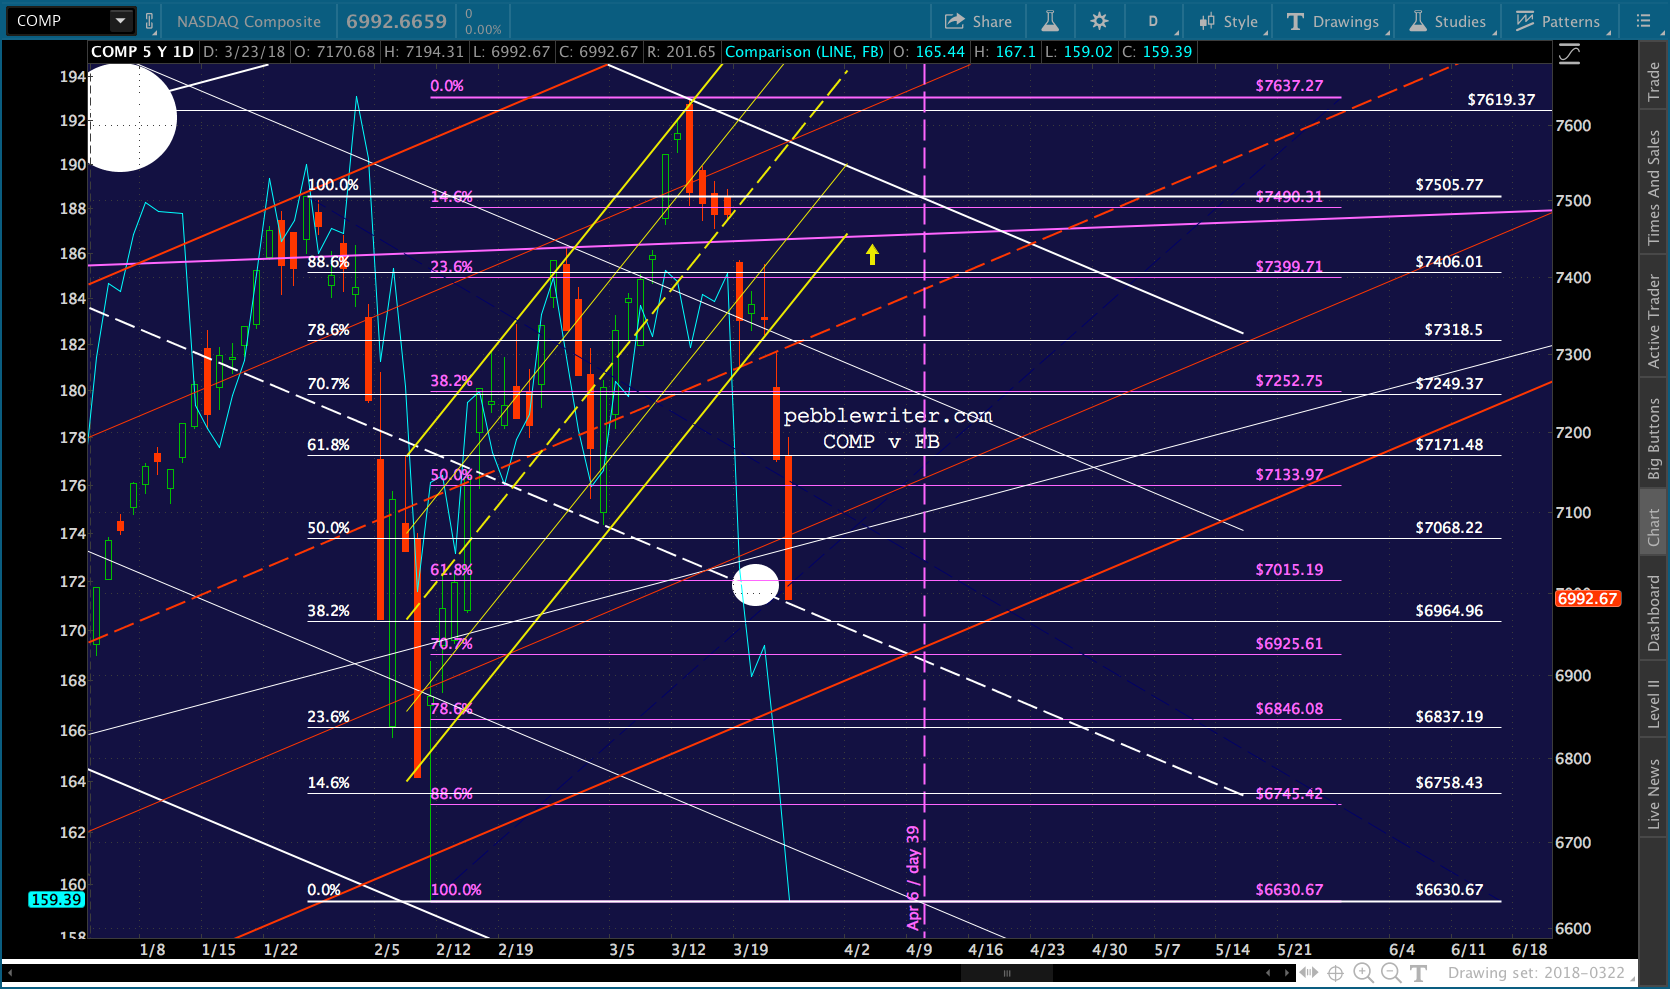
 COMP and FB are a very disturbing story. FB has fallen below its white channel line and as previously discussed has downside potential to 133.83 if it can’t hold support at 153 and 140.
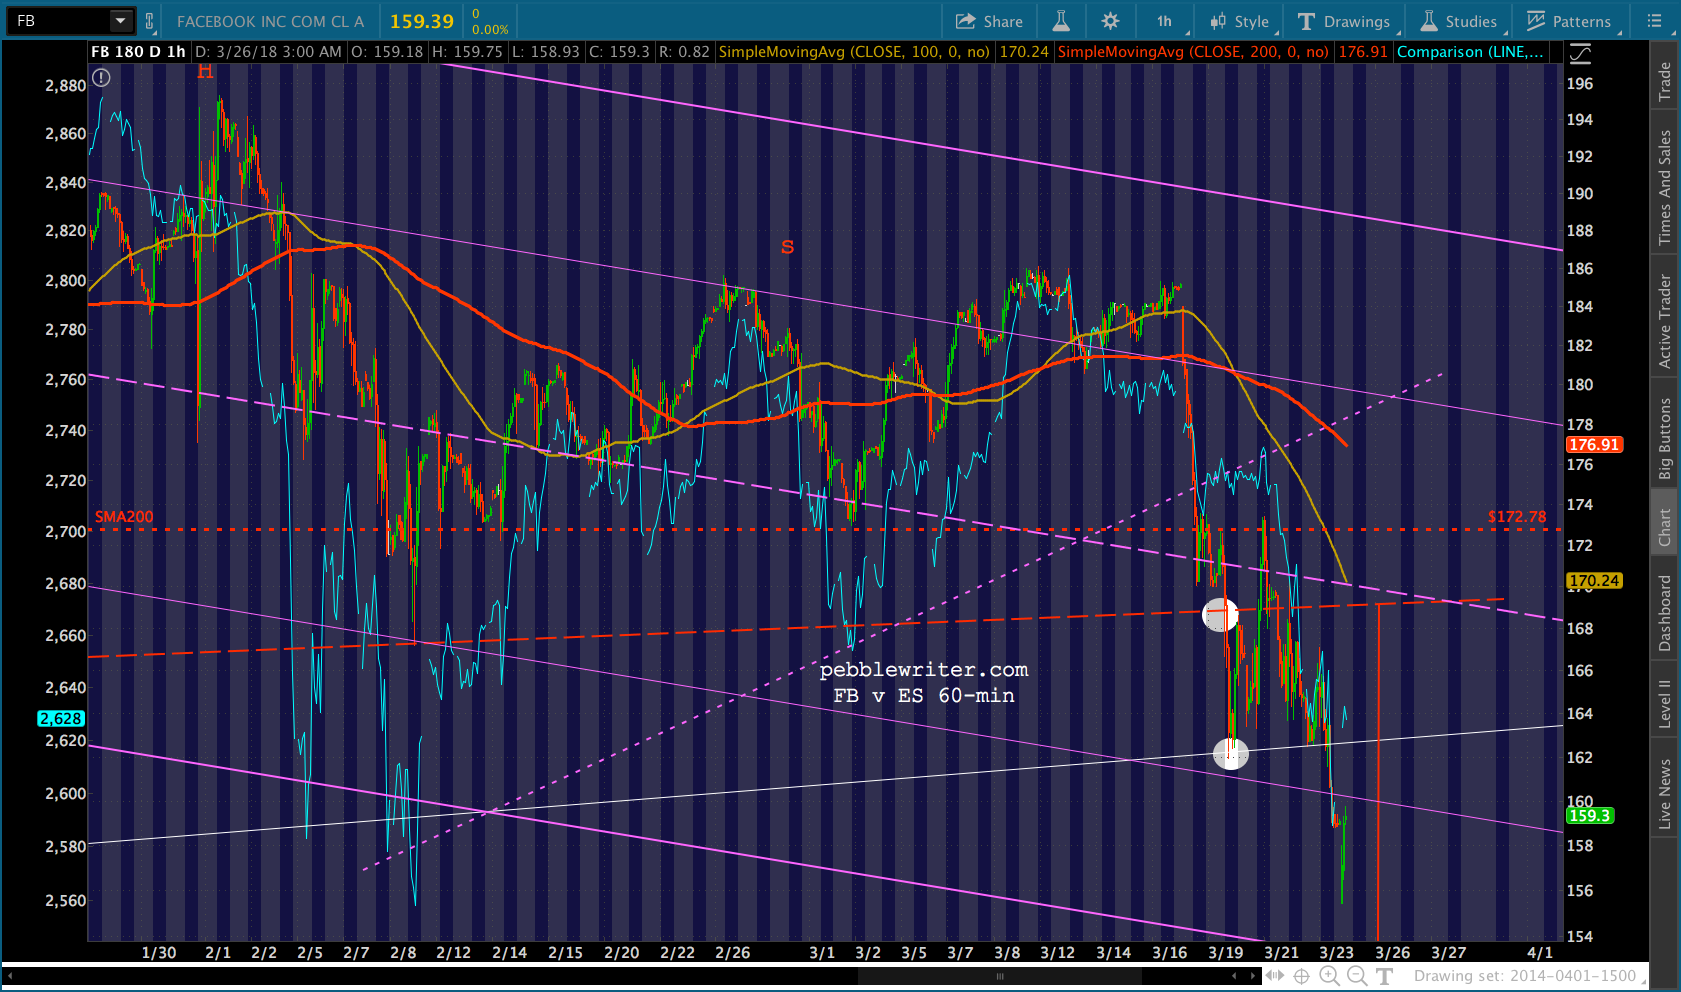 If it continues falling, it will drag COMP along with it. And, COMP has plenty of downside potential anyway.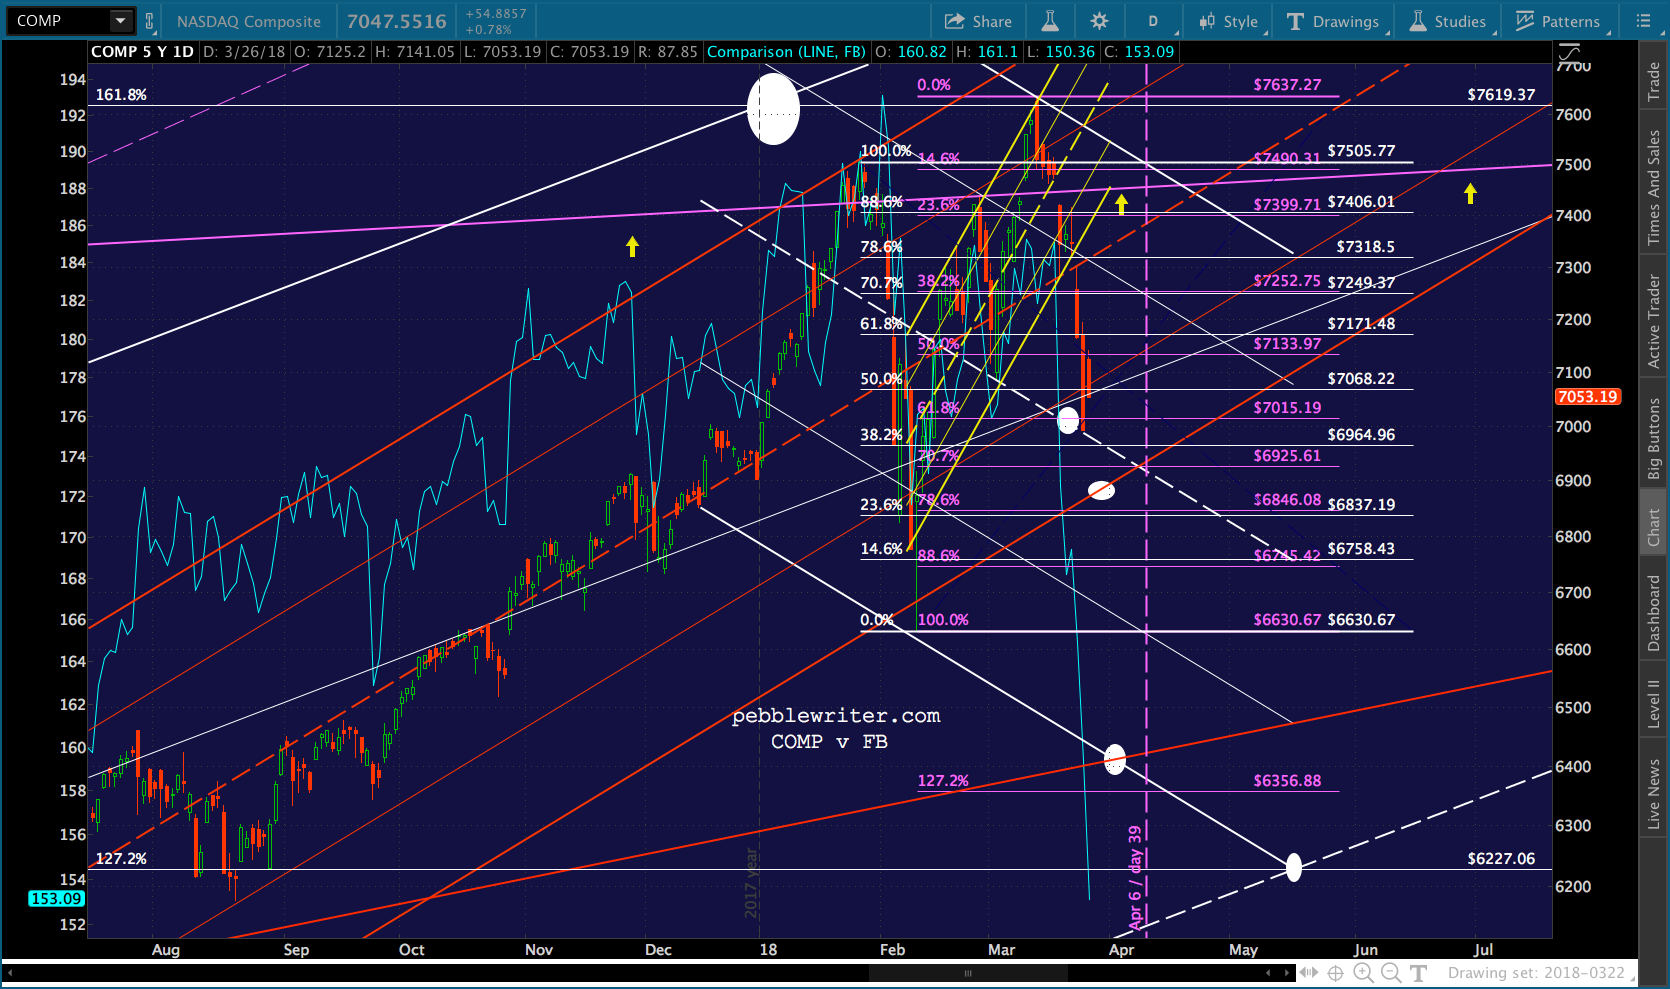
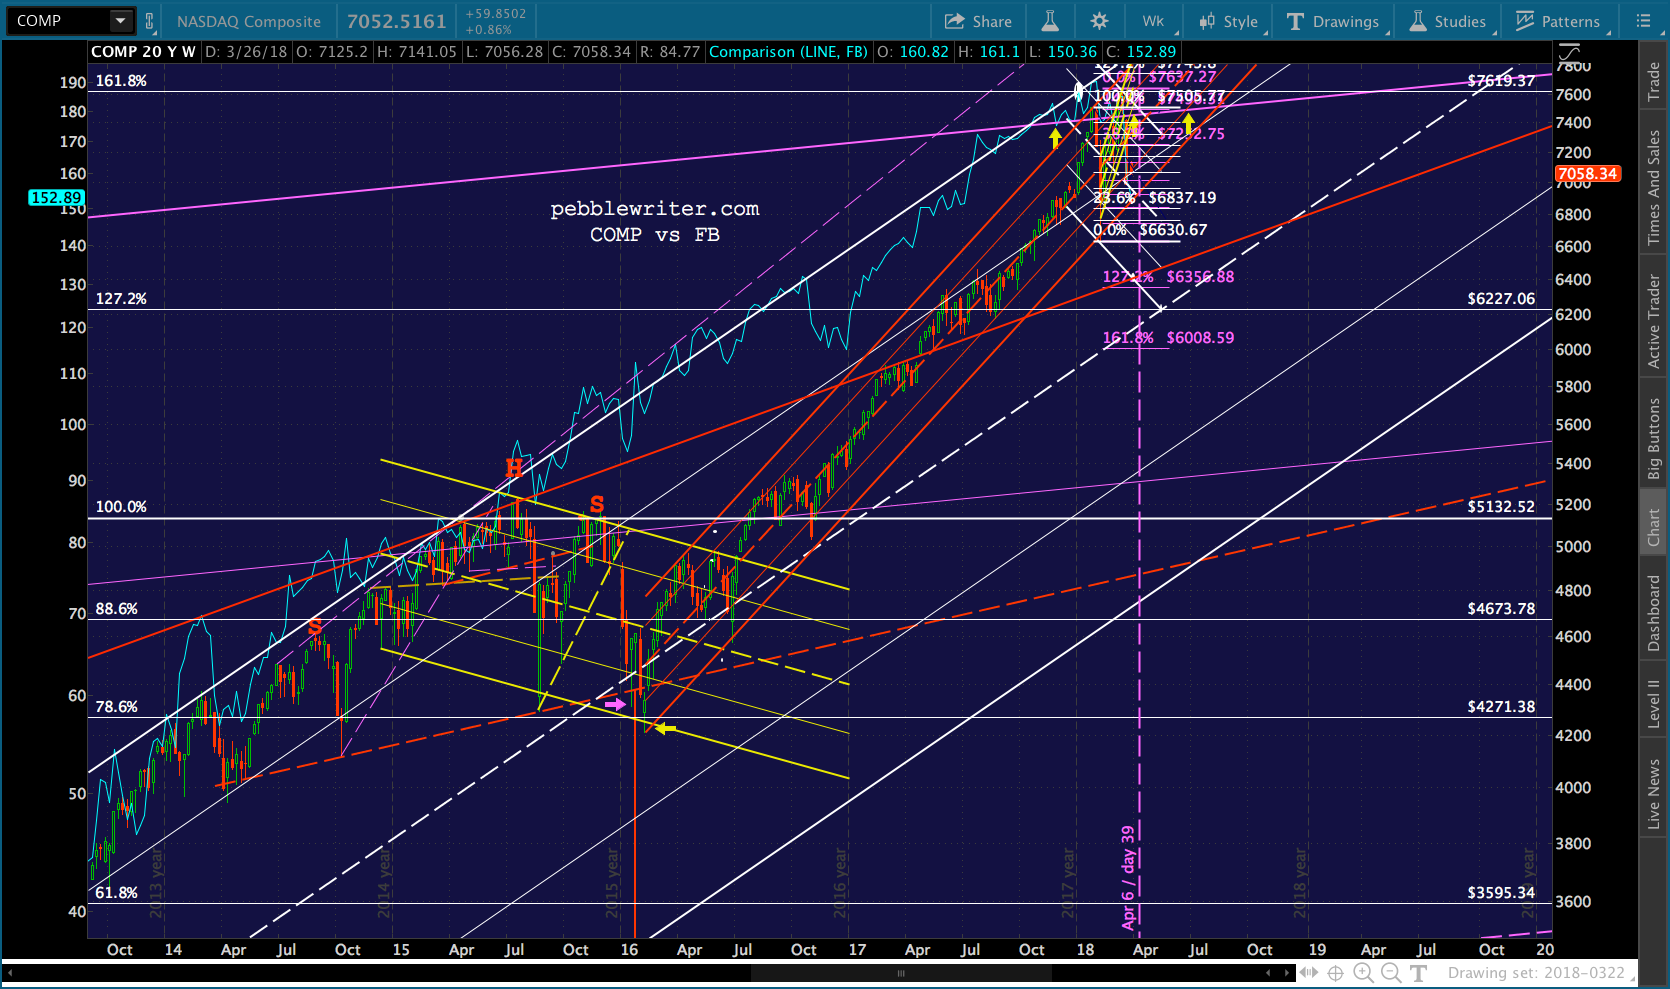 As we discussed last week, FB has never fallen below that channel line and SMA200 without taking stocks down with it. The only exception was in early 2017 when the company announced a $6 billion buyback plan.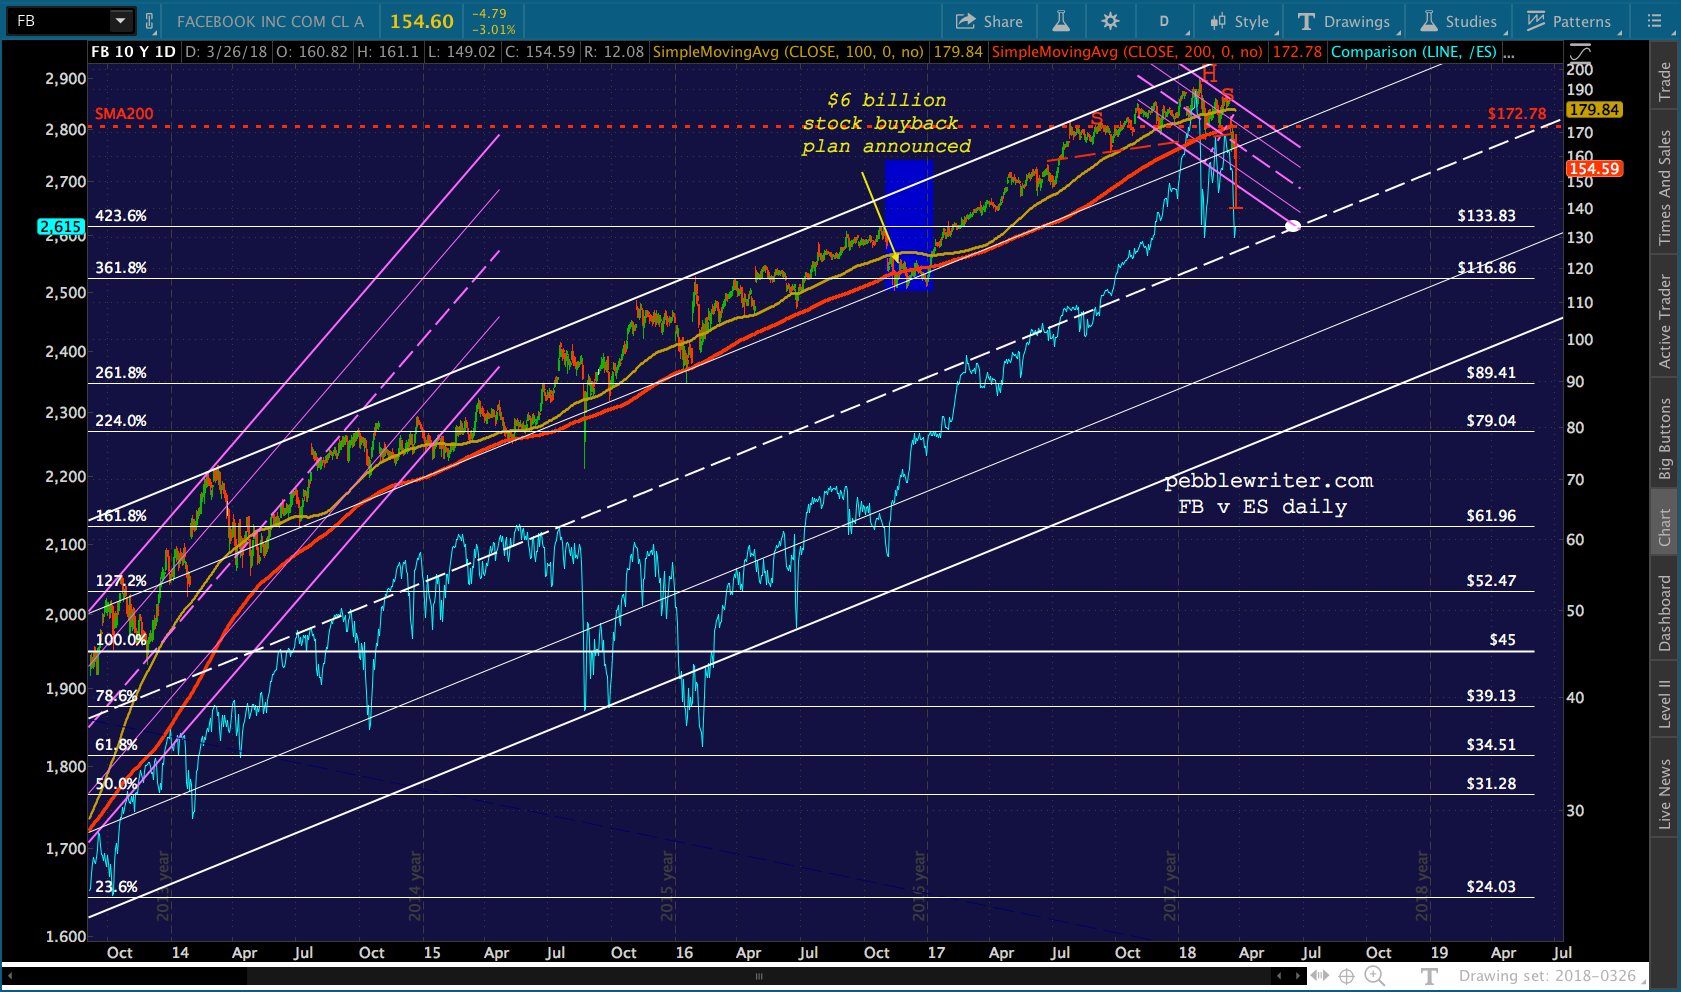
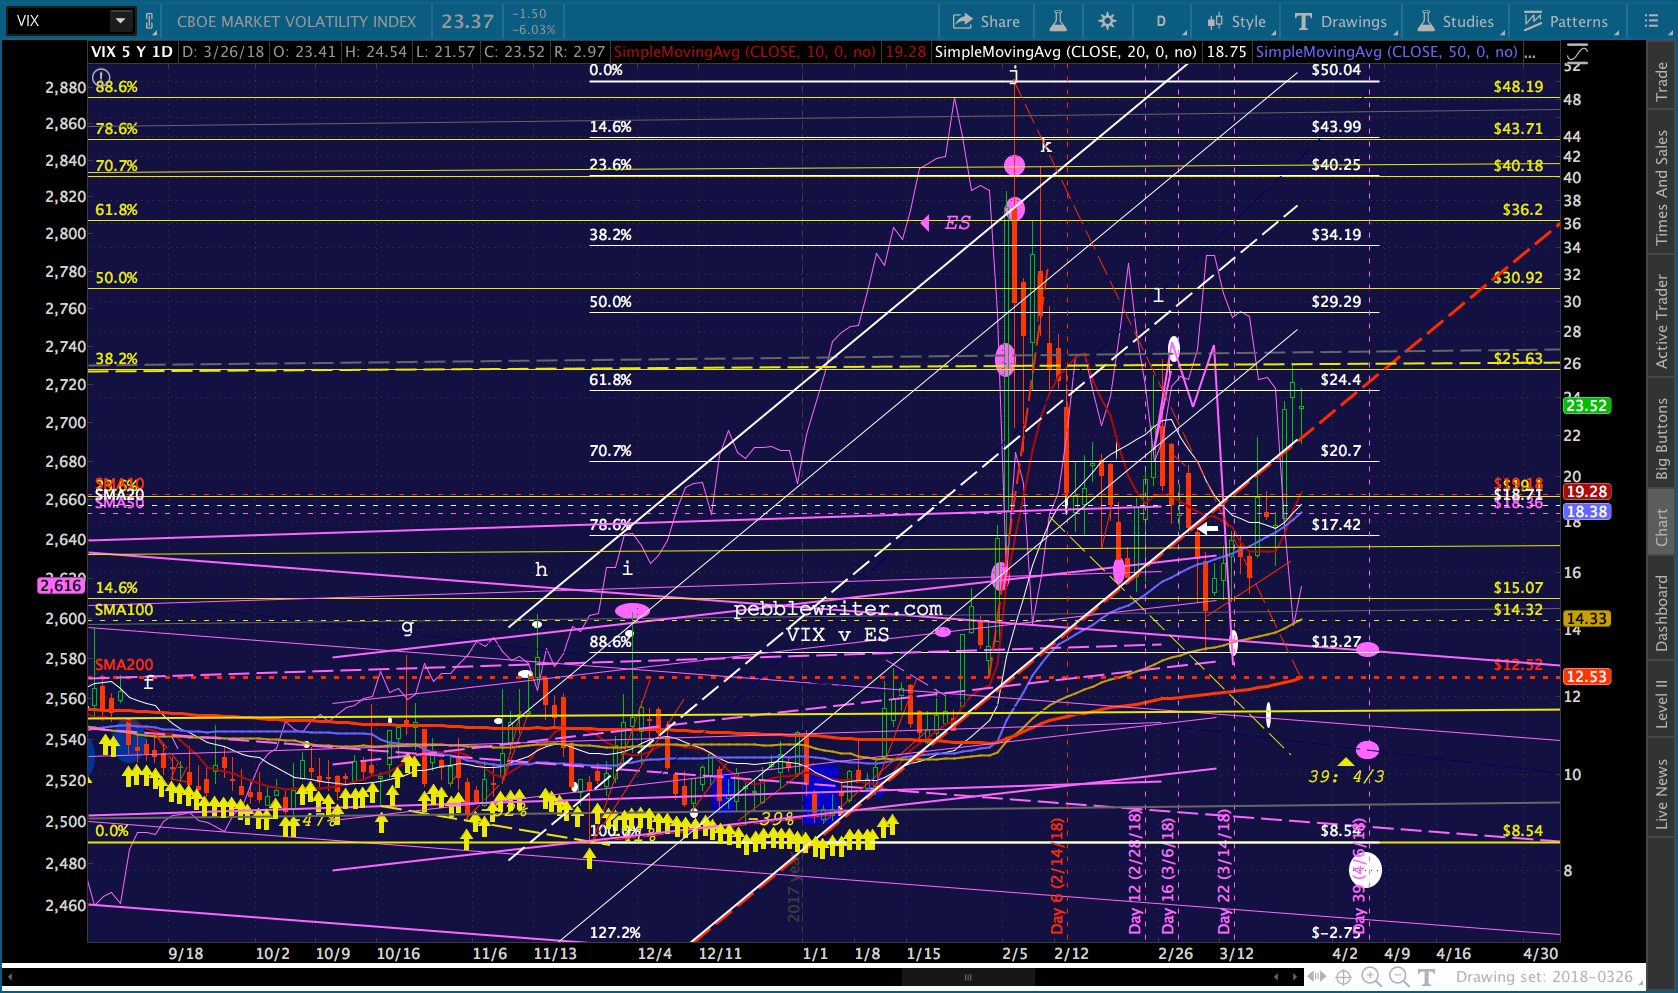
Finally, VIX continues to be a problem. It bounced back up through the white channel bottom on Mar 22, the day the analog showed it would break down. Since then, it has backtested the channel bottom twice — refusing to plunge at all, let alone in such a way that it would prop up stocks.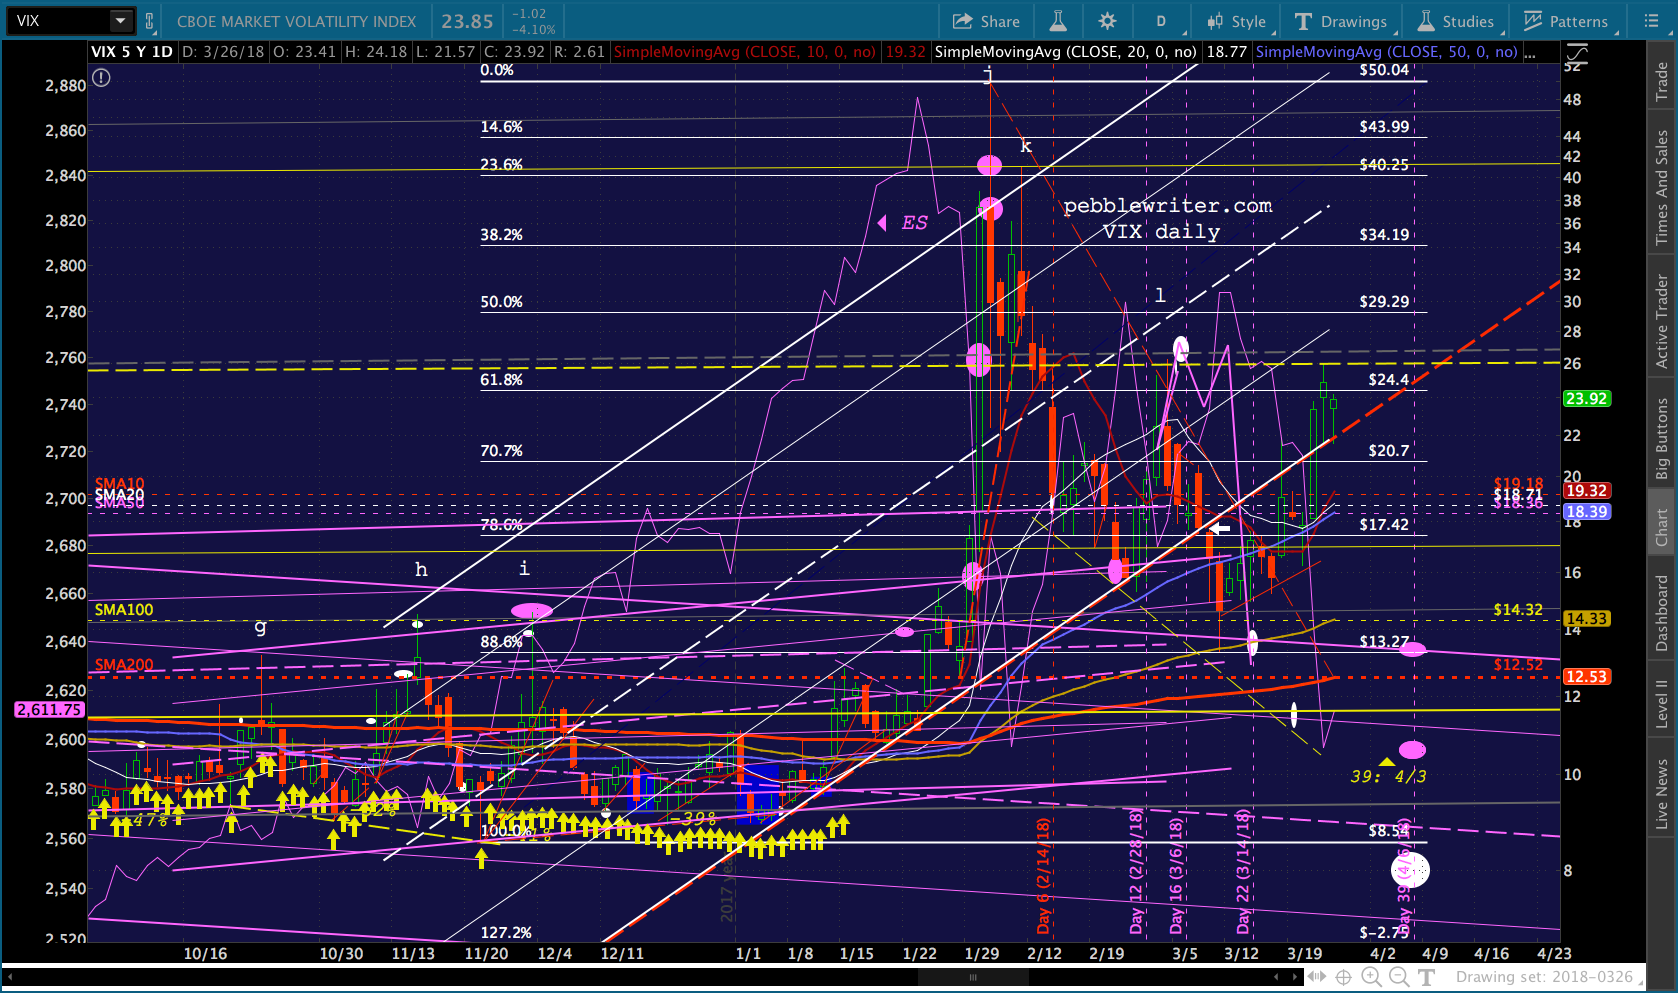 VIX is one of those algo drivers which has been so effective at propping up stocks, it makes one wonder why it’s currently MIA. About the only semi-bullish observations I can currently make are that it: (a) hasn’t popped back above the yellow channel midline, and (b) is close enough to the white channel bottom that it could help a great deal with minimal effort — if TPTB decide that’s what they want.
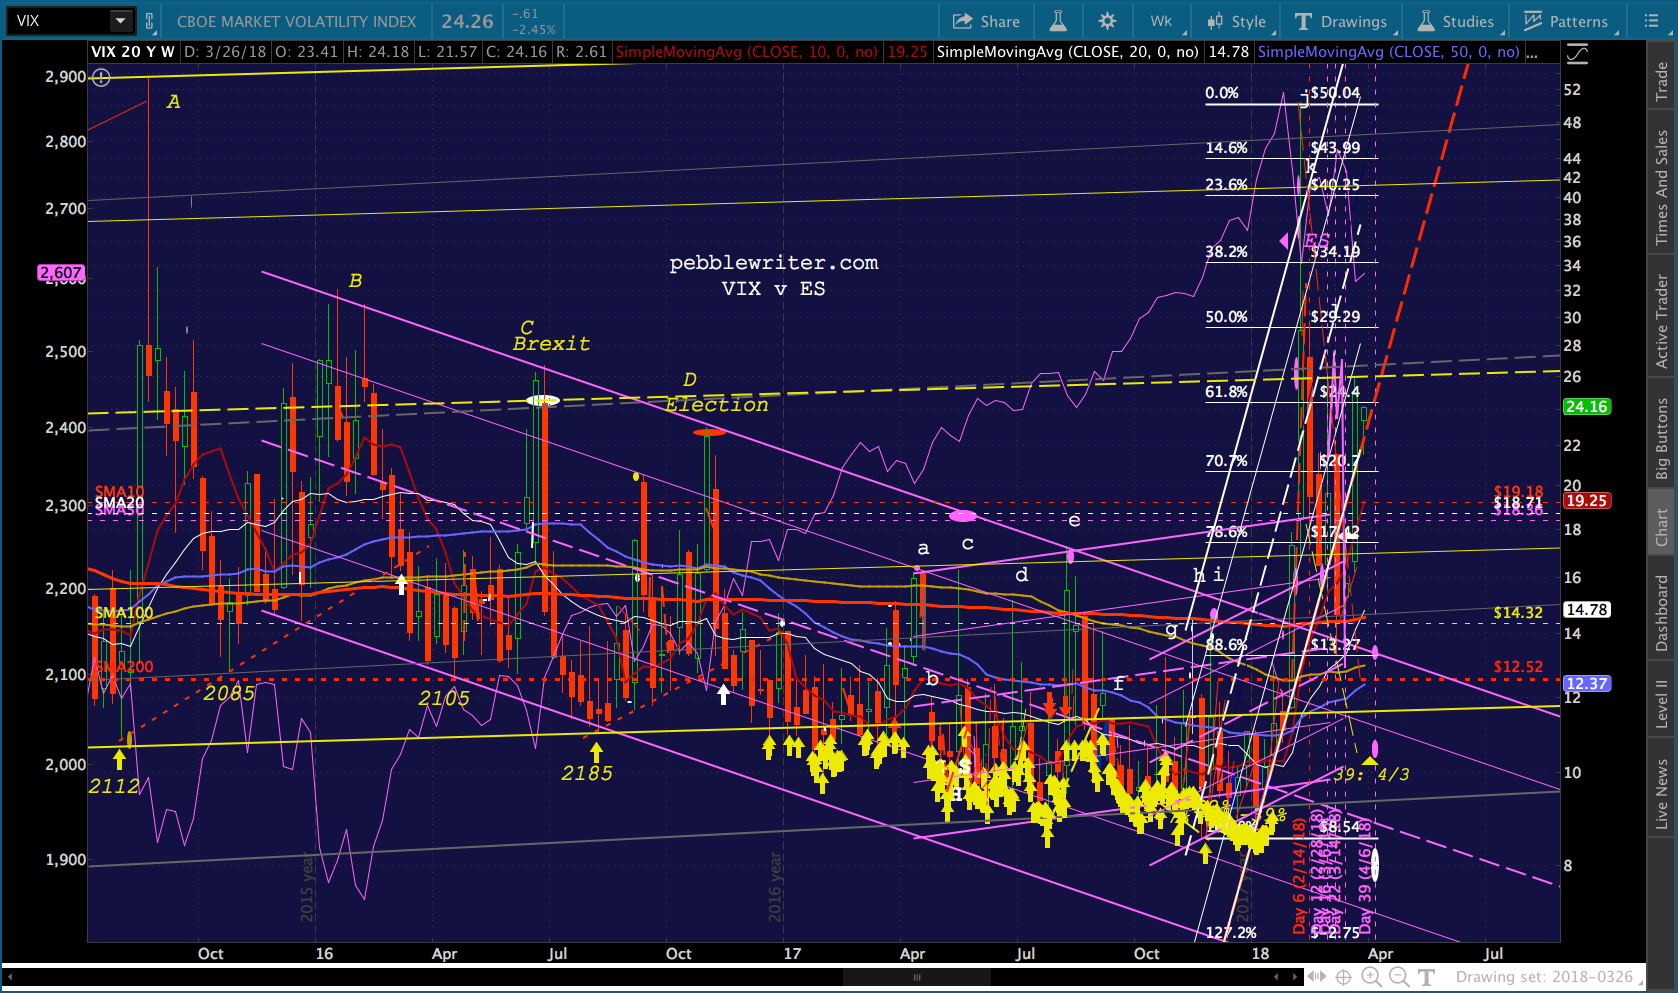 If it remains above the white channel bottom, currently around 21.60, it will contribute to lower stock prices. It doesn’t even have to push to new highs. So, it should continue to make a pretty good indicator.
 Now that we’ve examined all the potential influencers, we know the potential of each to lift stocks higher or result in lower lows. Tactically, I’d say it’s safe betting on a sizable bounce as long as one keeps an eye on the SMA200 and is ready to bail and short on any drop through it.
The algo influencers are bearishly aligned, but typically the Fed (or someone) has blinked and prevented a meltdown below the SMA200. The exceptions each provided warning signals — a close below the SMA200 itself. When the SMA200 didn’t hold, SPX sought out an important Fib level such as the 1.272 which was backtested multiple times in 2014-2016. 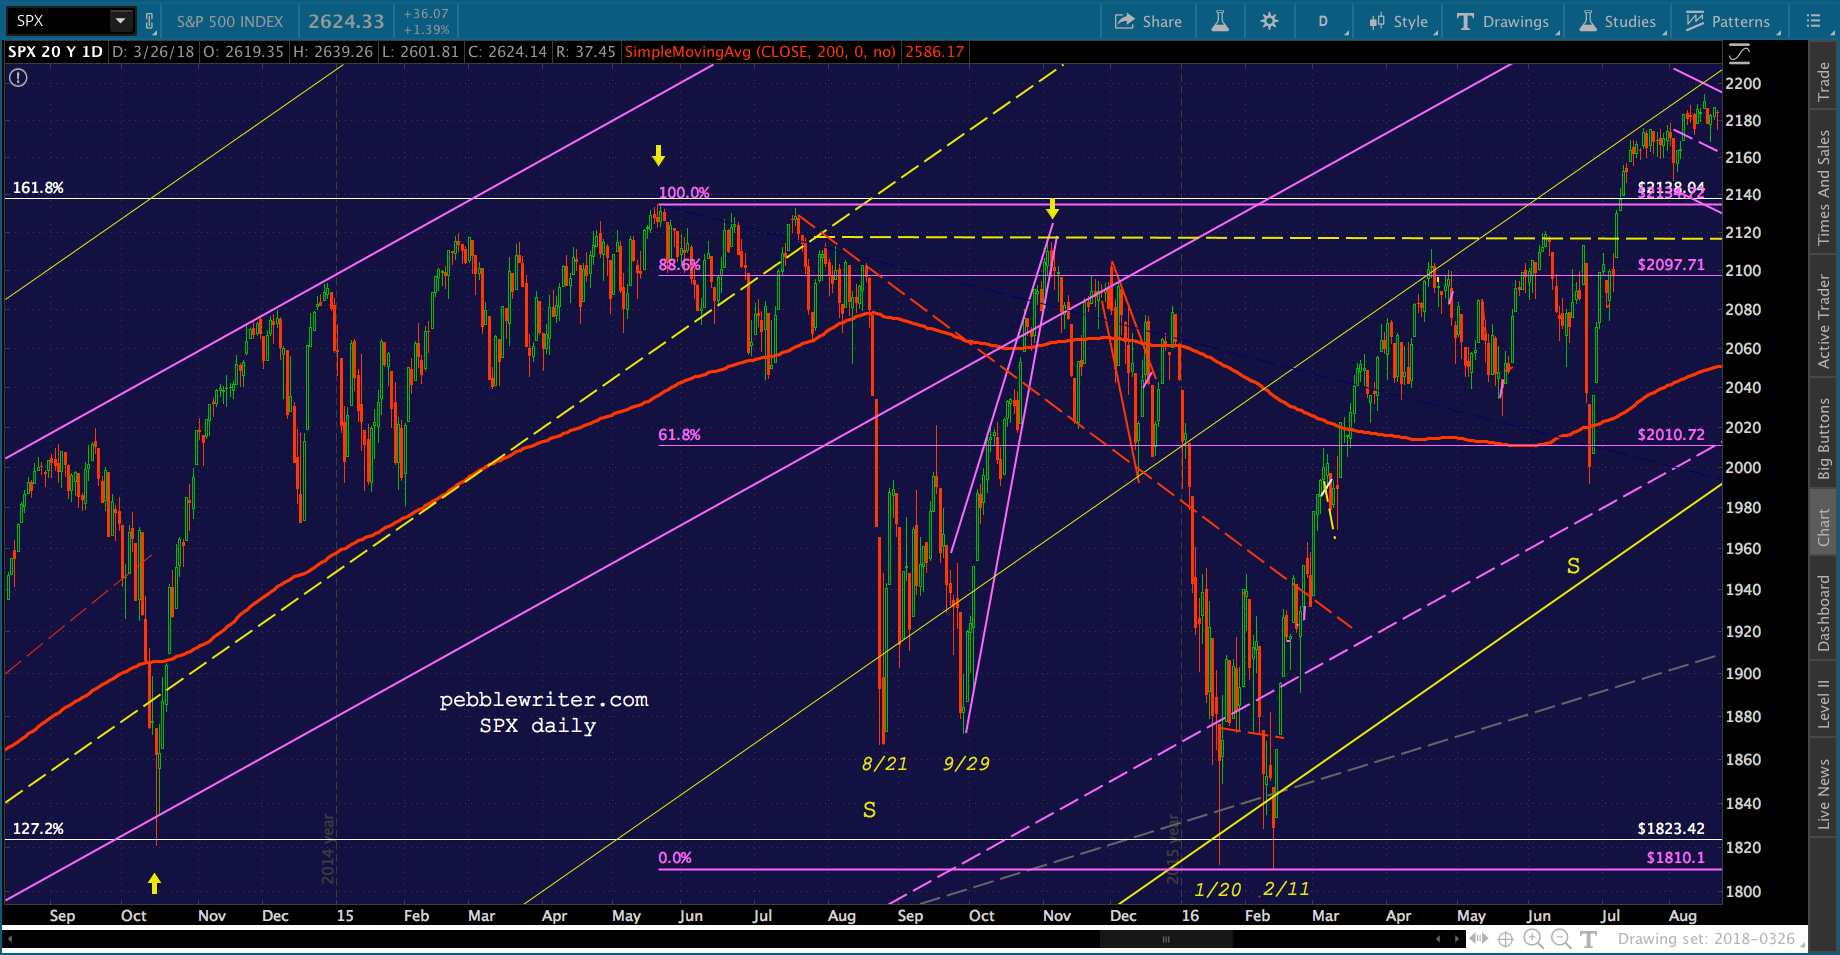 This is the first time SPX has tagged the SMA200 since the last break above the 1.618 at 2138. If the SMA200 were to fall, now, the closest major Fib would be that 1.618 — another 18.5% below current levels.
 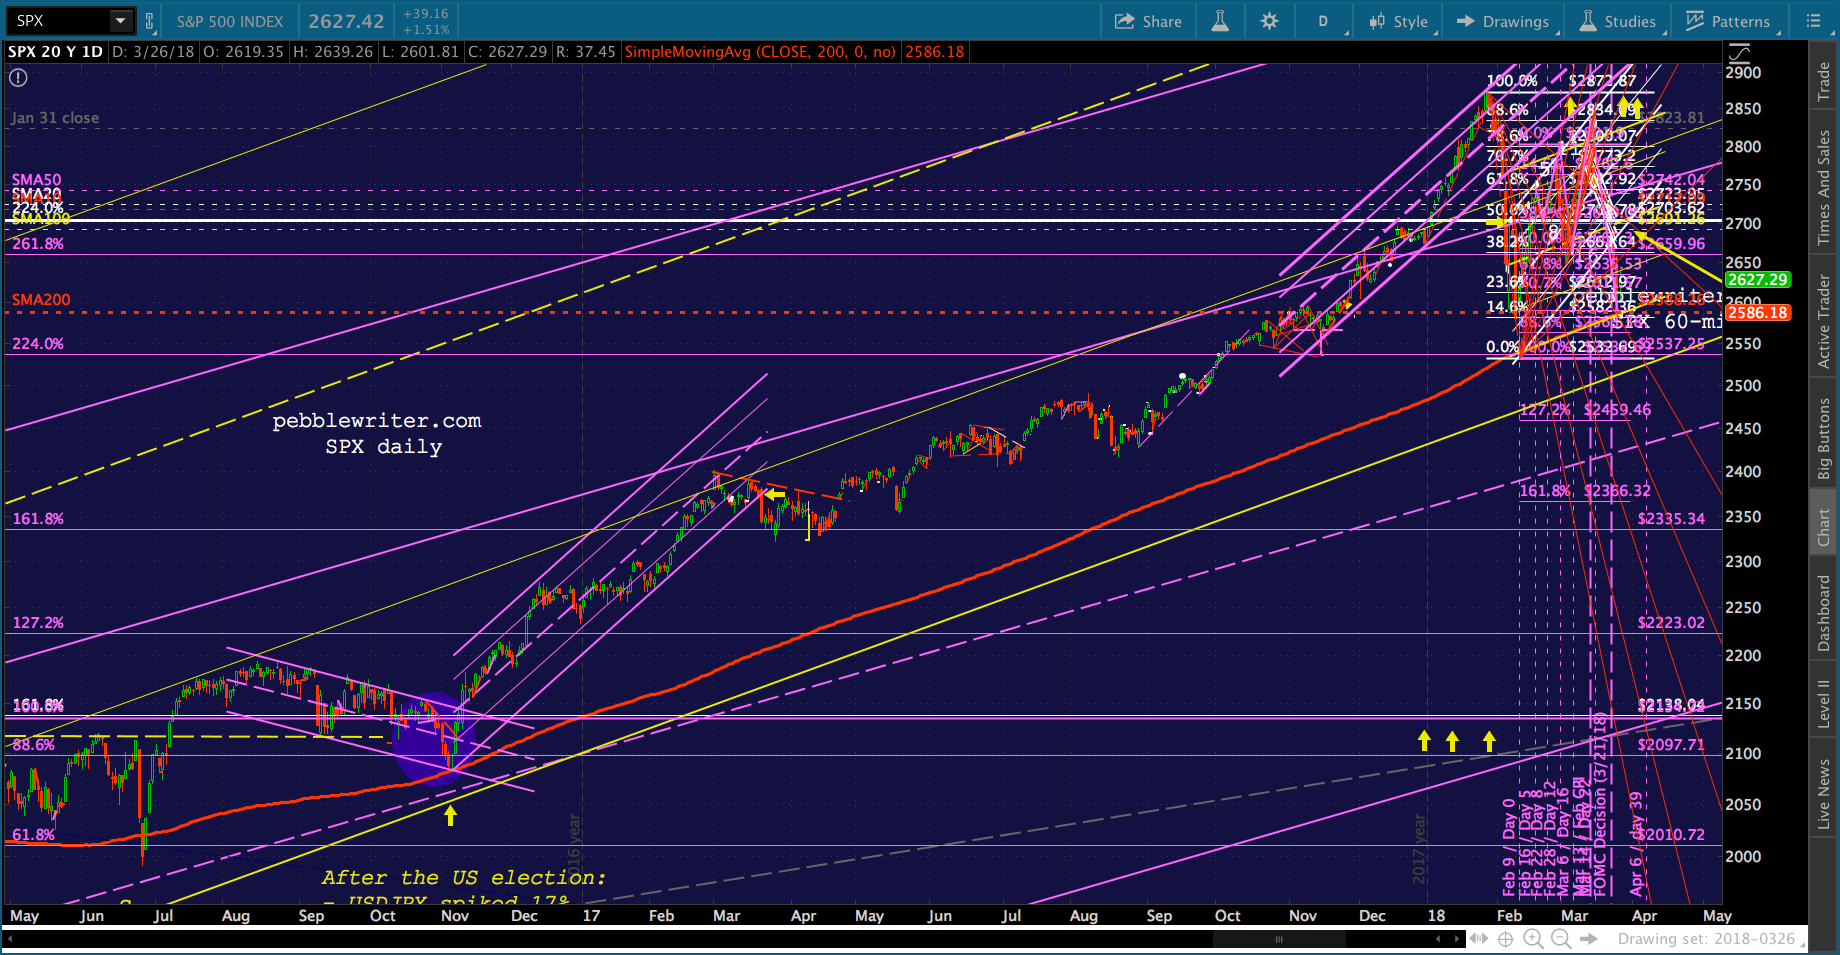 There are other lesser levels which might help, such as the purple 1.618 or 2.24. I can make a decent argument for each. But, ultimately, the SMA200 will be the line in the sand. If it falls, and the .886 Fibs fall (2560 and 2563 for ES and SPX), then we’ll be working on an C=A corrective wave that suggests 2453 for ES and 2460 for SPX (also, flag pattern targets.) But, we’ll cross that bridge if/when we come to it.
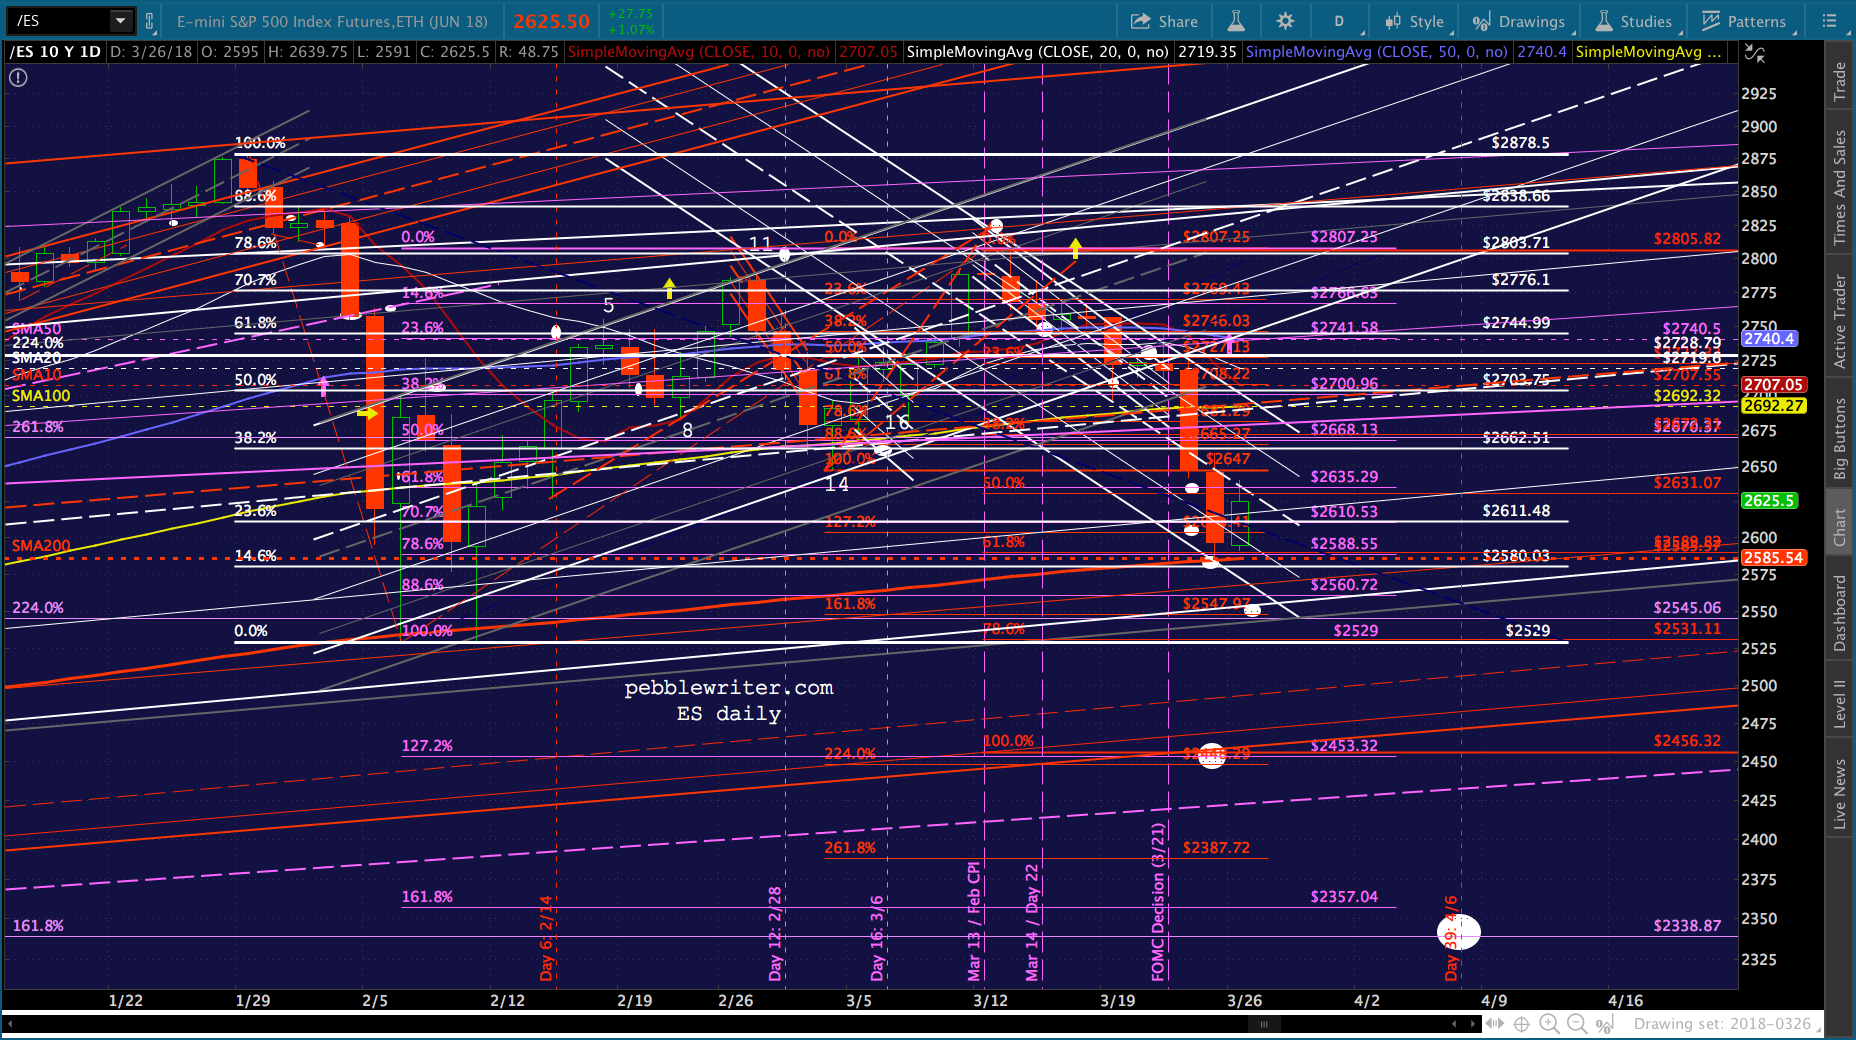 In the meantime, we have a sizable bounce on our hands. At present, it looks likely to backtest the channel midlines below which it recently fell — about 2700 for ES and SPX (also SPX’s 2.24.)
 And, if we get that big a bounce, 75 points or almost 3%, look for VIX to lead the way with a drop through the white channel bottom to/through the purple channel top around 13.27.
I’ll be out the rest of the afternoon. GLTA.