Year: 2017

  • This is a Test

    Yesterday, we got a taste of what happens to United Airlines passengers who are “disruptive and belligerent.”   In what is being described as one of the biggest PR fails in recent memory, United CEO Oscar Munoz defended the action taken to forcefully drag an Asian-American doctor from a flight that United had overbooked.

    No doubt United would have found the volunteers it needed had it upped the compensation it was offering to $1,000, $1,500 or even $2,000.  Instead, it will pay millions to the passenger, and many more millions in lost revenues from prospective passengers who are too horrified to “fly the friendly skies.”

    The stock is likely headed for at least 61.72, a 14% drop from yesterday’s highs — about $3 billion off its market cap.  And, that would be a positive outcome — if it’s able to hold both horizontal support and its SMA200.

    While the event itself was shocking, it’s equally surprising that the CEO of a major airline could be so tone deaf as to email his employees that “I want to commend you for continuing to go above and beyond to ensure we fly right.”

    The most interesting CEO on the world stage, right now, is our own Donald Trump.  He faces much greater challenges than Munoz did: escalating military conflicts with both Syria and North Korea and, by proxy, Russia and China.

    We’ve had a taste of Trump’s leadership skills with respect to the battles over health care, tax reform, and scores of executive orders relating to the environment, energy, etc.  He won some, and he lost some. None of those, however, involved the risk of nuclear war.

    Is it any wonder that investors are a little nervous and stocks have, so far, not shaken off this particular geopolitical risk?

    On Feb 10, SPX broke out of a large, year-old channel that was averaging 17% YoY returns.  It has backtested that channel top seven times in the past several weeks — including a serious plunge below it on Mar 27.

    Today, it’s happening again.  Will it survive this test?  It might just depend on whether or not Trump survives his.

    continued(more…)

  • How Long Can This Go On?

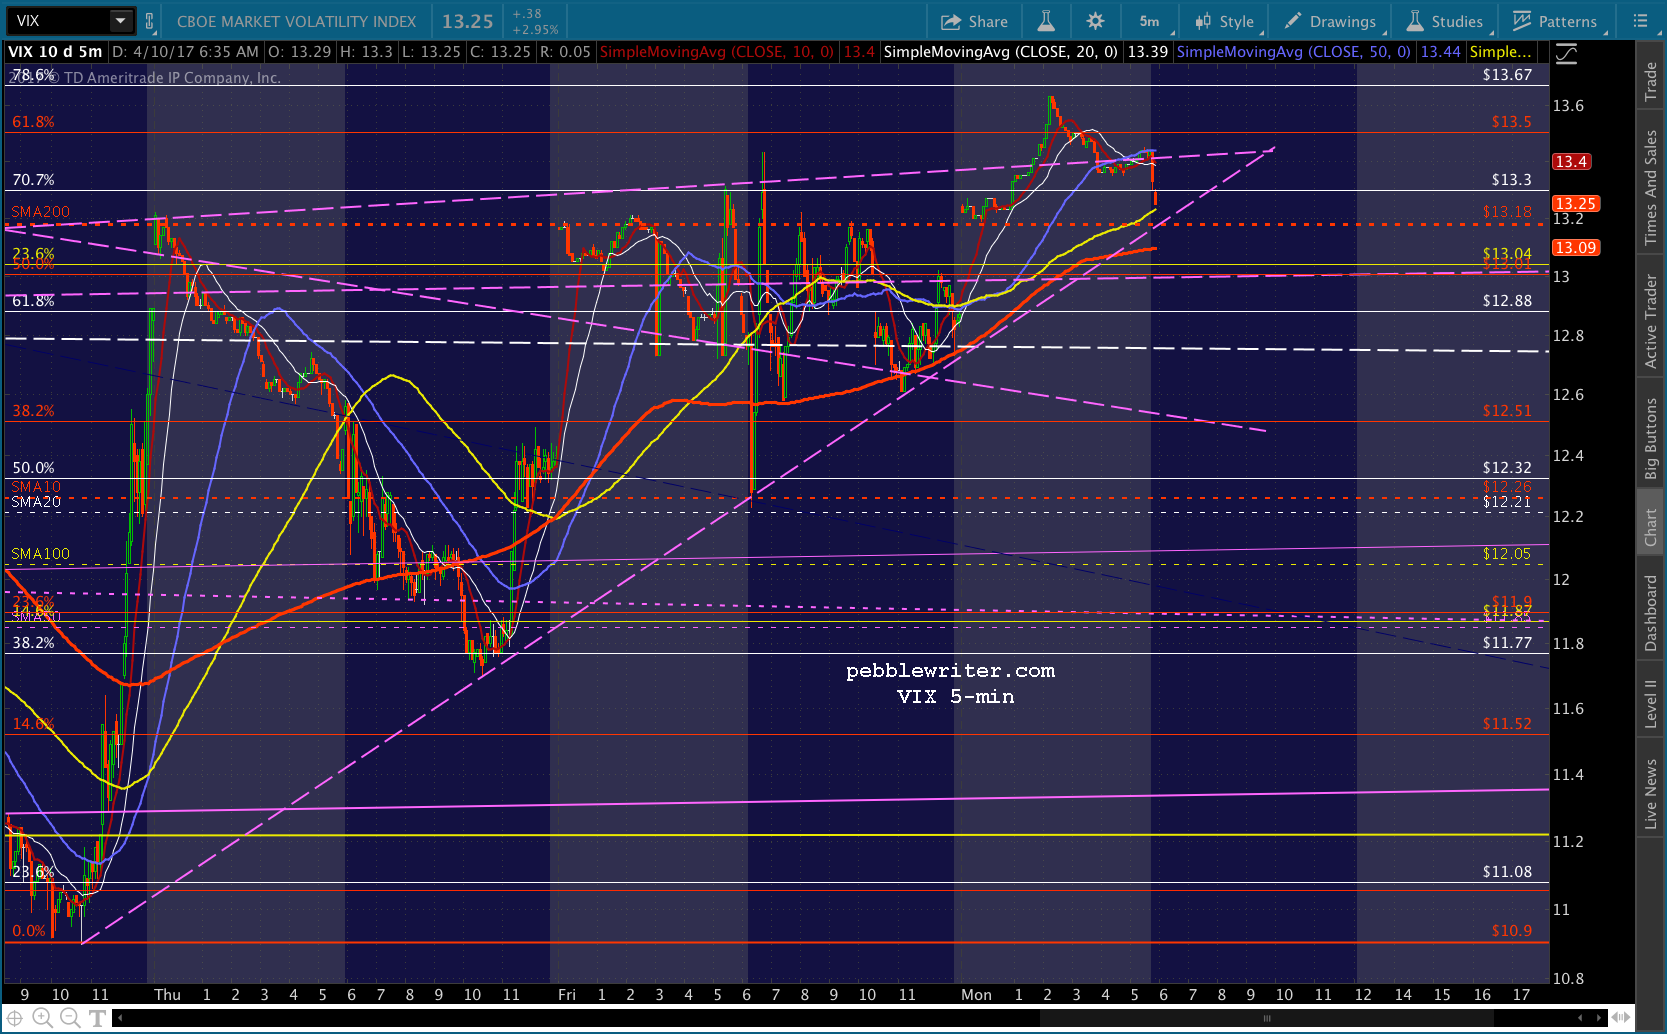
    Any other time, it might seem odd that e-minis are in the green even as VIX has rallied 4.5% overnight.  But, such is the nature of today’s “markets,” when the motive, the opportunity and the tools are all in the hands of central bankers who are determined that stocks hold their breakout levels.

    They can pull stunts like sudden spikes in USDJPY or CL when stocks threaten to break below key support levels — as they have multiple times this past two weeks.  Friday, it was USDJPY which broke out — driving stocks higher just like it did on Wednesday.

    Maybe today, it’ll be another VIX slam back below the trend line of support it established for just such a purpose.

    Regardless of how it’s done, you can bet they’ll pull out all the stops — convincing investors to ignore any relevant fundamentals or the mounting geopolitical risks.  How long can this go on?

    continued for members(more…)

  • Charts I’m Watching: Apr 7, 2017

    Plenty going on this morning, with a huge miss in jobs on top of the Syrian missile attack.  Futures have largely shaken both off, thanks to a relatively strong dollar and a surge in oil prices.

    Again, as we’ve been reporting all week, markets sit right at support — meaning the breakout or breakdown question remains unsettled.  That doesn’t mean we don’t have some strong clues.

    continued for members(more…)

  • A Broken Record

    Yesterday’s failed breakout landed SPX right back at the support on which we’ve been focused for the past several months.  Can fundamentals matter?  If so, the Fed’s recognition that equities are overvalued means it’s destined to fail.  Spoiler alert: not if algos have anything to say about it.continued for members(more…)

  • Fed Minutes: How Hawkish Are They?

    Markets tend to moves higher on Fed minutes days, even if the news isn’t all that positive.  It’s all about convincing investors that the FOMC has their best interests at heart — that all they’re worried about is making sure that stocks continue to rally.

    Today’s session is slightly complicated, then, by ADP employment which came in much higher than expected: 263K versus 175K.  Theoretically, this puts pressure on the FOMC to raise rates and/or trim their balance sheet faster than anticipated.  But, central banks have many tools at their disposal to ensure that the complication doesn’t become a problem.

    S&P 500 futures are up 6.5 points, but right to Fib resistance.  

    Can the Fed spin a hawkish set of minutes into something positive for stocks?

    continued for members(more…)

  • Breakout or Break Down?

    SPX has been holding on to the breakout it accomplished on Feb 10, but is having a hard time convincing traders that it belongs here.  The price action in ES suggests it isn’t legit… and might not last.

    continued for members(more…)

  • Update on USDJPY: Apr 3, 2017

    Although I include USDJPY charts in practically every daily post, it’s been a while since I dedicated an entire post to its latest meanderings.  In our November 27, 2016 update, with USDJPY at 112.62, we were looking for it to backtest a recently topped channel midline and continue higher to tag 115.58 or 120.11.

    As it turned out, the pair was so focused on assisting SPX to a positive end-of-the-year print that the backtest never really happened.  In fact, when the rising purple channel finally broke “down” it resulted in a 5% rally, albeit at a slower pace.

    USDJPY pushed past 115, but never could make to to 120.11, falling 1.2% short.  I puzzled over its failure to seal the deal, then pretty much forgot about it after USDJPY broke down and started tagging our downside targets.

    Now, another 7.2% to the good, I’ve discovered that it actually made perfect sense for USDJPY to reverse where it did.  In fact, it appears to offer great clues as to what comes next.

    continued for members(more…)

  • Charts I’m Watching: Apr 3, 2017

    Problems, problems, problems.  Oil rebounded nicely though the quarter end, but is creating inflation problems.  USDJPY also rallied, but a cheaper yen is not what the Japanese need right now.  After 3 tags of a long-term channel way below its averages over the past few years, VIX has dipped below it 18 times in the past 67 sessions.  People are starting to talk.

    Fed presidents, perennially optimistic about the economy, are talking up the possibility of up to three more rate hikes in 2017 — not exactly good news for a nation already maxed out on its credit cards with equities at all-time highs.

    Is there an easy way out?

    continued for members(more…)

  • Update on AUDUSD: Apr 3, 2017

    It’s been quite a while since I took a look at AUDUSD.  I remember the last time [see: May 16, 2016 Update] having some difficulty squaring the harmonic picture with the long-term channels.  They just didn’t line up in any logical way.

    In spending the past few days staring at the charts, it makes a bit more sense now.  But, you have to simultaneously look at USDJPY, DX, EURUSD, SPX and CL.  Good thing I have a lot of monitors.

    At the time of that last post, AUDUSD had just tagged its 200-day moving average — normally a excellent spot for a bounce.  But, it didn’t seem quite ready at the time.

    It’s reasonable to believe AUDUSD will bounce strongly off its SMA200, but the falling red channel suggests otherwise.   Anyone tempted to trade the bounce would do well to wait for it to clear the SMA100 first.  If it can’t, there is much more downside potential.  That .886 at .6584 is still out there, waiting. 

    As it turned out, the pair only bounced for one day before dropping through the SMA200 and spending the next two weeks searching for a bottom.  It never made it down to .6584, which is actually helpful in constructing our new forecast.

    continued for members... (more…)

  • PCE Tops 2%

    It’s been a long time coming.  But, the Fed’s favored measure of inflation finally topped its long-stated target of 2%. Of course, they prefer the “core PCE” which excludes food and energy price changes.  Why?  It’s lower, and at 1.8%, puts less pressure on them to normalize rates.   Either one of them is preferable to the also understated CPI which, at 2.7% YoY last month (before another month of 28% gasoline price increases) comes closer to an accurate measure of inflation.

    But, for accuracy, we have to look to alternative measures such as that of economist John Williams, who runs ShadowStats.com.   For his primer on why actual inflation is so much greater than the BLS reports, CLICK HERE.

    courtesy of ShadowStats.com

    Nevertheless, futures aren’t loving the news, as it hints at a more hawkish pattern of rate hikes this year.  But, with this being the end of the quarter, we’ll have to see what sort of follow through we actually get.

    continued for members(more…)