Year: 2014

  • USDJPY Update: Aug 24, 2014

    The yen continues to suffer.  Rumor is the BOJ is ready to admit things ain’t going so well with Abenomics — which would presumably increase the odds of expanding QQE.  Not so sure about an expansion, as inflation is clearly becoming problematic (on account of the cheapening yen.)  Then again, this the same government that refuses to tell their citizens the truth about Fukushima…

    USDJPY tagged the .786 of the decline from the Jan 2 highs.  The pair looks overbought at 104+ but that doesn’t mean it can’t be more overbought.  CME/Globex has still not opened today (technical reasons) so who knows how US futures will respond.

    140824_192119_CQG_Integrated_Client_Chart_USDJPY_-_Japan_(Yen)_Daily

  • Charts I’m Watching: Aug 21, 2014

    The “market” is holding its cards close to the vest today, with everything poised to break out…just not doing it yet. ZN broke and is holding below the TL we identified a couple of days ago.  And, VIX is channeling lower, backtesting the support we discussed yesterday.


    2014-08-21-VIX + ZN 0650


    USDJPY, in particular, isn’t contributing to the bullishness in the short run.  As SPX comes up on its double top, remember that these patterns are not terribly reliable in an unrigged market.  In this one, we should be especially wary.

    GLTA.

    UPDATE: 10:05 AM

    Keep an eye on VIX, lots of games being played today.

    2014-08-21 VIX 1 min 0700

  • Fed Minutes Day

    The algos got going from the start, this morning. VIX pummeling turned what looked like a soft opening into new highs.

    2014-08-20-vix 1 0732

    Lots of volatility, as is typical of Fed minutes days.

    2014-08-20-tick 5 min 0732

    Trade safe…

    UPDATE:  1:30 PM

    The minutes are due out in 30-min or so.  The algos have done their job, preparing the “market” for a breakout.  Note VIX is back to the daily lows, and the 10-yr futures were jammed lower overnight through the red support TL we discussed yesterday.

    2014-08-20-ZN + VIX 1030

    SPX has not only retaken the .886 that should have caused more than a 4-pt decline, but has completed a small Crab Pattern on the day.  Note the seeming inability to get anything going on the downside — the algos at work.

    2014-08-20-SPX 5 1030

    The chart below shows the dollar-yen’s intervention to rescue ES multiple time, and then shoe horn it up over the .886 we discussed yesterday.  The red arrow IDs the midnight bump that broke the downtrend prevailing at the time.  The others represent various other efforts to keep it on an upward trajectory.  The latest, around 11:30 ET, prevented USDJPY from completing a little H&S pattern and allowed SP/ES to post new highs.


    2014-08-20-USDJPY v ES 15 1040

    Remember that almost every minutes released in the past year produced an initial (sometimes meaningful) dip to suck in those willing to place a bearish bet, followed by a sharp snap back rally that punished those who questioned the Fed’s wisdom.  GLTA.

    UPDATE: 2:50 PM

    Concerned, but accommodative, slack, debate, rate-hike, blah, blah, blah…  Sellers tried to get some downside going, but USDJPY (in purple) kicked in before even a .786 retrace on the day’s gains and helped SPX back above the important .886 at 1981 and to new intra-day highs.  Will these gains stick, or will be get another 3am “adjustment” in the eminis?  Stay tuned.

    2014-08-20-USDJPY v ES 1 1154

  • Update on Bonds

    Just a quick note regarding the 10-yr…

    Still a lot of upside from a harmonic standpoint, with the .886 at 127’205 looking nice and juicy now that the falling channel purple is safely in the rear view.

    2014-08-19-ZN daily 1800

    Note the nice support on the 60-min chart that suggests another strong upside move is in the offing.

    2014-08-19-ZN 60-min CU 1800

    The bond market clearly expects something that the stock “market” doesn’t.

  • Breadth Thrust Misses

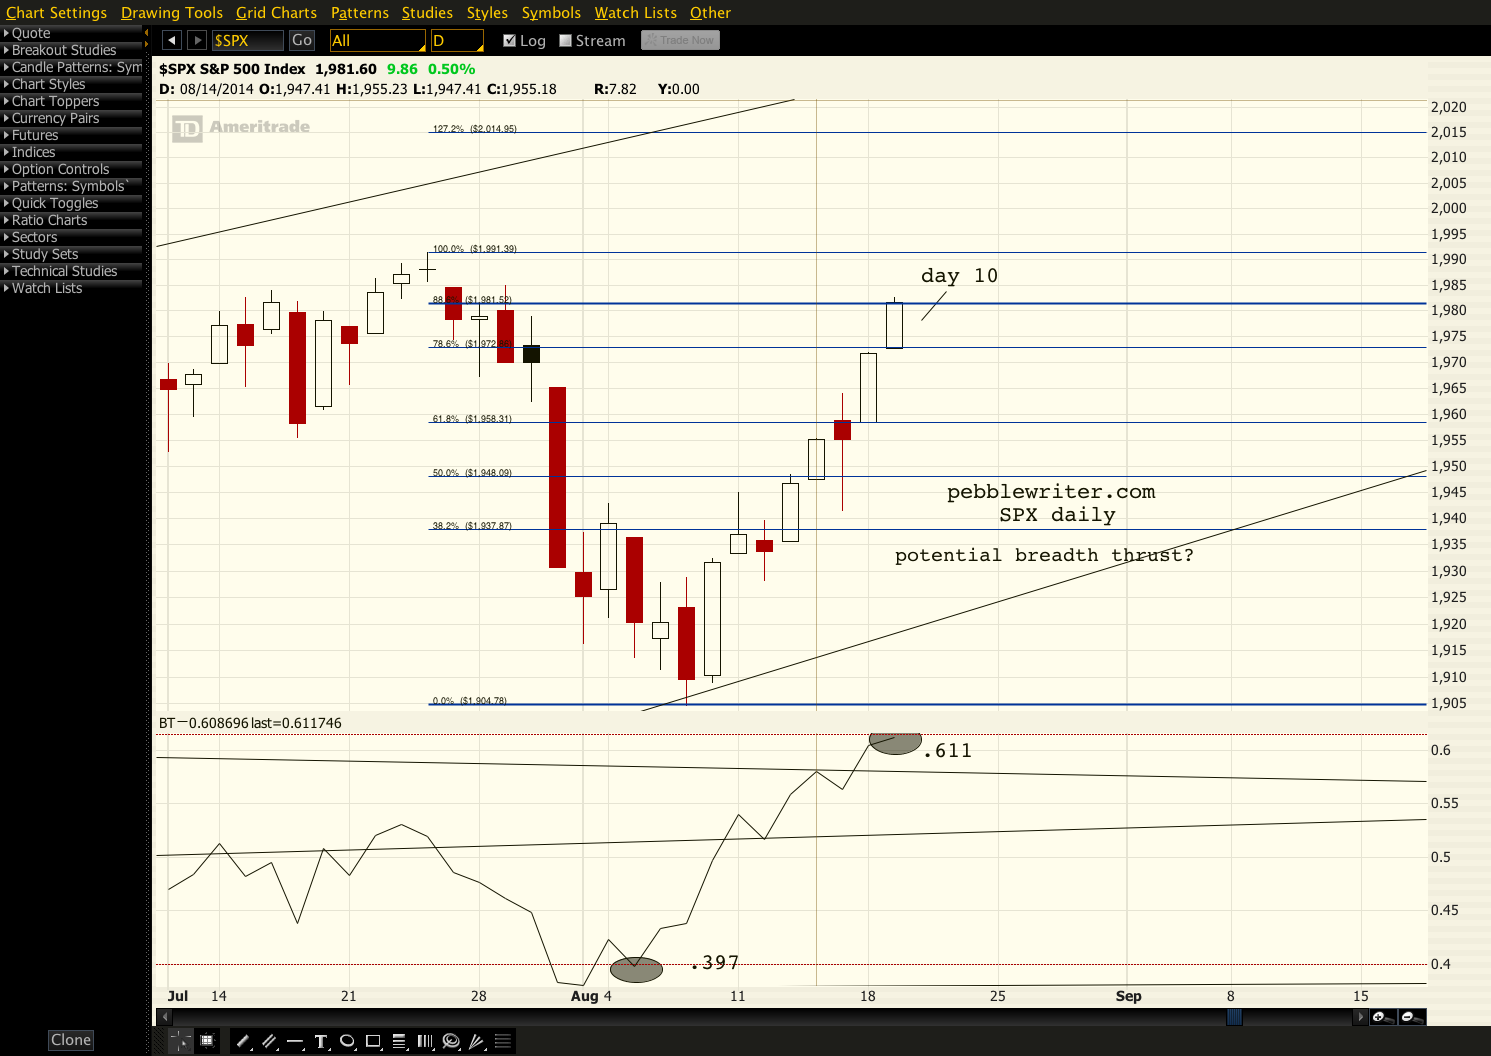
    According to Prophet, NYSE breadth just missed triggering a Zweig Breadth Thrust.  Recall we needed to see .615.  Today, (the 10th day) breadth closed at .611.  To state the obvious, this does not mean the market will instead correct.  Today, on the lowest volume day of the entire year, SPX had no trouble tacking on another 10 points.

    It’s worth noting, however, that it did complete a bearish Bat Pattern at the .886 Fib.  In an unrigged market, a Bat Pattern would be good for a retreat to at least the .786 (1972) and more commonly the .618 (1958) or lower. Fed minutes are due out tomorrow at 2pm ET.  So, of course, anything could happen.

    We should expect that the end of QE will ding the “markets” significantly [then again, I thought the same thing in June when the worst GDP print (-2.9%) since the financial crisis hit…and, SPX gained 10 points on the day.]  And, to the extent the minutes reinforce the timing/certainty of the end, or hint at a quicker interest rate rise than investors would like, they could exacerbate any downside potential.

    2014-08-19-SPX BT Prophet

    Stay tuned…

  • Decisions, Decisions…

    Today’s pregnant pause is brought to you by the good folks at Acme Marketbots — who would just as soon not allow SPX to reach its .886 during market hours, when traders might do something reckless like short a few overpriced stocks (it’s not just me talking, check out Shiller’s latest.)

    As we discussed yesterday and last week, there’s also a Zweig Breadth Thrust in the works.  With the daily BT currently at .618, it’s safe the say the bots will do what they can to engineer a close at or near current levels.  And, manipulating breadth is relative child’s play for the mens et manus of the PhDs behind the scenes.

    What might we be facing, were the algos not in firm control?  For one, USDJPY has reached the .886 retracement of the drop from 103.07 to 101.5 that began on July 30. This would ordinarily set up a decent sell off.   These days, it’ll happen only if/when the central planners see fit (if at all.)

    Truth be told, USDJPY tagged 102.89, and the .886 is 102.897.  So, the Bat isn’t technically complete because the engineers haven’t allowed it just yet.

    2014-08-19-USDJPY 60-min

    Ditto for SPX — which the bots are holding 1/2 point shy of the actual .886 Fib line at 1981.52.  If it does surpass 1981.52, there will likely be some very vigorous pumping of the USDJPY to make sure SPX just keeps on going.

    2014-08-19-SPX 60-min 1000

    Remember when stocks moved up and down based on earnings, economic and geopolitical events, and good old fashioned fear and greed?  The “markets” might have been rigged back then, too.  But, at least the guys at the controls put a little thought into it — if for nothing else, to keep up appearances.  Sigh…

  • Breadth Thrust Update

    As discussed last week, there is a potential Zweig Breadth Thrust event in the works.  Recall that the ZBT was defined by Marty Zweig as a move in breadth from below .400 to over .615 within 10 trading days. In the past nine days, breadth (as calculated by Prophet) has risen from .39 to .604 — just shy of the trigger that is supposed to usher in a new(?) bull market.

    2014-08-18-SPX BT EOD

    In a July 2011 article, Tom McClellan noted that since the elimination of the uptick rule in 2007 and the advent of algorithmic trading, he wasn’t sure how valid the signal was anymore (he also discusses the different calculations folks use, and charts a few notable signal fails.)

    Today’s 16-pt gain was almost entirely courtesy of the futures last night – a very common occurrence, lately.  And, thanks to the algos, the validity of intra-day price movement isn’t much better [see: How Algos are Killing Off Traders.]  So, based on the principle of garbage-in, garbage-out, I’d have to admit I’m a little leery of any signals these days.  Then there’s Robert Shiller.

    In a NY Times piece this weekend, Shiller calls the US stock market “very expensive.”  The measure of valuation he favors, cyclically adjusted price-earnings or CAPE, has reached levels only exceeded in 1929, 2000 and 2007.  Yikes.

    On (perhaps) unrelated note, just came across this nice little documentary on the flash crash of 2010.  It touches on HFT, algorithms, etc.  Well worth the 45 minutes, IMHO.

    Money & Speed: Inside the Black Box


    note: the ZBT calcs are supposed to be performed using NYSE data.  Presumably, the Prophet calculation utilizes NYSE data and the 10-day EMA suggested by Zweig, but I cannot find a source within the program to confirm this.  Caveat emptor.


  • Charts I’m Watching: Aug 18, 2014

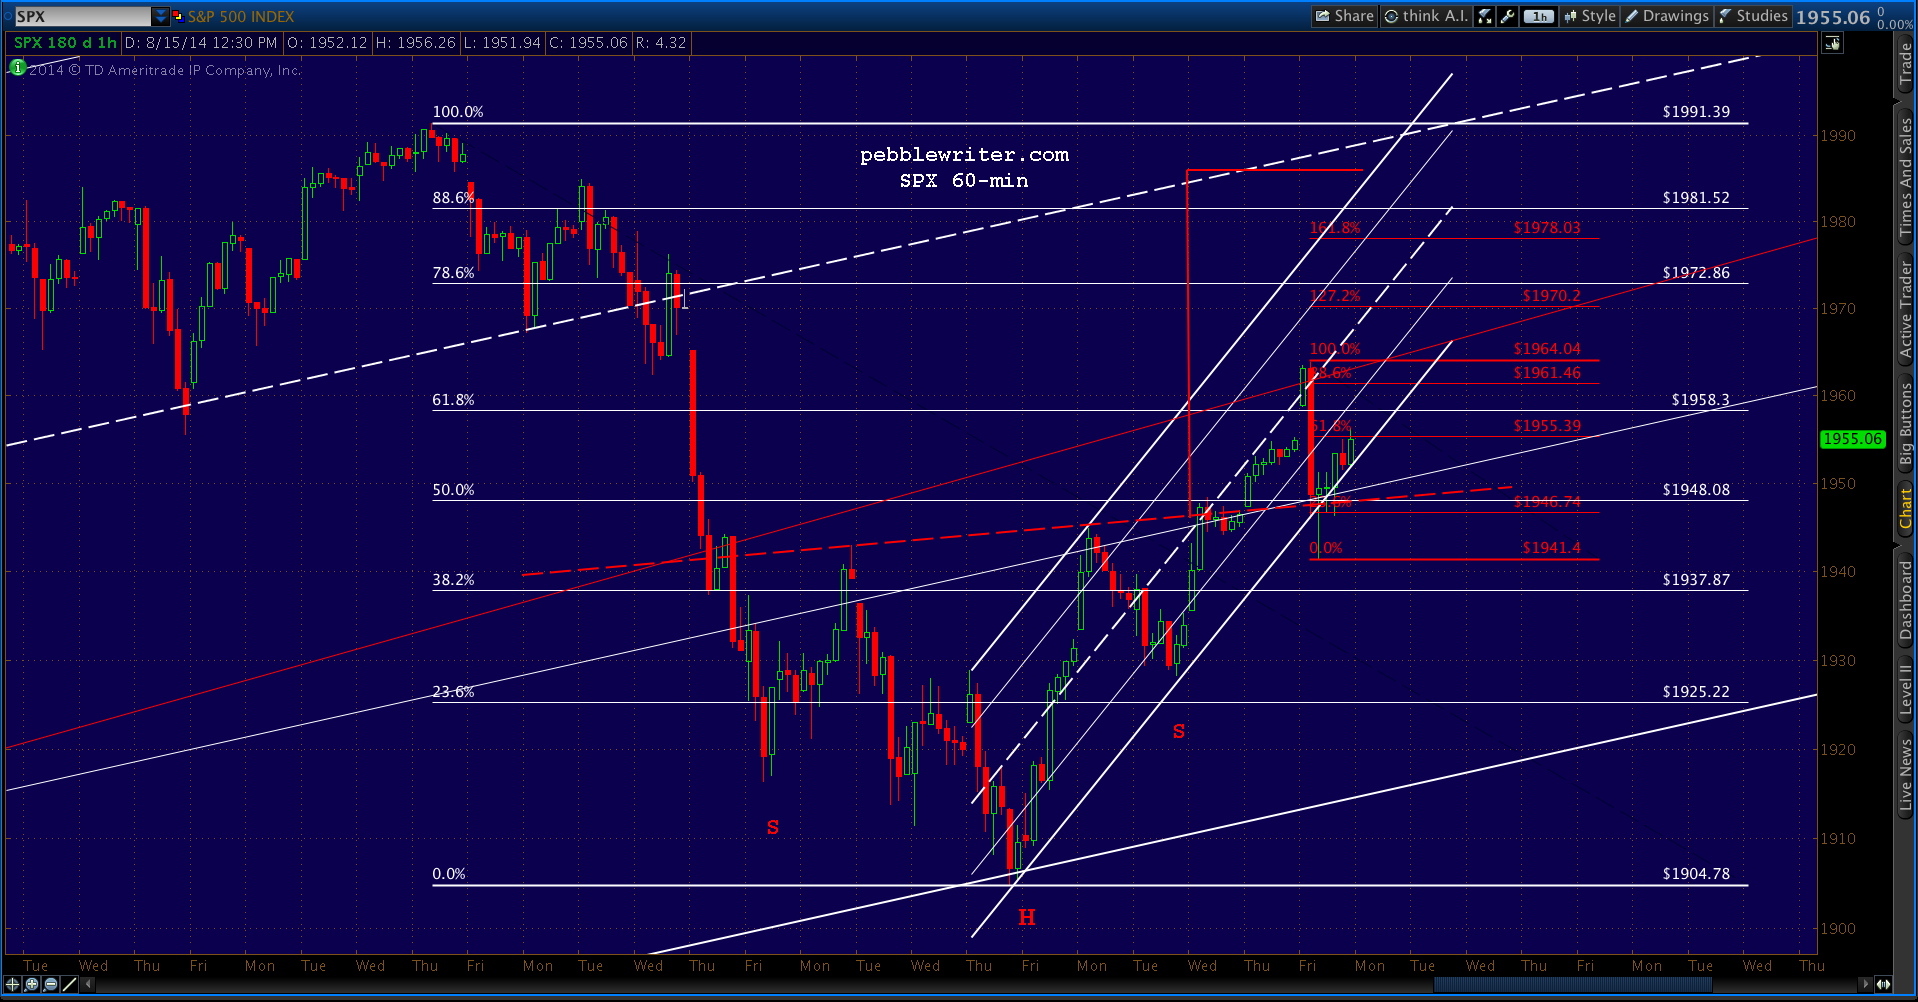
    ES has ramped about 10 points.  SPX is still working on the IH&S pattern forecast last week.  The neckline was defended on Friday, so I see no reason for it not to play out — other than a raft of economic and Fed news this week.


    2014-08-18-SPX 60 0600

  • Charts I’m Watching: Aug 15, 2014

    The futures ramp overnight provided a gap open for SPX, so they’re now trying to backtest the .618/SMA50 without killing the upward momentum.  Closing the gap would take us down to 1955.23.  And keep an eye on the 10-yr, which just tagged 2.38%.

    2014-08-15-SPX 15 0644

    FWIW, VIX is tracing out both a megaphone and a falling wedge that suggest a move higher (lower in stocks.)

    2014-08-15-VIX 60 0712

    UPDATE: EOD

    Bit of an understatement about the megaphone…

    2014-08-15-VIX 60 EOD

    Solid breakout, which was — of course — monkey-hammered into submission when SPX tagged its .618 retrace/SMA100 on the 60-min chart.

    2014-08-15-SPX 60 EOD CU

    It was a pretty wicked departure from the channel to have climbed right back in as though nothing had happened.  Even managed to close flat on the day.

    2014-08-15-SPX 60 EOD


    *  *  *  *  *

    For anyone who missed it, Nanex (reprinted with additional commentary by Zerohedge) published an explanation of the quote stuffing strategy being employed by Citadel — a $142 billion hedge fund that’s closely linked to the Fed — to manipulate prices.  Per NASDAQ, which sanctioned Citadel in June (as did FINRA):
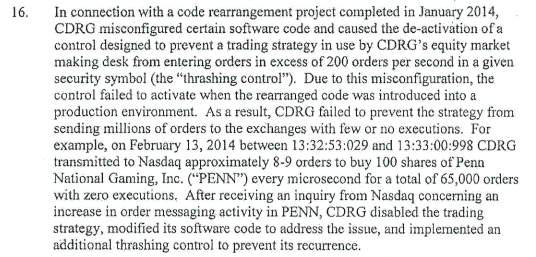
    We discussed quote stuffing just a few days ago [see: How Algos are Killing off Traders.]  My description was a little off: “hundreds or even thousands of orders are entered and cancelled within seconds in order to influence price direction.”  According to Nanex’s research, Citadel was placing upwards of 25,000 orders per second with, as NASDAQ confirms, “few or no executions.”

    The large red dots below are the instances for which Citadel got its wrist slapped. Each of the dots below represents an instance of quote stuffing to the tune of 6,000+ quotes per second — meaning orders were “live” for 1.6 millionths of a second.  According to Nanex, there were millions of other instances that were somewhat less egregious.

    Screen Shot 2014-08-15 at 6.33.05 PM

    This article, coincidentally, comes on the heels of a conversation I had with a quant who confirms that certain hedge funds are clearly pursuing predatory strategies — those that exploit traders’ expectations regarding traditional market analysis tools such as chart patterns, harmonics, moving averages, hell — even, the effect (or lack thereof) of news.  My hedge fund’s broker confirms that many funds are having a very difficult time trading these markets, and losses/redemptions are on the rise.

    I’m getting a clearer sense of why the chart patterns, harmonics and technical analysis has been so spotty the past year — after several years of very effective guidance.  It angers me that the regulators have allowed the integrity of the markets to erode so badly.  Turns out that Citadel is the first and only firm to be fined for running a quote stuffing strategy — quite shocking, given its prevalence.

    If you’re a trader, pass the word.

  • Charts I’m Watching: Aug 14, 2014

    Lots of overhead resistance for SPX today: SMA20 at 1952, SMA50 at 1956, .618 retrace of the drop from 1991-1904 at 1958.  But, it does have that IH&S going for it.

    2014-08-14-SPX 5 0639

    And, there’s something else that no one seems to be talking about — maybe, for fear of jinxing it?  If breadth can get up to the .615 mark by next Tuesday, we’ll have a Zweig Breadth Thrust on our hands.

    2014-08-14-SPX BT 0639

    It goes without saying that head & shoulders patterns have been miserably unreliable for the past 8-10 months.  Normally 70-80% effective, I’d rate them at about 10% lately (on par with other chart patterns, harmonics and, yes, even moving averages.)  But, bullish IH&S have certainly been more effective — especially with all the tools at TPTB disposal to nudge the markets higher and trample bears.  So, this bears watching.

    Last, I had a very interesting conversation with a high-powered institutional broker yesterday.  He works with many major hedge funds.  Top takeaway: performance is tough across the board for active traders, lots of losses and lots of redemptions.  I don’t need to explain to our readership that a market which is dominated by algorithms and government intervention is no longer a market.  I suppose there is some comfort in knowing I’m not the only one incredibly frustrated by the direction things have taken.

    GLTA.