

Year: 2014

  • Charts I’m Watching: Sep 5, 2014

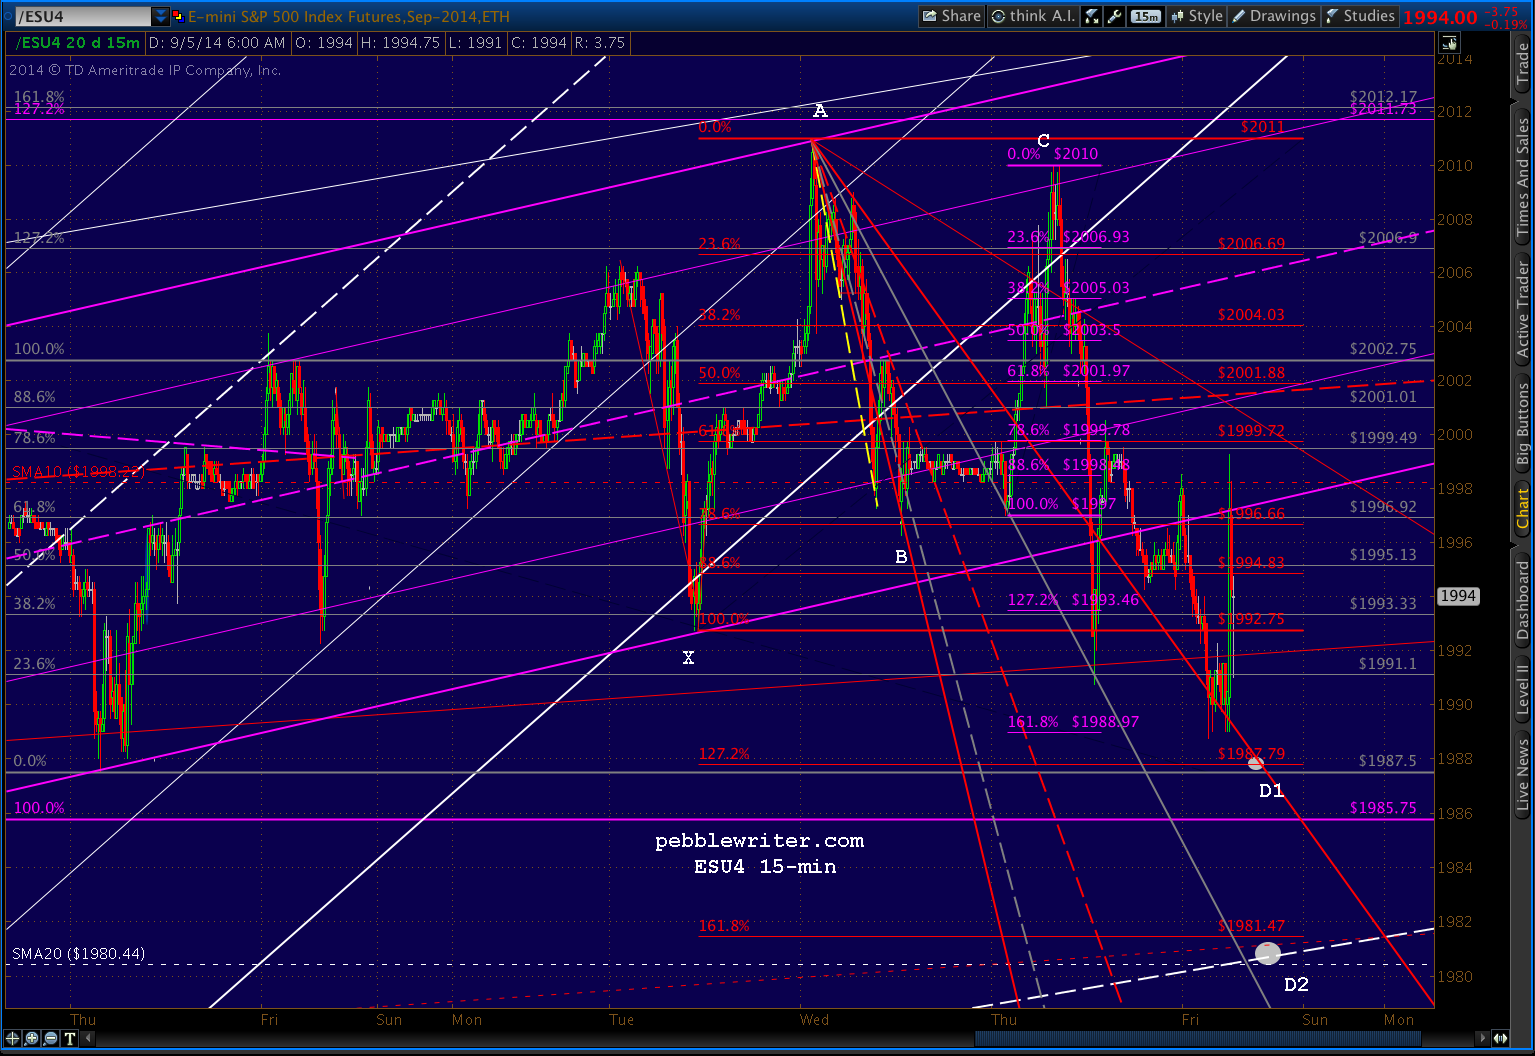
    Futures spiked 10 points on the crappy jobs data, then promptly gave most of it back.  Key chart factors: yesterday’s late day plunge further distanced stocks from the rising white channel.  The backtest we surmised would lead to a decline seems to be underway, but not without a fight from the algos — characterized by three backtests (so far) of the purple channel.  Yesterday’s downside target remains in play until stocks climb back into that channel and stay there.

    While D1 would suffice as a Butterfly Pattern, D2 (1980ish) represents the SMA20 and the red 1.618 and the larger white channel midline.  As such, it makes a much more appealing target — if TPTB allow the market to settle a little lower.  And, lately, that’s a huge “if.”
    2014-09-05-ES 15 0615

    Bonds prices shot up on the data this morning, clearing a falling channel.  And, the USDJPY is struggling after setting a new high overnight (based more on USD strength than JPY weakness.)

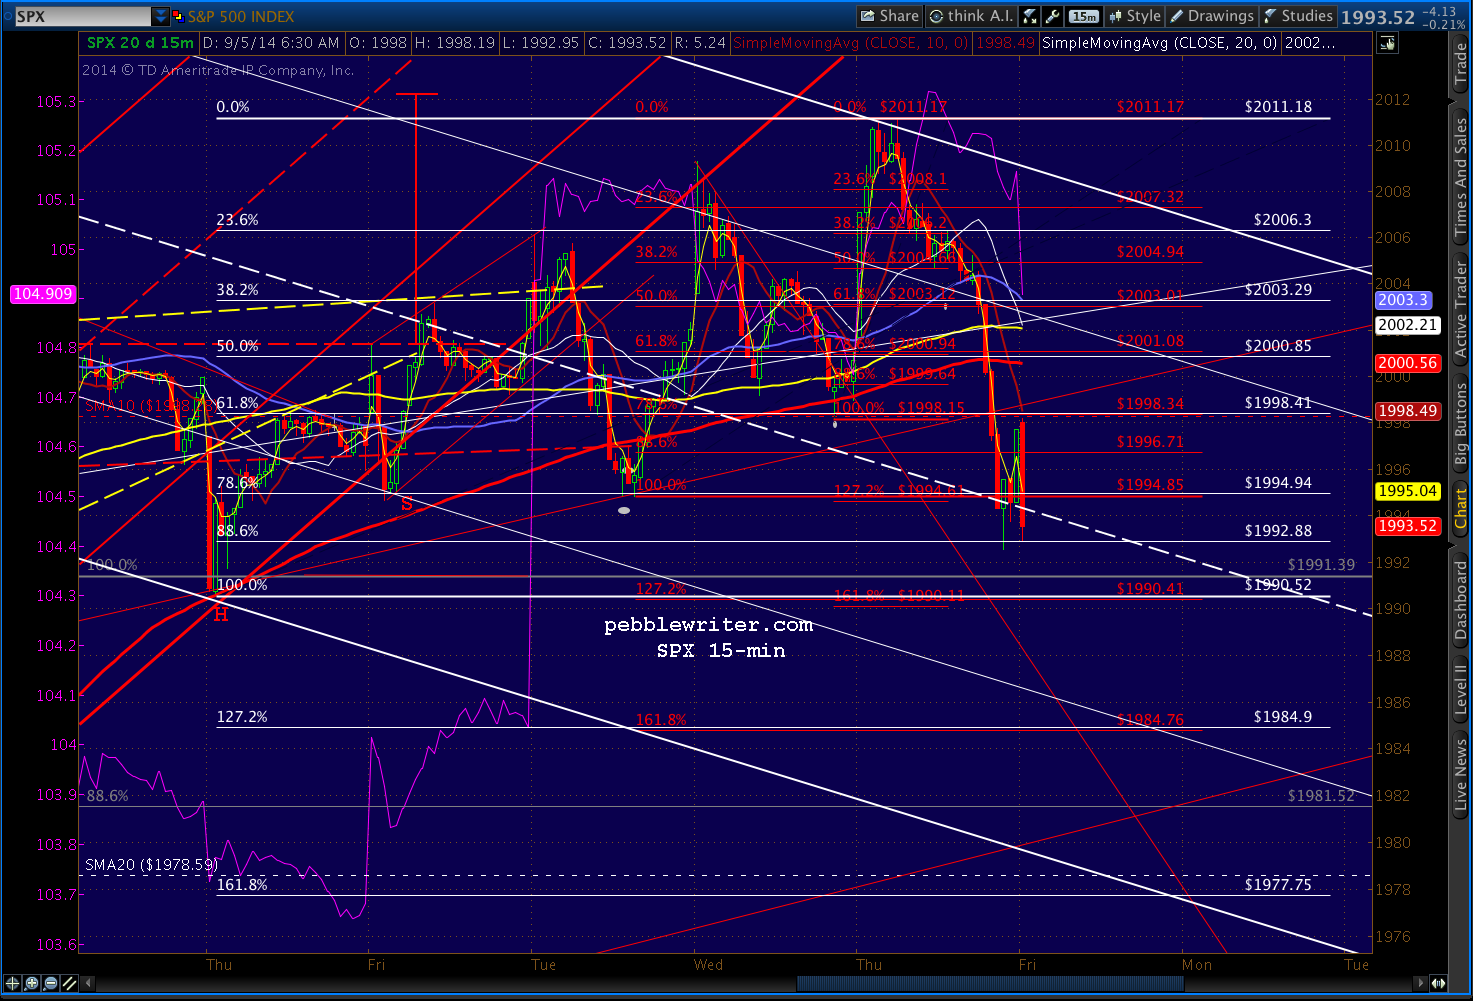
    The backtest by SPX is a little cleaner, but the same downside target is worth watching.  On the SPX chart, 1977 represents the SMA20, the white 1.618 and the falling white channel bottom.
    2014-09-05-SPX 15 0640


    UPDATE:  12:30 PM

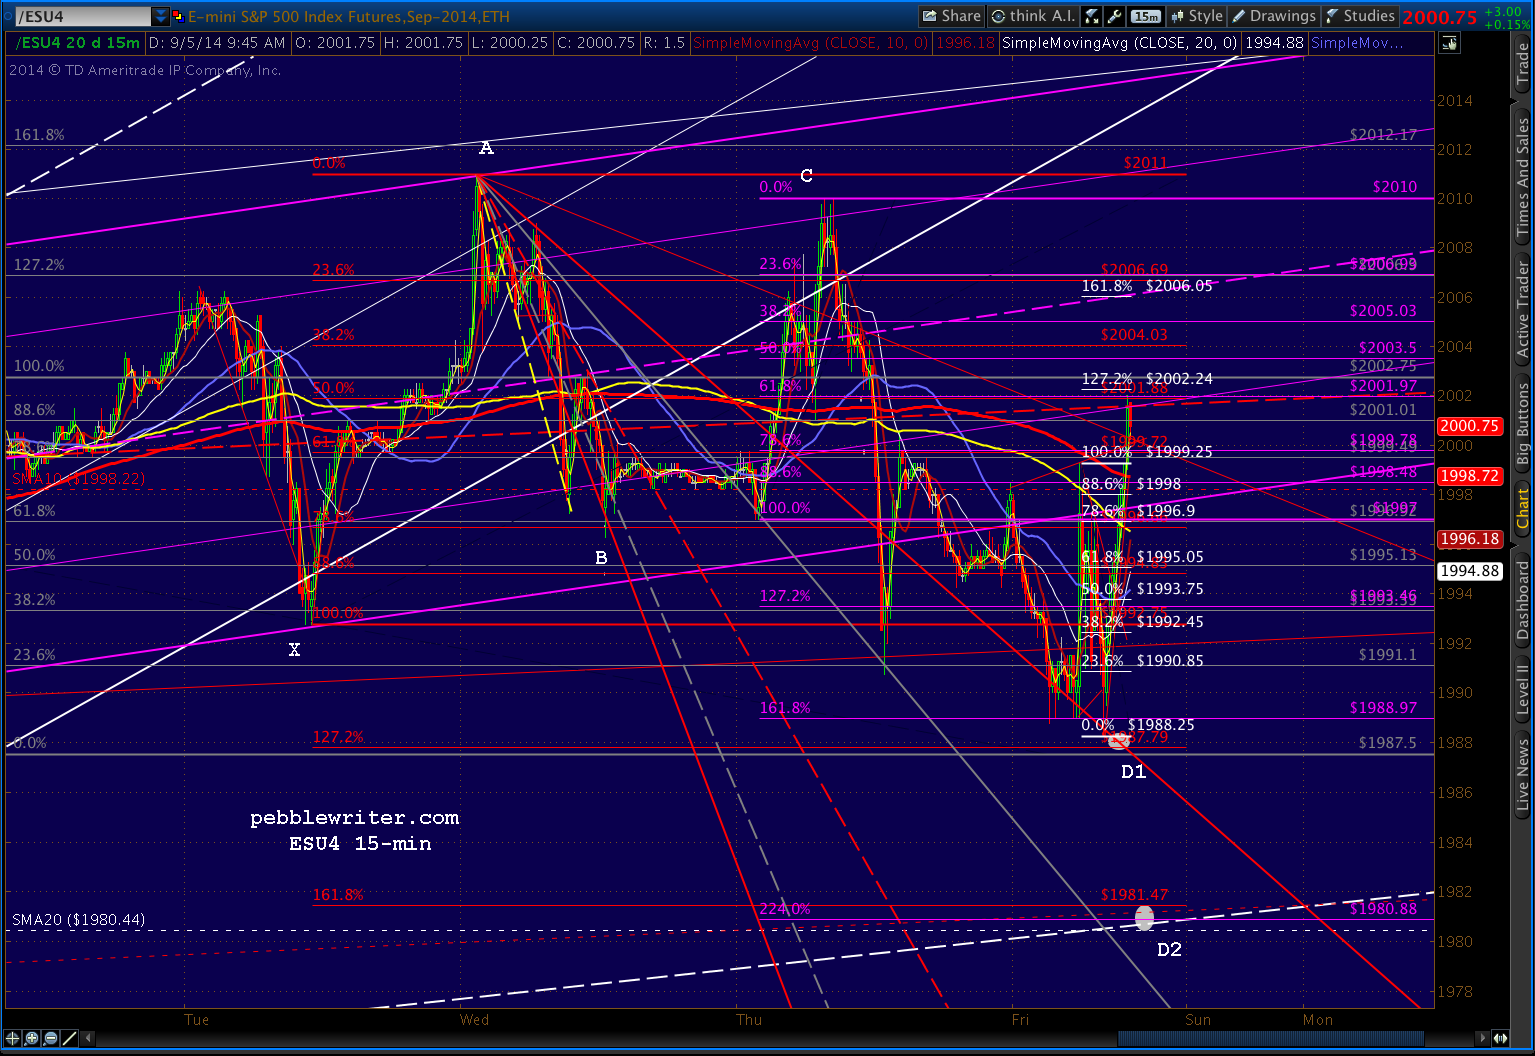
    ES tagged our D1 target on the nose this morning.  It remains to be seen whether we’ll get another thrust lower.
    2014-09-05-ES 15 1000

    Algos have taken over again, driving the DX up toward the .886 and SMA200 on 5-min chart.

    2014-09-04-DX 5 0922

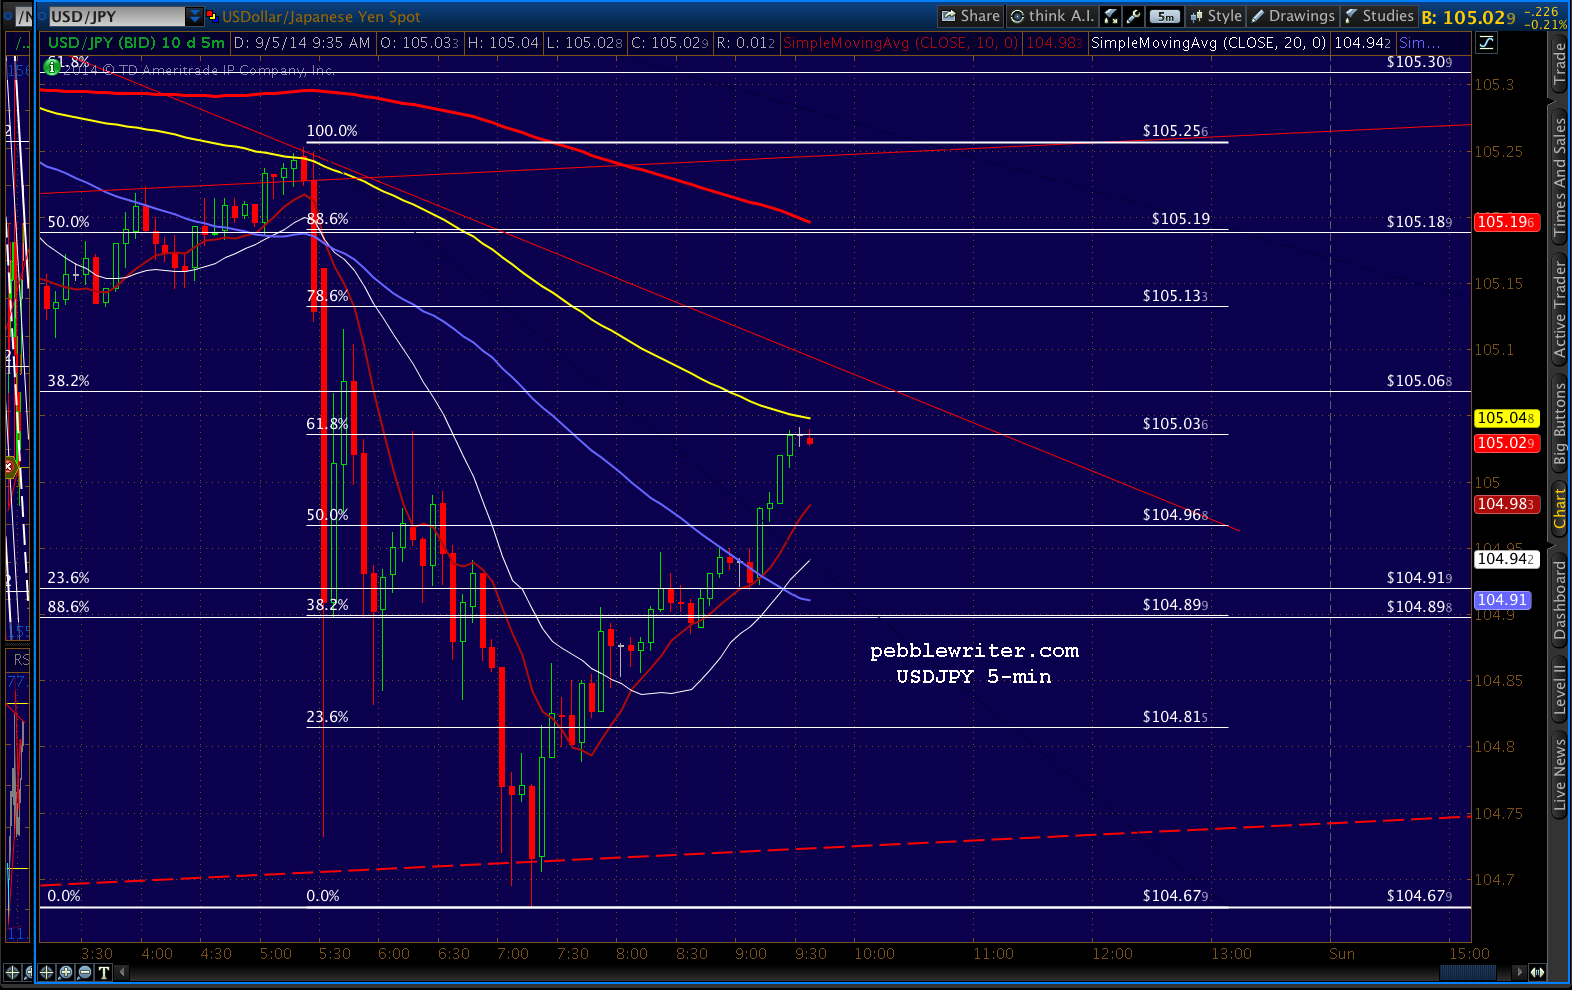
    Might get a reversal here, given that USDJPY is approaching its SMA100 on the 5-min — scene of its strong reversal early this morning.
    2014-09-05-USDJPY 5 0937

    Lots of fib and channel overhead resistance at SPX 2003ish…

    UPDATE:  2:55PM

    SPX overshot the resistance, and is possibly backtesting it as support.  FWIW, the yellow dashed line running through the chart is the neckline of the big H&S Pattern from July.  Its

    2014-09-05-ES 5 1153

    Seen below in yellow.  Take your pick of right shoulders — either done or something more balanced like the lower “S” at the white channel midline.  Obviously, prices have pushed through the neckline several times before — but, without any follow-through (your “market” run by algos…)
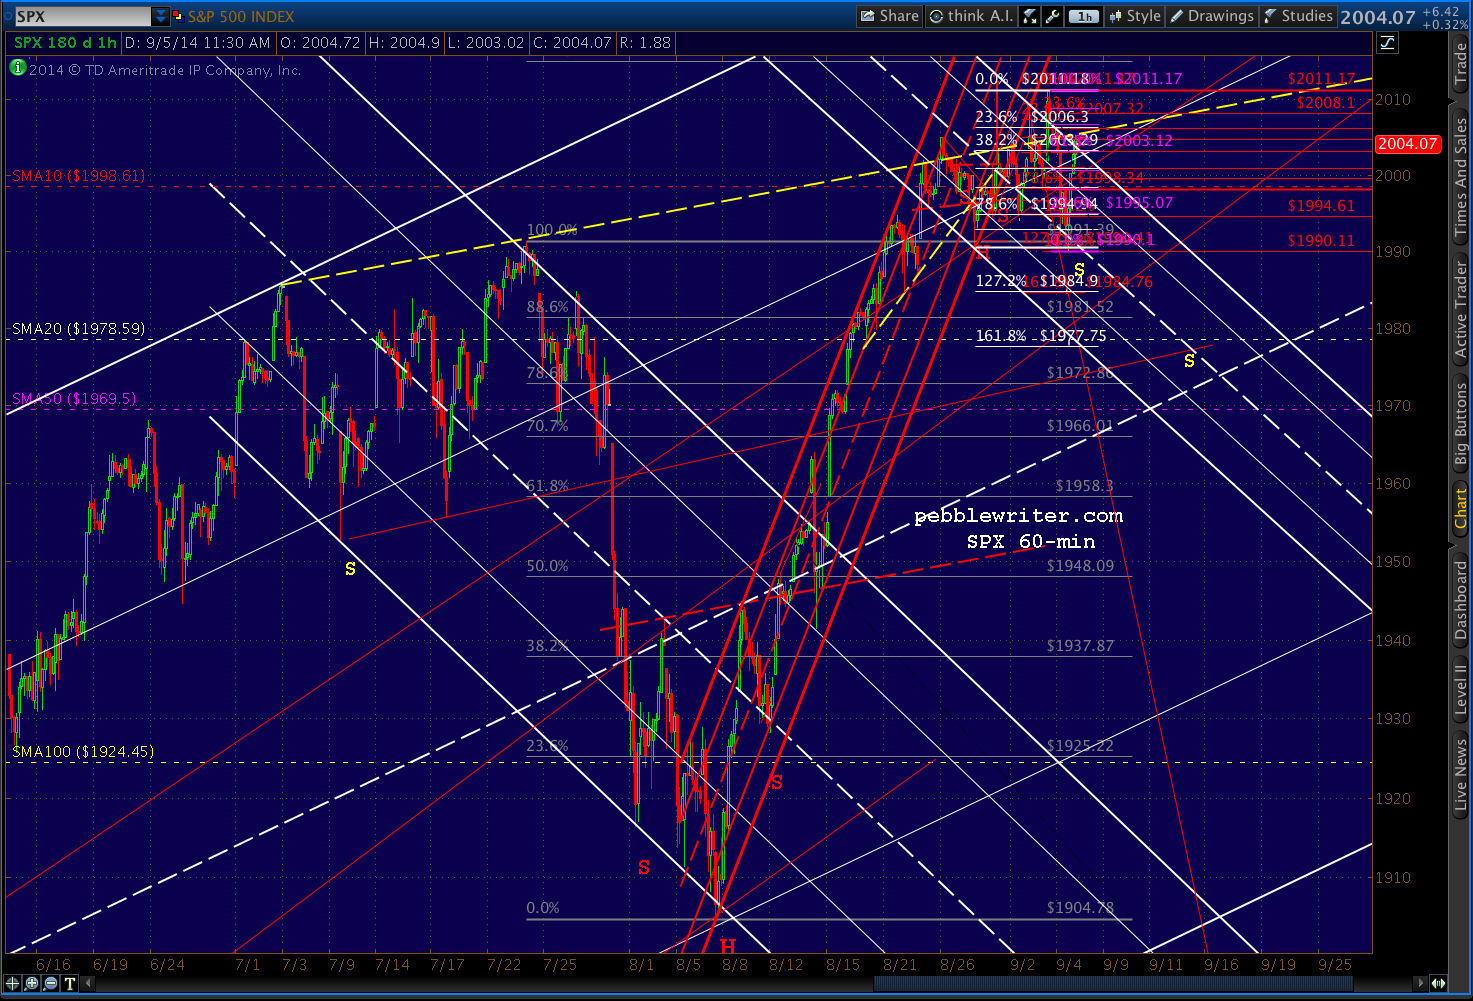
    2014-09-05-SPX 1200


  • Charts I’m Watching: Sep 4, 2014

    The USDJPY continues to tread water around the daily .886 retrace of the drop from Jan 2.

    140904_080506_CQG_Integrated_Client_Chart_USDJPY_-_Japan_(Yen)_Daily

    The futures went nowhere on BOJ’s non-action on rates or QE, but raced ahead 10 points on hopes that the ECB would pump up the volume.  As usual, Draghi’s speech was long on promises but lacking on real import.

    continued for members

    (more…)

  • Charts I’m Watching: Sep 3, 2014

    Keep an eye on USDJPY, which is due to react to under the major .886 (104.89) discussed yesterday.  Quick overview on SPX, which is likely to follow:

    (more…)

  • Charts I’m Watching: Sep 2, 2014

    Interesting chart from BofA, republished in Zerohedge this morning:

    Screen Shot 2014-09-02 at 6.14.38 AM


    USDJPY has shot up on continuing dismal economic news out of Japan, reaching the .886 retracement overnight of the drop from 105.43.

    2014-09-02-USDJPY daily 0600

    This coincides with a smaller scale potential reversal for SPX.

    (more…)

  • Charts I’m Watching: Aug 29, 2014

    Today’s setup: end of the month and holiday bullish bias and channel support versus disappointing economic data here and abroad (and, that war thing in Ukraine that the “market” doesn’t seem to care much about.)

    One wildcard is Japan.  The latest data was, again, horrid.  But, there’s increased talk of doubling the country’s pension plan’s allocation of stocks.  No economic recovery? No problem.  The carry trade should be safe for a while longer.

    (more…)

  • Charts I’m Watching: Aug 28, 2014

    So, the Head & Shoulders Pattern worked out after all.  Miracles never cease.  Last night’s plunge below the neckline hasn’t been erased by the inexplicable Q2 GDP estimate increase.

    (more…)

  • Charts I’m Watching: Aug 27, 2014

    Quick update on ES, which saw an interesting turn of events today…

    (more…)

  • Update on USDJPY: Aug 27, 2014

    USDJPY is faltering.  Recall that it recently tagged the large scale .618.  It has been in pullback mode ever since.  As I first charted in December 2013, pullbacks from the top of the yellow channel have always resulted in large stock market declines.


    2014-08-26-USDJPY wkly 20

    The latest, which started around the first of the year, hit a wall — or, rather, a floor.  The BOJ has aggressively defended the 101 level — negating the damage to both the red and grey channel damage done over the past several months.  Due to the wonders of the USDJPY carry trade, this has put a floor under stock prices as well.

    2014-08-26-USDJPY wkly

    As the rebound off the last bounce off the floor has accelerated, SPX (purple below) has hit new highs.

    If USDJPY’s pullback picks up steam, stocks should at least take a pause.  Keep an eye on the SMA10, which has held up since Aug 13. Two caveats before shorting anything:

    1. it would be unusual for it to happen in the last few days of the month
    2. most pullbacks in USDJPY have occurred in the overnight markets — leaving less of a mark on US stocks, and less of an opportunity for traders to participate.

    2014-08-26-USDJPY dailyOne last warning…USDJPY’s SMA50 is gaining on its SMA200. A Golden Cross is in the offing if the pair can maintain its momentum for the next week or so.

    GLTA.


  • Charts I’m Watching: Aug 26, 2014

    No joy on ES’ H&S Pattern, as this morning’s push topped the potential head — just like last night’s dip below 1992.75 trashed the other harmonic patterns (and, stopped out lots of bulls, no doubt.)  In short, the “market” isn’t sure what to do at this point.

    2014-08-26-ES 15 0641

  • Charts I’m Watching: Aug 25, 2014

    Potential IH&S for ES?  Looking for a potential pullback after SPX 2000, with USDJPY and interest rates representing at least temporary headwinds.

    2014-08-25-ES HS 0600


    UPDATE:  11:00 AM

    Small scale 1.618 for both ES and SPX.

    2014-08-25-SPX 5 0754

    The IH&S, if we get a pullback, for SPX.  USDJPY is slumping, but stocks are ignoring it at the moment.

    2014-08-25-SPX 60 0754

    UPDATE:  EOD

    Save by the bell (and USDJPY.)  Stocks reversed at the aforementioned 1.618, but weren’t allowed to get any momentum going.  Interestingly, this leaves more downside potential.

    (more…)