Year: 2014

  • Charts I’m Watching: Aug 13, 2014

    Third miss in a row for US retail sales, a massive 6.8% plunge in Japan’s GDP (biggest consumer spending drop ever,) industrial production misses in Europe and China, ugly earnings and forecast from bellweather Macy’s, renewed tensions in Ukraine, riots in Missouri…  why shouldn’t the “market” rally?

    In spite of the above…mission accomplished on the IH&S thanks to the bots.  Sigh…

    2014-08-12-SPX 15 1055

  • How Algos are Killing Off Traders

    I’ve been a big fan of chart patterns, harmonics and technical analysis for many years.  They’ve worked well for me, for those who follow this site, and for many generations of traders who came before us.

    Since late 2013, however, algorithmic trading has practically ruined these time-tested tools.  Unless you follow the market throughout the day, tick by tick, you might never realize the extent by which they determine stock prices.  I’ve had many conversations with veteran investors who have a hard time believing it until they set up multiple screens and watch the instruments involved side by side.

    There are many different types of algos involving all types of instruments, currencies, derivatives, etc.  All involve computers, and many involve high-frequency trading including quote-stuffing (hundreds or even thousands of orders are entered and cancelled within seconds in order to influence price direction), front-running (needs no explanation), layering (placing multiple large orders slightly away from the market to push it one direction or the other) and subpennying (providing a slightly better bid or offer in order to nudge the underlying higher or lower.)  There are many others, as illustrated in this chart from BlackRock (which uses less pejorative terms.)

    HFT

    In my experience, the most influential algo going today involves the USDJPY.  Many investors are aware of the dollar-yen carry trade.  The basic premise is that an investor borrows in yen and invest in stocks.  As long as the BOJ continues to trash the yen, it is presumed that the loan will cheaper to repay in the future – a riskless trade.  And, as long as central banks continue to prop up stock prices (directly in the case of Japan, indirectly practically everywhere else), the assumption is that the other side of the trade also riskless – a safe assumption for several years, now [note: the market averages 11 months between 10%+ corrections; it has now been over three years.]

    While the dollar-yen carry trade makes sense in a big-picture sense, many are surprised to learn that it is being used by algos to direct even minor moves in the markets throughout the trading day.  Currency markets are almost entirely unregulated and are extremely easy to manipulate.  There’s a nice collection of FT articles HERE, but any Google search for “forex manipulation” will provide plenty of reading material.  And, given the general lack of volume in the markets lately (gee, I wonder why?), the impact can be substantial.

    We’ll look at two blatant examples that occurred earlier today.  They’re not the most egregious I’ve seen, but they have the advantage of being fairly obvious to anyone who knows how chart patterns normally work.  First, we’ll look at the e-minis on a 5-minute chart.  Note the strong trend line (blue, dashed) connecting the highs of the day.  Note also that the declining Imoku Cloud guided prices lower throughout the day.  The chart is cut off at around 3:30pm EST, when ES was coming up to test the trend line for what was probably one last time during regular trading hours.

    140812_174810_CQG_Integrated_Client_Chart_EPU4_-_E-Mini_S&P_500_Sep_14_5_Min

    The 50-period moving average had also guided prices lower, with the 100-period line also pitching in.  A strong move higher at 3:30pm would have taken prices up to the trend line, and perhaps the SMA100 (marked as Point A.)

    The USDJPY chart looks fairly similar.  It also bears a strong trend line connecting the highs of the day.  One glaring difference is the it broke above its Imoku Cloud.  Though, it appeared to be contained within the cloud as it backtested the SMA50 and the trend line at around 3:30.

    140812_174903_CQG_Integrated_Client_Chart_USDJPY_-_Japan_(Yen)_5_Min

    In an unrigged market, one might expect both ES and USDJPY to turn lower in the last half-hour of trading.  From a harmonic standpoint, ES was aiming for a very mild 38.2% retracement (1921.61) of its rise from last week’s low.  It broke through the .236 (1929) without too much fanfare, and was backtesting it at 3:30 (shown below.)

    But, the USDJPY reversed higher when ES arrived at 1923.50.  And, when ES reached its trend line and the bottom of the Imoku Cloud for what should have been the start of another downturn, USDJPY suddenly spurted higher – breaking out of its downtrend (the top of its cloud, its trend line, a fan line, and the SMA50) on absolutely no news.   See Point A below.

    140812_175136_CQG_Integrated_Client_Chart_USDJPY_-_Japan_(Yen)_5_Min

    The impact on ES was powerful.  Within a few minutes, it followed suit – pushing up through the bottom of the cloud, the 100-period moving average, and its trend line.  Again, no news…just a strong signal from USDJPY that it should move higher.  Just in case the signal wasn’t clear enough, it was accompanied by the sudden cancellation of large sell orders that were positioned a few ticks higher, a vicious monke- hammering of VIX and 10-year note futures, and a 25-pt gap higher on Nikkei futures on negligible volume.

    140812_174843_CQG_Integrated_Client_Chart_EPU4_-_E-Mini_S&P_500_Sep_14_5_Min

    The result: ES shot up through the falling cloud, where it lingered until the 10-period moving average (thin, red) could catch up and provide support.  Note that the SMA5 carried it up to the SMA200 (thick, red) where it lingered until (need we ask?) another spurt by USDJPY got it over the hump (Point B.)  I don’t know where it goes from here, as USDJPY is bumping up against its 200-day moving average (102.34.)  It’s not that the market makers and/or BOJ can’t push it on through.  But, for such major moves, they usually wait until the middle of the night after Tokyo is done for the day (4am ET.)

    More typically, they’ll bring USDJPY back down to earth while propping ES up directly.  The overnight volume is ridiculously low, and the afore-mentioned tricks will usually suffice without having to involve USDJPY.  It shouldn’t be too difficult, given that ES is now perched safely on top of the rising Imoku Cloud.

    140812_200441_CQG_Integrated_Client_Chart_EPU4_-_E-Mini_S&P_500_Sep_14_5_Min

    The chart below shows both instruments and the various turning points USDJPY provided during the day.

    2014-08-12-ES v USDJPY


    Again, there’s nothing like a real-time, side-by-side comparison to appreciate the actual impact.  After seeing this done nearly every day for many, many months, it’s become fairly depressing.  The talking heads lament the markets’ low volume, but rarely acknowledge HFT and algos, much less discuss the huge impact they’re having.  The big HFT firms have wised up a bit, especially after Michael Lewis’ Flash Boys exposed many of their dirty little secrets.  They’re careful which way they push the market.

    What’s the big deal, as long as HFT and algos are used to drive the market higher?  Who doesn’t want higher stock prices, even if it comes at the expense of the legitimacy of the market?  The regulators are certainly aware of what’s going on.  But, as one client asked earlier today, how can we expect the feds to do something about it, when The Fed is one of the primary enablers?

    No doubt, the scourge will continue on just as long as it drives prices higher and provides plenty of commissions to the exchanges – no matter how many traders are run over in the process.   Should it cause, say, another flash crash, you can bet your bottom dollar there will be a swift and thorough investigation.

    Sigh…



  • Charts I’m Watching: Aug 12, 2014

    The rebound yesterday held fairly well, but USDJPY weakness this morning is softening up the futures.  Here’s the recap on SPX, showing the TL from 2012 holding, and a probable test of the 20 and 50 day moving averages at the purple .618 if the bulls can keep it together.

    2014-08-12-SPX daily 0600

    There’s clearly much more downside potential if the red TL doesn’t hold — with the SMA200 coming up on the white .618 toward the end of the month.

    Whatever the impetus might be left in last week’s move, the USDJPY algos are clearly back in charge. The eminis won’t make a move without it — though sometimes the AUDUSD, VIX or ZN’s come into play.

    The USDJPY tagged its SMA100 this morning, after failing to retake the SMA200 yesterday. I don’t see any serious impediments on the chart, as the BOJ has reestablished an upward trend for the pair.  And, the Japanese economic data is worsening daily.  But, with all the moving averages bunched up like this, we’re likely to see plenty of chop in the days ahead.

    2014-08-12-USDJPY daily 0700

  • Charts I’m Watching: Aug 11, 2014

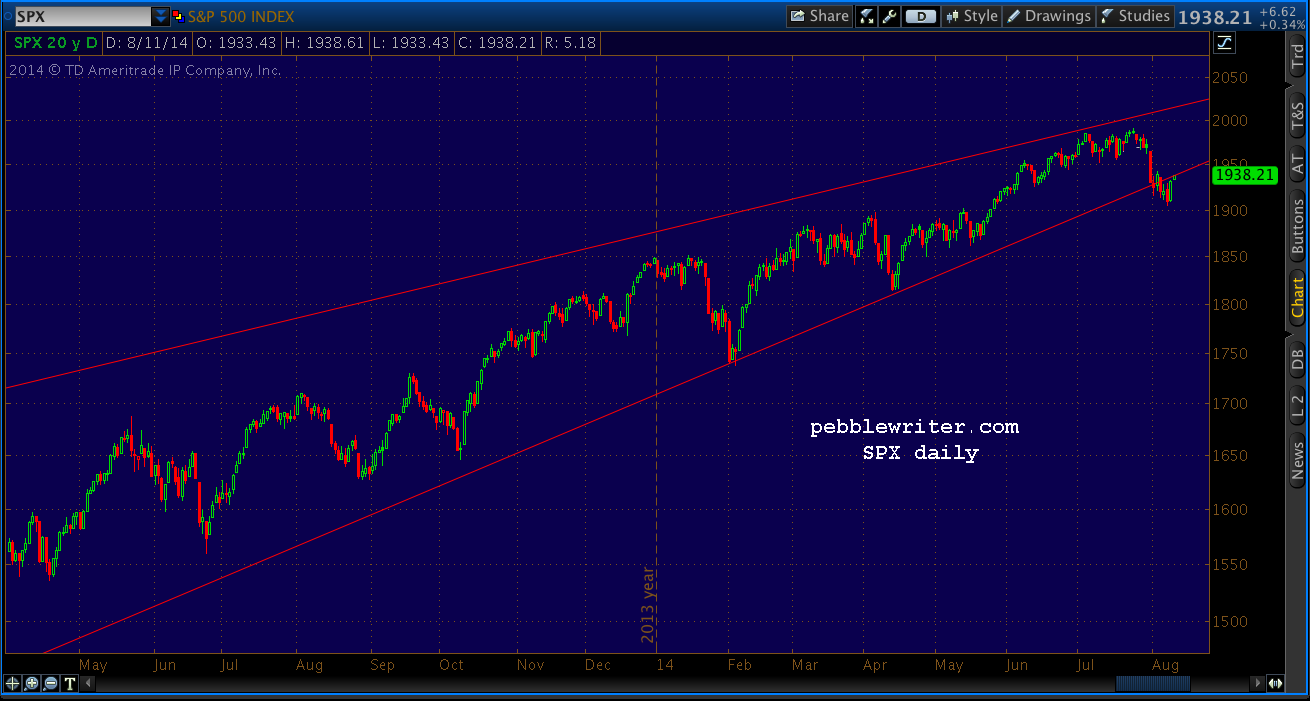
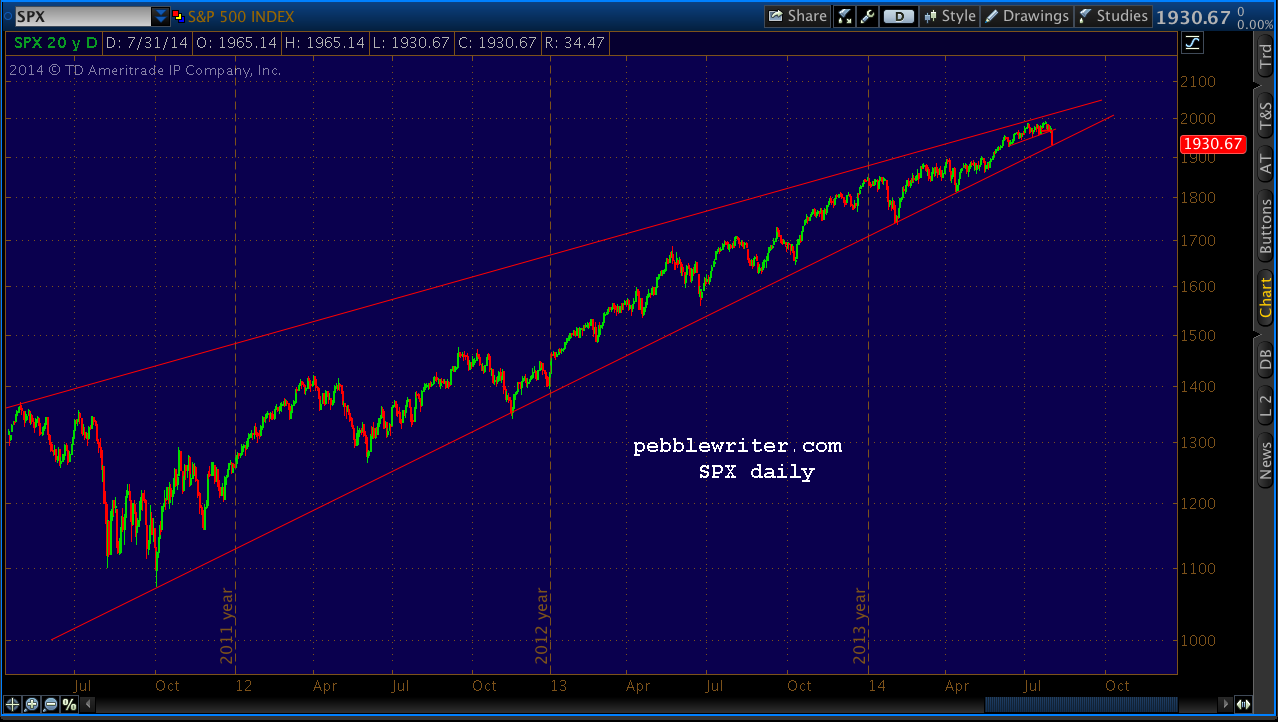
    Lots to catch up on after a week off… starting with last week’s big decline and (so far) recovery.  It wasn’t really that big.  But, when declines are so few and far between, it sure felt like it.  Check out SPX, which (finally) tested the trend line off the 2011 lows.

    2014-08-11-SPX daily 0600

    Looks pretty straight-forward, but it’s not.  In order to accommodate the Nov 2012 lows, the TL misses all of the 2013 and 2014 interim lows.  If we raise the TL a bit to catch at least the 2014 lows, then last week’s dip was below the TL, and the rebound through this morning is a backtest.

    2014-08-11-SPX daily 0650

    To further complicate matters, those are logarithmic charts.  In arithmetic mode, the TL fit is fairly bullish…

    2014-08-11-SPX daily 0700 arith

    …especially, when considering the moving averages.  Note the SMA100 tag, and the SMA10 which is being tested this morning.

    2014-08-11-SPX daily 0700 arith MAs

    It’s pretty clear to me that the algos are back in control this morning, with USDJPY/NKD ramps handily thwarting any attempts to digest any of the overnight gains. Bottom line, last week’s decline seemed rather contained/controlled.  My gut tells me it was permitted in order to bring a semblance of normality to the “markets” — to squelch the [quite accurate] criticism that the rally is being engineered.

    More later.

  • Charts I’m Watching: Aug 1, 2014

    What a day to be on the road!  I’m still traveling, but here’s a quick shot of yesterday’s and last night’s action. Note the long-term support TL in log scale.

    2014-08-01-SPX daily 0600

    The ES channel holds up pretty well, too.  And, while SPX overshot its 1.618 Fib, ES came in pretty close.  In other words, the fireworks are probably over.  We’ll likely be in rebound mode from here on out — assuming the plunge protection team is back in control. If so, then – in one fell swoop – TPTB can silence the technical/chart types such as yours truly who decried the ludicrous lack of downside moves.

    2014-08-01-ES daily 0546

    If things worsen in global banking, then there’s plenty more downside where yesterday came from.  SPX’s 100 day moving average is way down at 1910.  And, the SMA200 is 1857.  The past year has been characterized by moves that stop on a dime — or, more frequently, well short of their chart pattern/harmonic targets.

    It’s hard to say whether this is the start of something bigger, or whether TPTB was simply silencing the critics in the midst of a low-volume period when no one was watching (and, they themselves were well positioned in advance.)  But, if prices should move lower, I would keep in mind the possibility of a snap-back.  USDJPY has been pedaling furiously to keep things on an upward trend.

    2014-08-01-USDJPY daily 0620

    A reminder, I will be on vacation all next week.  But, I’ll post once in a while if the fish aren’t biting.  GLTA.

  • Charts I’m Watching: Jul 30, 2014

    Last night’s ramp job on the back of USDJPY, which sliced through the 100 and 200-day moving averages like they weren’t there, took ES most of the way.  The 4% GDP (ex-items?) print did the rest.  ES is sitting at an 8-pt gain prior to the open.

    2014-07-30-ESU4 15 0615

    Caution is warranted, as yesterday’s close marked the 3rd H&S Pattern in a row to complete without playing out (so far.)  The USDJPY/NKD ramp is BS, of course, as Japan’s industrial production fell 3.3% last month (versus 1.2% expectations.)

    2014-07-30-USDJPY 60 0615

    Still, the pair broke out.  If it can remain above the SMA200 long enough for the other averages to turn up and break the bearish alignment, it could drag stocks higher.  And, why shouldn’t it?  With the BOJ depressing the yen and actively buying stocks, it’s only a question of whether or not it fits their plans.

  • USDJPY’s Big Day

    USDJPY, having dutifully provided yet another overnight ramp job for ES, pushed up to tag the SMA200.  Note that the daily averages are still in a bearish alignment, though the 10 (red), 20 (gray) and 50 (blue) have recently curved up.

    140729_072038_CQG_Integrated_Client_Chart_USDJPY_-_Japan_(Yen)_Daily

    If the pair can push through the SMA200, stocks should follow.  If it pushed up much at all, it will have broken out of a very old triangle and would have potential to at least the .618 Fib at 112.37.  If not, the “market” is long overdue for a breather.  The last time USDJPY reversed off the SMA100 (July 3) and fell through the SMA200, SPX swooned by 33 points — a calamity by today’s Fed-inflated, volatility-deprived, algo-driven standards.

    2014-07-29-USDJPY daily MAs

    The BOJ and algo houses have propped up the USDJPY for months — particularly post May 2, when the rising white channel officially died.  The BOJ sees a lower yen as the key to increasing exports.  But, inflation is getting out of hand — killing off consumer spending at a time when tax revenue is sorely needed.  Algos use USDJPY as the basis for the largest carry trade out there — probably in the hundreds of billions if not trillions.  The cracks are starting to show.

    2014-07-29-USDJPY daily Chnl

  • Charts I’m Watching: Jul 28, 2014

    Friday’s conditions remain despite the late session VIX beat-down.  USDJPY’s SMA100 did, in fact, cross below the 200.  So, the daily SMA’s are all bearishly aligned — in addition to the TL resistance from the EOY highs.  The attempted break-outs over the past few sessions have gone nowhere.  Keep an eye on TL support at 101.76.

    2014-07-28-USDJPY 60 0530

    ES is playing its cards close to the vest, with the channel from Thursday and Friday yet to give up the ghost.  Our downside target remains until it can at least break out of the channel.  If things get going, ES 1959 is easily within reach, possibly 1956 or 1952.

    2014-07-28-ESU4 15 0600

  • Charts I’m Watching: July 25, 2014

    Amazon and Visa earnings should weight on markets today, but USDJPY is making a bid to blow through resistance.  This is critical, as the entire yen carry trade is at stake.  It was easy enough to burst through resistance overnight…

    2014-07-25-USDJPY 15 min 0625

    The daily chart shows the 100 and 200-day moving averages coming up on a potential cross, which would leave the 10, 20, 50, 100 and 200 all in a bearish alignment.

    2014-07-25-USDJPY daily

    ES has completed a little H&S Pattern, but has more downside potential if it’s permitted to get going.

    2014-07-25-ES 5 0545

    UPDATE:  2:00 PM

    ES tagged our H&S target, might be aiming for the Fib cluster at 1963-1964 (SPX 1968-1970.)  Decent channel support there, too.

    2014-0725-SPX 5 min 1100

  • Charts I’m Watching: Jul 24, 2014

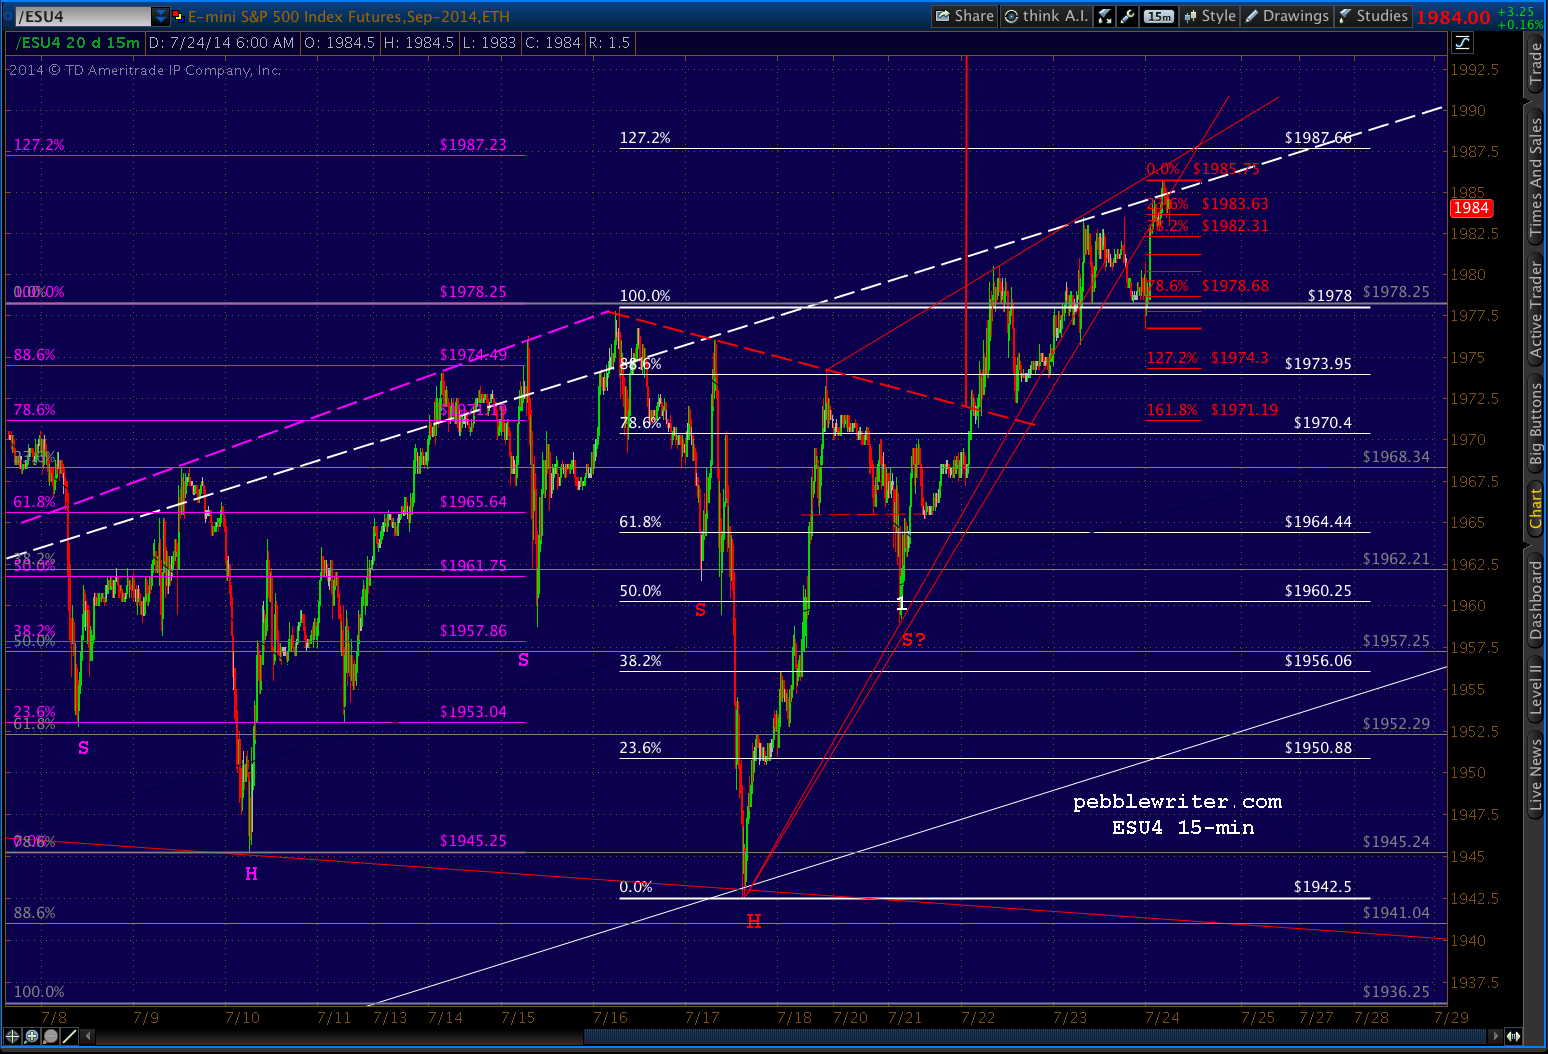
    Wednesday, the dip came early — with ES giving up 5 points early in the session before rebounding.  A Bat Pattern completed at 3am, sparking a 9-pt ramp job and continuing the “market’s” practice of making important reversals in the after-hours.  The net: hold overnight at your own risk, because the close is likely to be a head-fake.

    2014-07-24-ES 15 0615

    Interestingly, the futures have declined since the better than expected initial claims.  And, this on the biggest POMO day of the month. Go figure.

    UPDATE: 10:15AM

    Guess we know why the weakness on the opening, despite huge spikes in USDJPY and yields: the craptastic housing report was obviously well-known by some prior to the opening.  Like last June, no polar vortex, high interest rates or boogie man to blame it on…  From Zerohedge:

    Screen Shot 2014-07-24 at 7.16.38 AM

    In fact, it probably explains yesterday’s weak close, below the TL for SPX.  It’ll be interesting to see whether such dismal economic news can provoke even a small sell-off.

    Interesting historical note: the even worse July 2013 report was released on Aug 16.  SPX, in the middle of an 83-point, 18-day slump, fell 9 points on the day.  It was on the heels of a month-long correction that began on May 22 and knocked 126 points  (7.5%) off SPX.  At the time, the Fed was pumping $85 billion per month into the banks’ coffers (though Bernanke had already used the “T word” in June.)