Month: September 2014

  • Currencies Still Driving the Markets

    …borrowed from spindriftcap.com…

    This is not your father’s market.

    It continues to grind higher, largely on the back of the yen carry trade (along with stock buybacks, margin expansion, etc..)  Recall that at the start of 2014, SPX sold off when USDJPY reached a reversal point (after an overshoot based on USDJPY’s Dec 18 ramp.)  But, the Bank of Japan put a floor under USDJPY, enabling the carry trade to keep SPX on an upward track.

    2014-09-30-USDJPY v SPX

    The USDJPY breakout in mid-August stopped SPX’s decline in its tracks after only 87 points (4.3%.)  Since then, USDJPY has raced higher, barely pausing along the way.  Why?  Each time it does, stocks stumble.  In other words, stocks can’t afford for USDJPY to decline — AT ALL.  In fact, SPX has been unable to follow through with new highs since USDJPY reached the 1.618 Fib level, where it was merely expected to correct.

    Japan is flat broke.  Trashing the yen and buying Japanese stocks with borrowed money are the only tricks Abe and Kuroda can come up with to get back on track.  The only thing they’ve accomplished is to increase inflation (esp. food and fuel) significantly for the Japanese taxpayer, who is now paying much higher taxes to service the vastly increased debt.

    At its current pace, USDJPY should reach our next upside target (110) either today or tomorrow. If it can rejoin its rising red channel, stocks should recover and continue to 2138.  If it reverses, it’s hard to believe SPX’s SMA100 will hold yet again.

    The euro is another interesting case.  Previous tags of the TL from 2009 have resulted in stock corrections.  Not so, this time.  Past bouts of dollar strength have meant a flight to safety. Now they just reflect the games being played with the yen carry trade. I don’t know how long the rising wedge can continue to rise, but I suspect its days are numbered.

    2014-09-30-EURUSD v SPX

    The dollar chart, itself, tells a compelling story.  Again, past instances of dollar strength have meant stock weakness (a negative correlation.)  Since USDJPY began its meteoric rise, however, stocks have taken off like a shot and are now positively correlated with the dollar.

    2014-09-30-DX v SPX 20

    The index has reached very strong technical resistance, and appears to be in the final days of a throwoever.  But, if it can break out, stocks should get a substantial boost (again, not because a strong dollar is good for stocks, but because it means the dollar – or euro? – carry trade is working.)

    2014-09-30-DX v SPX

    GLTA.


  • Charts I’m Watching: Sep 29, 2014

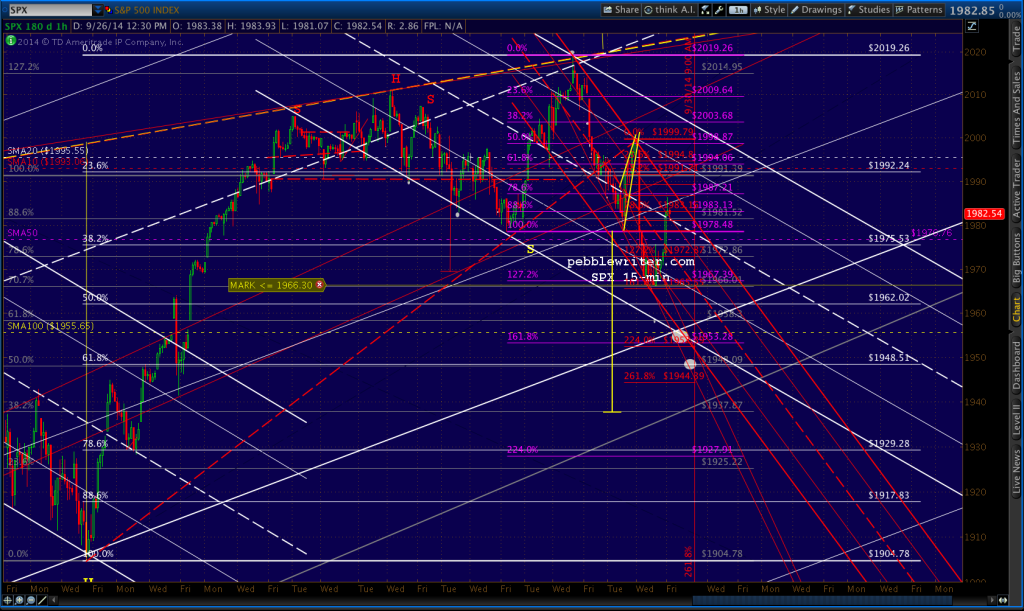
    Our downside targets from two weeks ago remain in force: the 100-day moving average and the .618 retrace from the recent highs: 1948-1955 on SPX.)  The all-clear will be a break through the .500 Fib at 1962.

    2014-09-29-SPX 60 0600

    It’s quite possible we’ll get a bounce at the moving average before going down to tag the .618 later.

    2014-09-29-SPX 60 0601


    UPDATE:  12:00 PM

    Downside arrested by NKD’s 1% rule again — back above the SMA50.  FWIW, there’s a gap to close at SPX 1981.07 (just shy of the .786 from 1986-1964) and VIX 14.78.   GLTA.


  • Before and After

    In speaking with a bright, young financial planner (okay, it was my son) yesterday, I heard a notion that I just can’t get out of my head.  I was bemoaning the algorithmic state of affairs, how the markets are being propped up by the BOJ, ECB and FOMC with currency manipulation, outright stock purchases and derivative tampering (VIX and treasury futures, among others.)

    My son, who is certainly smarter than I, suggested that it was a good thing.  To paraphrase, he asserted that it allowed investors to build wealth without having to worry about the market crashing.  He’s right.  It’s great logic… if the manipulation can be applied ad infinitum and without consequences.

    But, there are consequences.  The Japanese face higher food and oil costs due to the continual devaluation of the yen. American exporters are choking on the higher dollar.  Those who want to purchase real estate are subject to inflated prices.  Retirees are earning negative real returns on CDs and T-bills.  There are many more.

    But, the consequence that worries me the most is what these practices do to an investor’s frame of mind.  There are countless retirees out there who can’t make it on the 0.15% CD the bank offers.  They’re lured into the stock market (some would say “forced”) by the promise of high, risk-free returns.

    Unfortunately — unless hundreds of years of history mean nothing — the market will go down eventually (that pesky ad infinitum part.)  I don’t expect Yellen, Kuroda and Draghi will be around to help those who are wiped out — any more than their predecessors were in 2008-2009.

    Pension plans, insurance companies, S&L’s, banks — all will be affected, of course — especially those with any exposure to the $1.5 quadrillion in derivatives sloshing around out there in the liquidity pool. The biggest will probably be bailed out.  Again.  And, the rest of us will scratch our heads and wonder why this keeps happening.

    My son turns 25 next month.  I hope he reaches his 30s without having to face a market meltdown.  But, in my estimation, the odds aren’t that great — not as long as our long-term financial stability is undermined by the false promise of riskless investing.

     *  *  *  *  *

    Speaking of which…this morning, I published these charts of the NKD and USDJPY — which were poised to reverse at their .886 Fibonacci levels.

    2014-09-25-NKD and JPY 15 0600

    Of course, that would have meant further downside for stocks.  So, what did NKD and USDJPY do, instead?  New highs!  Ain’t life grand?

    Check out the effect on SPX, the thin purple line — which has either started higher again after a corrective 3 waves or is taking a breather, a la Wednesday, on its way lower.  My guess is the latter, with today’s bounce as a corrective wave 4 (it closed below Tuesday’s closing price.)

    BTW, I wouldn’t be surprised to see the NKD and USDJPY’s gains evaporate after the “market” closes, having done their jobs and all.

    2014-09-25-NKD and JPY daily 1200

    Have a great weekend, everyone.

  • Charts I’m Watching: Sep 26, 2014

    The USDJPY and NKD ramped back to .886 retraces of their previous highs (suggesting a reversal here), but ES has only managed a slight gain overnight.

    2014-09-25-NKD and JPY 15 0600

    This begs the question of whether we’ll get some follow-through from yesterday.  I think so.

    continued for members... (more…)

  • What Happened?

    After reaching the 50-day moving average as we expected, SPX sold off another 10 points to…well, nothing really.  It just stopped going down, even though the 100-day moving average was all teed up just below. It was a lot like yesterday, when we got oh-so-close to the SMA50, but couldn’t seal the deal thanks to the Nikkei and USDJPY.

    Curious what happened this time — why it seemed for several hours as if there was a floor under stocks?   Do you REALLY not know?

    Same crap, different day.  The 1% Rule kicked in at NKD 16,130, and the “unrigged market” enjoyed the magical levitation that only algorithims can deliver.  As we discussed yesterday [see: Ah, So…]  we won’t have rational markets as long as the BOJ, ECB and FOMC are writing the script.  And, with 7 trillion yen (about $65 billion) in Japanese stocks on its books (so far) the Bank of Japan has full editorial control.

    NKD reached the Dec 31, 2013 high on the nose today before reversing sharply.  One might have expected at least a backtest of the .886 (16,100) or the 10-day moving average (16,094.)  But, the BOJ jumped in and bought with both hands because the futures reached a 1% loss on the day (hence, the 1% Rule.)

    2014-09-24 NKD 60 1400

    What they do next will be very interesting.  After reversing this morning, NKD retreated back below the trend line connecting the May 22 and December 31, 2013 tops (purple, dashed line below.)  Is has yet to close above this line, so I tend to think it’s important.

    2014-09-24 NKD v SPX 1400

    If SPX can lose 32 points on a failure of NKD to make new highs, imagine how it’ll react if NKD actually sold off a bit?

    2014-09-24 NKD v SPX CU 1400

    Don’t get me wrong.  This is not a prediction.  The technical and fundamental rules that used to govern prices left the building a long, long ago.  But, it does make one wonder — seeing how tomorrow’s a new day, with a new 1%…

  • Charts I’m Watching: Sep 25, 2014

    Nothing new since yesterday, except ever more overbought DX, USDJPY and NKD.

    SPX’s SMA50 is still in view, despite yesterday’s nonsensical algo-rally that created a nice little rising wedge.  Keep an eye on the falling red channel, as it also offers a potential path to the SMA100 if TPTB so wish.

    2014-09-24 SPX 15 0600

    UPDATE:  12:30 PM

    Since we reached and surpassed the SMA50, here are a few additional mileposts for any further decline:

    SPX:  SMA100 at 1953 or .618 Fib at 1958, and an interim target at 1965-1967
    NKD:  16,095 or 16,060
    USDJPY: 108.40
    10-yr: 2.495%, 124’275
    VIX: 16.85 or 17.23 (but, lots of games being played here – witness the .58 candle on 1-min chart at 12:40)


  • Ah, So…

    Don’t have much to add to this, other than the farce has now gone full tilt.

    From Nikkei Asian Review:


    TOKYO — The Bank of Japan is growing into its role as a key source of support for the country’s stock market, as it has stepped up purchases of exchange-traded funds to bring its equities portfolio to an estimated 7 trillion yen ($63.6 billion) or so.

         The central bank bought 123.6 billion yen worth of ETFs in August, the largest monthly tally so far this year. At one point, it snapped up ETFs in six straight sessions amid weak stock prices.

         The BOJ tends to make 10 billion yen to 20 billion yen worth of purchases when stock prices fall in the morning. The bank has not made any purchases so far in September because the market has been rallying.

         According to BOJ data, the market value of individual stocks and ETFs that it held as of March 31 came to 6.15 trillion yen. Given its purchases since then and the market rally, the value is estimated to have increased to a whopping 7 trillion yen or so by now.

         That figure accounts for 1.5% of the entire market value of all Japanese shares, or roughly 480 trillion yen. It also means the BOJ may surpass Nippon Life Insurance, the largest private-sector stock holder with some 7 trillion yen in holdings, as early as this year and emerge as the second-biggest shareholder behind the Government Pension Investment Fund — the national pension fund with 21 trillion yen.

         The BOJ started outright purchases of shareholdings from banks back in 2002 with the aim of stabilizing the country’s financial system. To prevent stocks from tumbling steeply, it also began buying ETFs in 2010. The bank does not buy individual shares now, but it doubled its annual ETF purchases to 1 trillion yen when it introduced unprecedented levels of monetary easing in April 2013.

         It is unusual for a central bank to buy stocks and ETFs, given that their sharp price swings pose the risk of undermining the health of the bank’s assets. High levels of purchases by the BOJ affect stock prices and may hurt asset allocation and development of the financial markets.

         The timing and technique of selling the BOJ’s shareholdings are also a tricky question. A freeze has been put on sales of individual shares until March 2016, and there is no selling schedule for ETFs. But given that the bank’s holdings are equal to roughly half the 15 trillion yen in net buying by foreigners last year, large-scale selling would be certain to shake the market.

    For anyone who hadn’t noticed, there was a direct and immediate impact on US stocks courtesy of the yen carry trade.  The latest example occurred this morning, when the Nikkei was plunging, along with SPX.  While the new home sales news was widely regarded as giving the “market” a boost, it was actually USDJPY and NKD — with a healthy dose of VIX smashing courtesy of the Chicago branch of the FOMC (aka Citadel.)

    2014-09-24NKD v ES 1203

    No rational buyer would step in and catch this falling knife.  Fortunately for the “markets,” the BOJ has no problem with irrational actions. That’s what teetering on the brink will do for you.  At least they have the decency to admit their actions, unlike the FOMC — which resorts to indirect manipulation.

    Look for the big reset after US markets close.  USDJPY and NKD will drop like rocks, while TPTB should have no trouble propping up futures in the low-volume after-hours (if that’s what the script calls for.)


  • Charts I’m Watching: Sep 24, 2014

    SPX landed on an .886 Fib retrace at the close yesterday.  Given that TPTB don’t want a 4-day decline on their hands, we’re likely to see a bounce today.  But, the medium-term target of the SMA50 (1976) remains if the USDJPY-driven ramp job can’t turn this ship around.

    2014-09-24-SPX 15 0600

    UPDATE:  10:45 AM

    Stronger than expected (seasonally adjusted) housing sales turned the bears back for now. But, SPX hasn’t yet managed to break out of the falling red channel.  If it doesn’t, the SMA50 is still down there at around 11:30ish.

    2014-09-24-SPX 5 0747

    Not that you’ll ever hear this on MSM, but the Commerce Department’s new home sales are based on permits expected to be issued based on deposits taken or sales agreement signed and is generated by surveying a sample of builders. It doesn’t represent permits issued, financing obtained or transactions closed.  Further, there is a huge margin of error (16.3%) on the headline 18% number reported.  So, the actual number could just as easily be 1.7%.  Per the Commerce Department.

    The survey is primarily based on a sample of houses selected from building permits. Since a “sale” is defined as a deposit taken or sales agreement signed, this can occur prior to a permit being issued. An estimate of these prior sales is included in the sales figure. On average, the preliminary seasonally adjusted estimate of total sales is revised about 4 percent.

    The non-annualized, non-seasonally adjusted estimate based on survey results was 41,000 units versus July’s 38,000 — a 7.8% increase over July, but with a margin of error that makes that figure meaningless.  The unadjusted year to date through August figures were up 2% versus 2013, but with a 3.7% margin of error. Note that even the Commerce Department reports an average revision of 4%.

    In sum, garbage-in, garbage-out.  When you make a small error, and then annualize it, the results can look sensational.  Last point on this: the median price continues to drop.  Since May, when prices peaked out at $285,600, this is the third lower median price in a row.  This is not exactly a sign of a recovering market.

    Those piling in on this dip should exercise caution.  I still show downside potential at around 1:15-1:30pm.  Keep an eye on the 10-yr notes, which just tested the SMA100 again.  I see yields dipping below 2.5% either today or tomorrow.


    Screen Shot 2014-09-24 at 9.16.23 AM


    UPDATE:  2:00 PM

    Algo’s are firmly in control again, with VIX ticking lower and USDJPY higher.  The target appears to be a backtest of the SMA10 or SMA20 at 1996 — 1998.


  • Charts I’m Watching: Sep 23, 2014

    SPX looks likely to test the .786 initially, after which we should see a bounce to at least the .618 and backtest the channel top.

    2014-09-23-SPX 15 0600

    Unless it breaks out, the medium-term target of the SMA50 remains.

  • Charts I’m Watching: Sep 22, 2014

    As we surmised Friday, SPX reversed at the IH&S neckline and moved lower.  As was widely reported, hundreds of stocks flash-crashed into the close.  This cast a negative pall into the weekend which continues this morning thanks to the negative QE news out of EZ and China.  Futures are attempting a comeback, but we should see continued weakness after the early morning ramp.  Lots of wildcards, though, as we have existing home sales from the NAR at 10am and lots of Fed-speak on deck.

    2014-09-22-SPX 15 0600