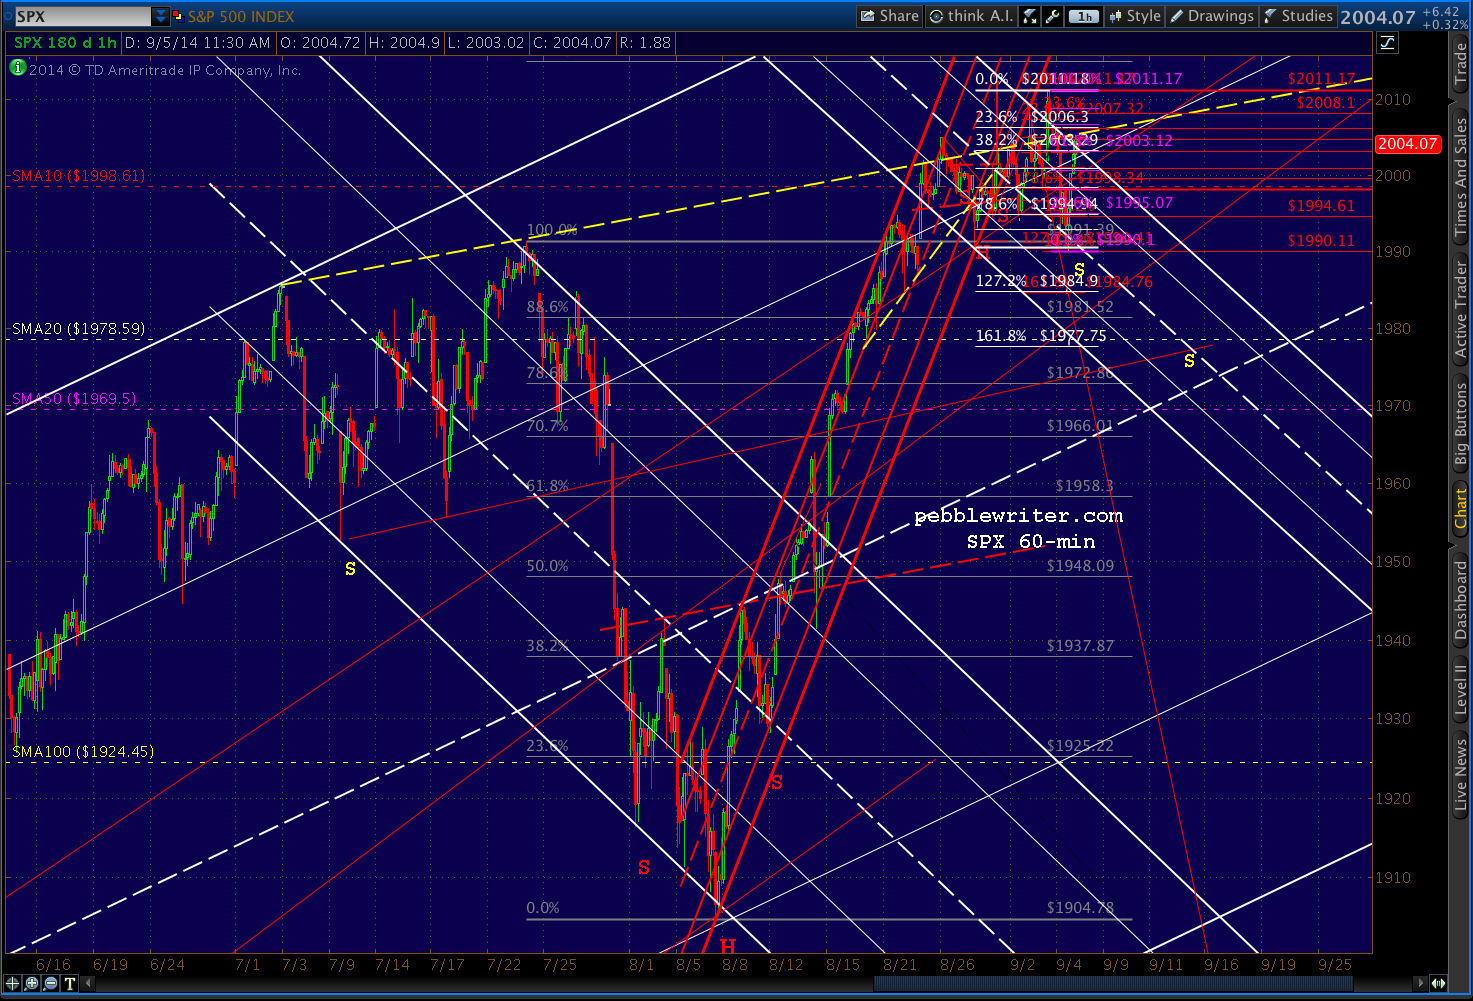
Futures spiked 10 points on the crappy jobs data, then promptly gave most of it back. Key chart factors: yesterday’s late day plunge further distanced stocks from the rising white channel. The backtest we surmised would lead to a decline seems to be underway, but not without a fight from the algos — characterized by three backtests (so far) of the purple channel. Yesterday’s downside target remains in play until stocks climb back into that channel and stay there.
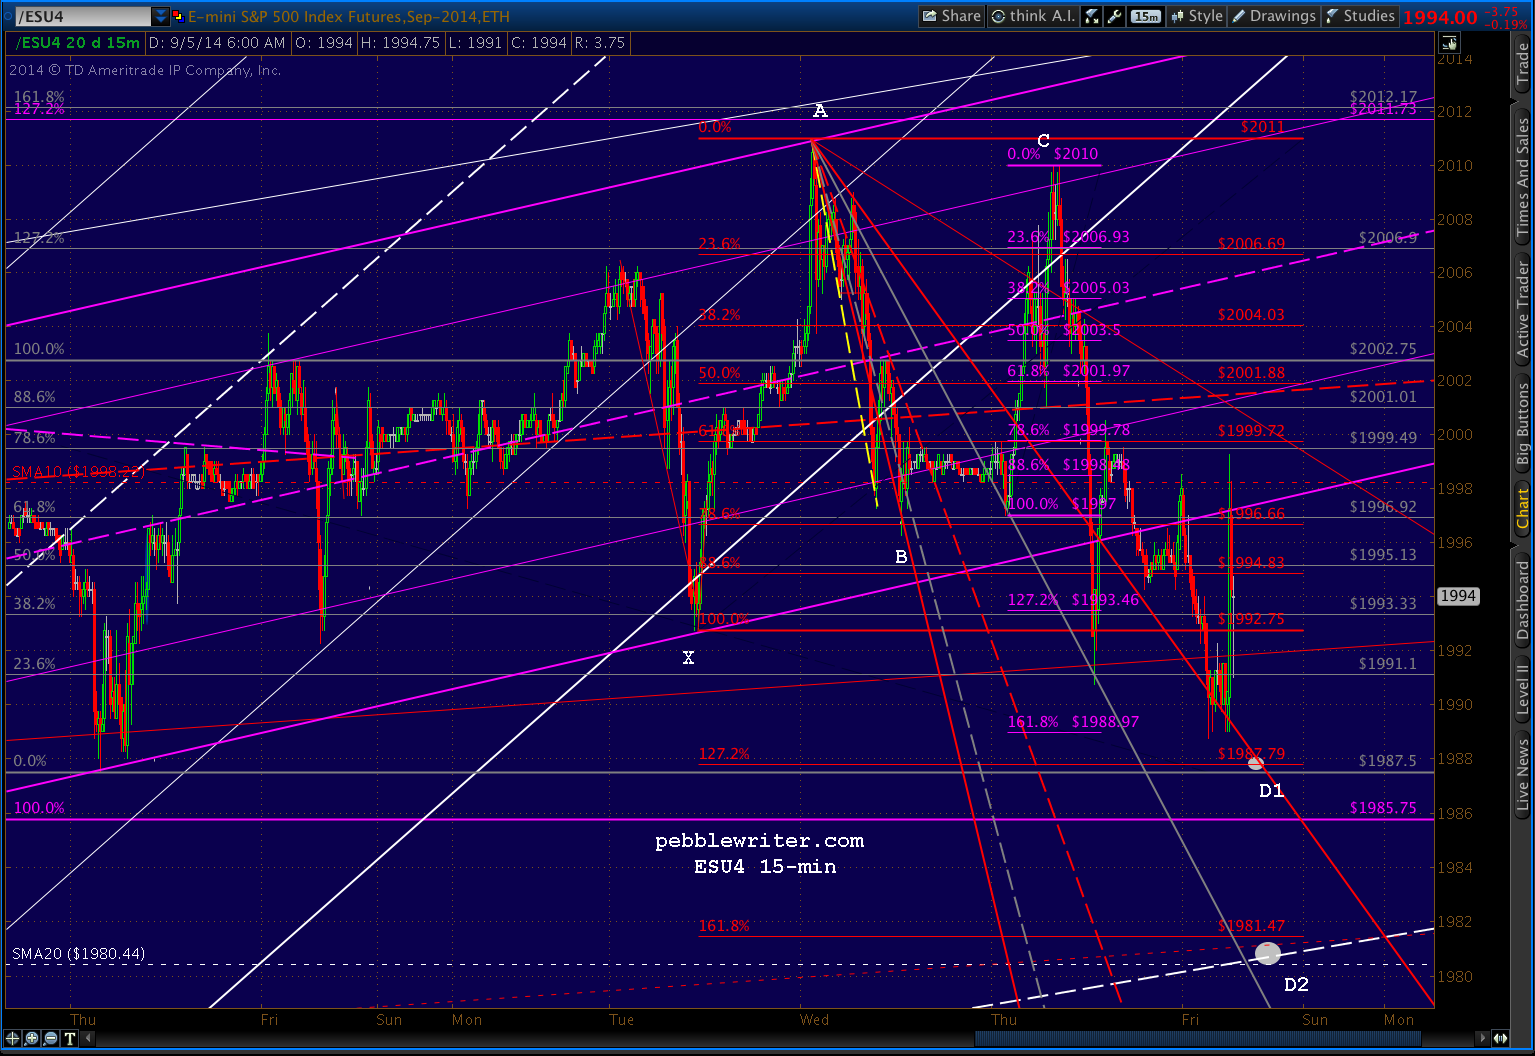
While D1 would suffice as a Butterfly Pattern, D2 (1980ish) represents the SMA20 and the red 1.618 and the larger white channel midline. As such, it makes a much more appealing target — if TPTB allow the market to settle a little lower. And, lately, that’s a huge “if.”
Bonds prices shot up on the data this morning, clearing a falling channel. And, the USDJPY is struggling after setting a new high overnight (based more on USD strength than JPY weakness.)
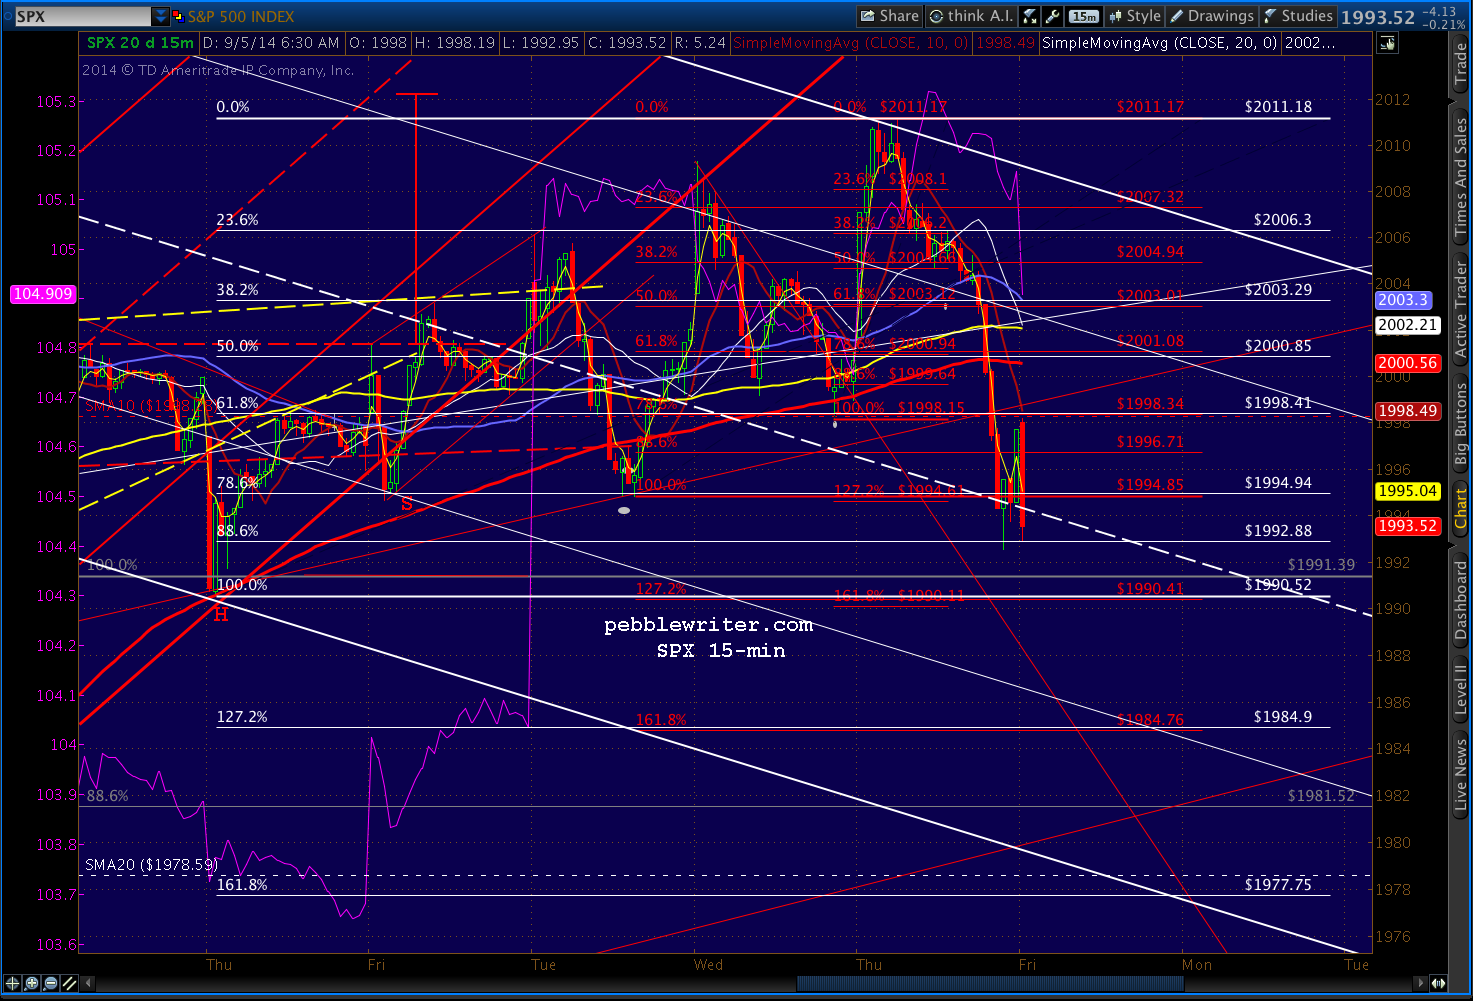
The backtest by SPX is a little cleaner, but the same downside target is worth watching. On the SPX chart, 1977 represents the SMA20, the white 1.618 and the falling white channel bottom.
UPDATE: 12:30 PM
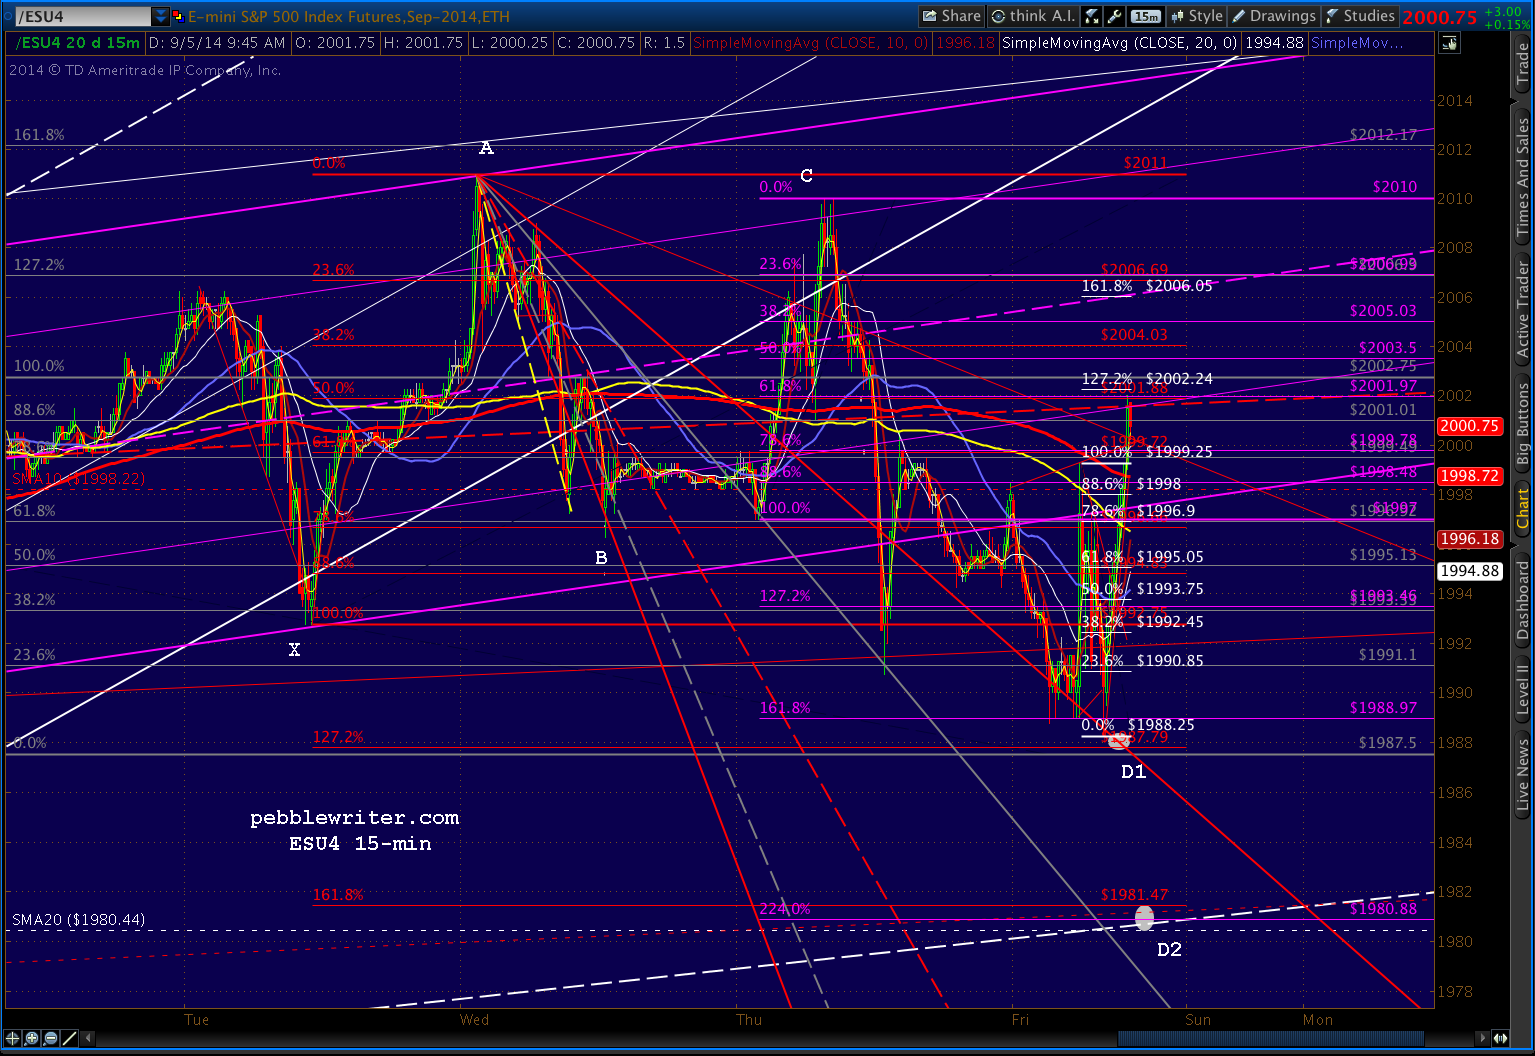
ES tagged our D1 target on the nose this morning. It remains to be seen whether we’ll get another thrust lower.
Algos have taken over again, driving the DX up toward the .886 and SMA200 on 5-min chart.

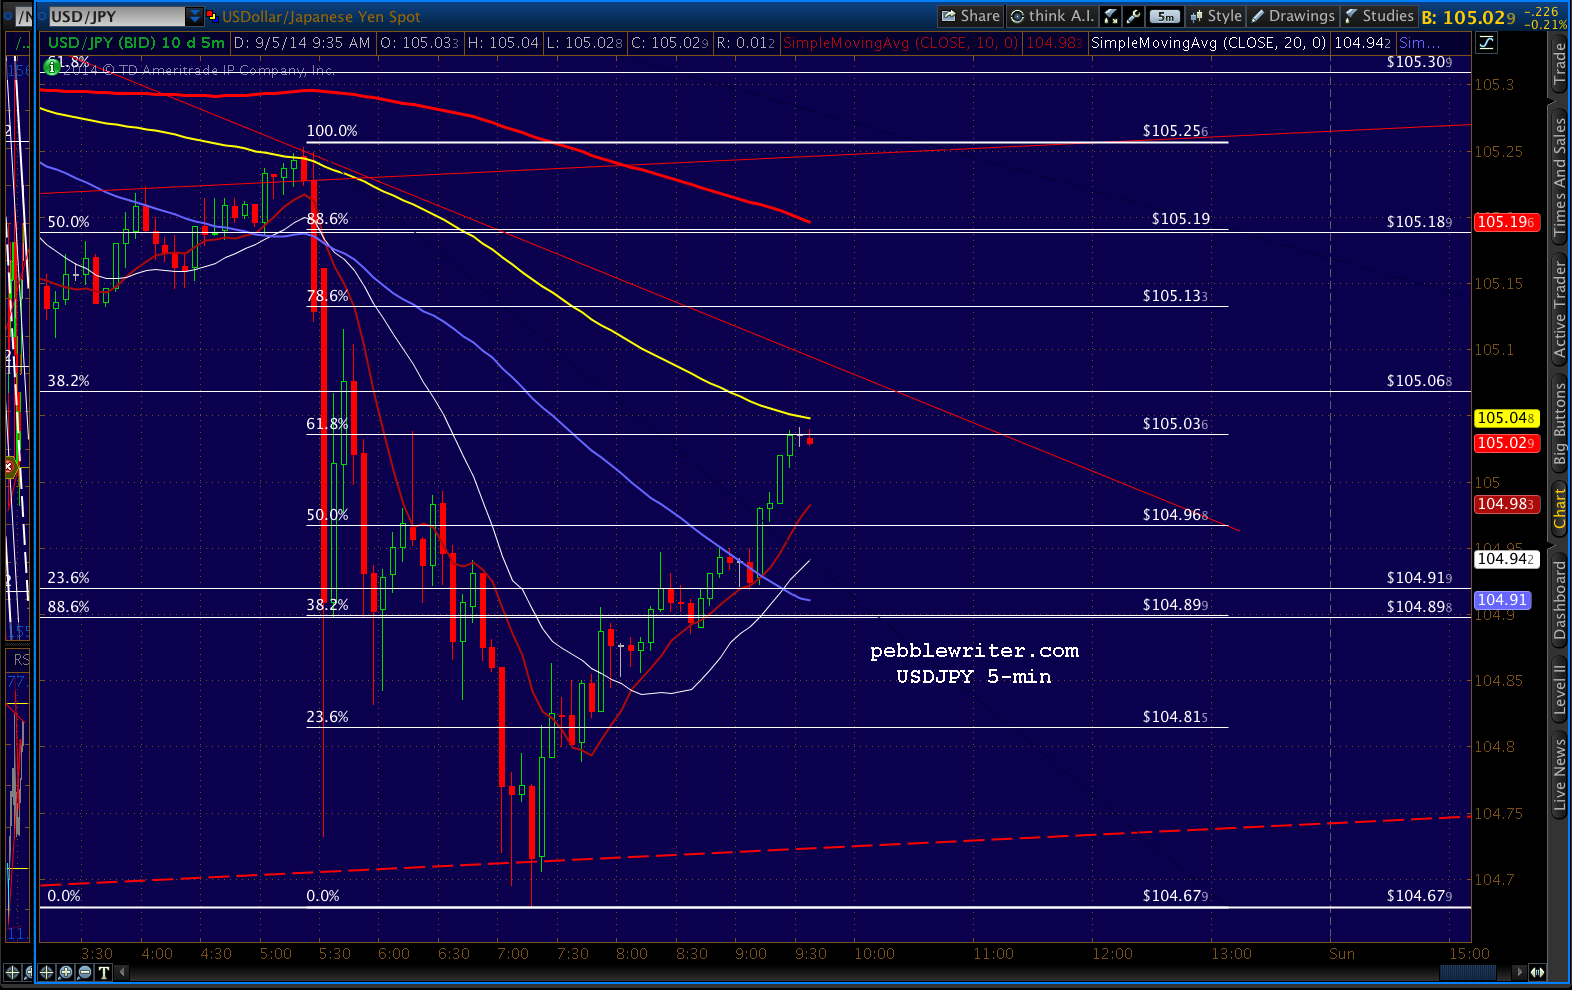
Might get a reversal here, given that USDJPY is approaching its SMA100 on the 5-min — scene of its strong reversal early this morning.
Lots of fib and channel overhead resistance at SPX 2003ish…
UPDATE: 2:55PM
SPX overshot the resistance, and is possibly backtesting it as support. FWIW, the yellow dashed line running through the chart is the neckline of the big H&S Pattern from July. Its

Seen below in yellow. Take your pick of right shoulders — either done or something more balanced like the lower “S” at the white channel midline. Obviously, prices have pushed through the neckline several times before — but, without any follow-through (your “market” run by algos…)